| Param | Original file | Final file |
|---|---|---|
| Filename | modeM0/AS1G08_002T01_9000002072_14037cztM0_level2.evt | modeM0/AS1G08_002T01_9000002072_14037cztM0_level2_quad_clean.evt |
| Size (bytes) | 472,786,560 | 83,577,600 |
| Size | 450.9 MB | 79.7 MB |
| Events in quadrant A | 3,316,522 | 524,374 |
| Events in quadrant B | 3,382,516 | 527,272 |
| Events in quadrant C | 3,342,457 | 520,288 |
| Events in quadrant D | 3,835,451 | 505,416 |
| Mode M9 | |||
|---|---|---|---|
| Quadrant | BADHDUFLAG | Total packets | Discarded packets |
| A | 0 | 19 | 0 |
| B | 0 | 19 | 0 |
| C | 0 | 19 | 0 |
| D | 0 | 20 | 0 |
| Mode SS | |||
|---|---|---|---|
| Quadrant | BADHDUFLAG | Total packets | Discarded packets |
| A | 0 | 132 | 0 |
| B | 0 | 132 | 0 |
| C | 0 | 132 | 0 |
| D | 0 | 132 | 0 |
| Mode M0 | |||
|---|---|---|---|
| Quadrant | BADHDUFLAG | Total packets | Discarded packets |
| A | 0 | 13965 | 3 |
| B | 0 | 14088 | 2 |
| C | 0 | 13895 | 2 |
| D | 0 | 15433 | 2 |
| Quadrant | Total seconds | Saturated seconds | Saturation percentage |
|---|---|---|---|
| A | 6502 | 99 | 1.522608% |
| B | 6502 | 99 | 1.522608% |
| C | 6502 | 76 | 1.168871% |
| D | 6502 | 131 | 2.014765% |
Noise dominated data is calculated using 1-second bins in cleaned event files. If a bin has >2000 counts, and if more than 50% of those come from <1% of pixels, then it is considered to be noise-dominated and hence unusable.
| Quadrant | # 1 sec bins | Bins with >0 counts | Bins with >2000 counts | High rate bins dominated by noise | Noise dominated (total time) | Noise dominated (detector-on time) | Marked lightcurve |
|---|---|---|---|---|---|---|---|
| A | 7628 | 6504 | 0 | 0 | 0.00% | 0.00% | 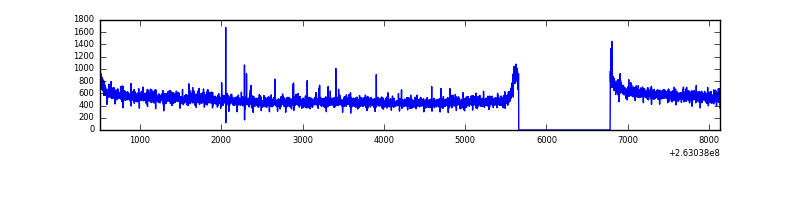 |
| B | 7628 | 6504 | 3 | 3 | 0.04% | 0.05% | 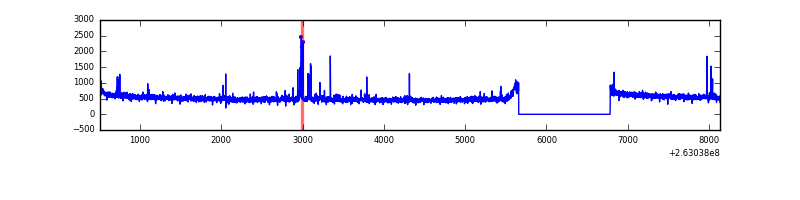 |
| C | 7628 | 6504 | 0 | 0 | 0.00% | 0.00% | 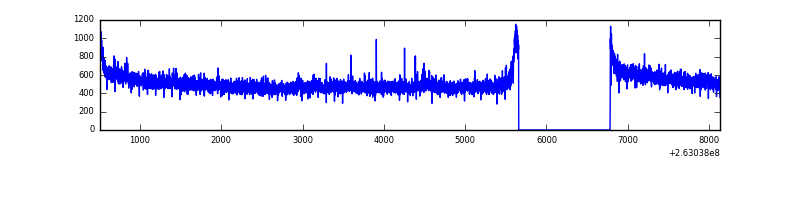 |
| D | 7628 | 6504 | 31 | 31 | 0.41% | 0.48% | 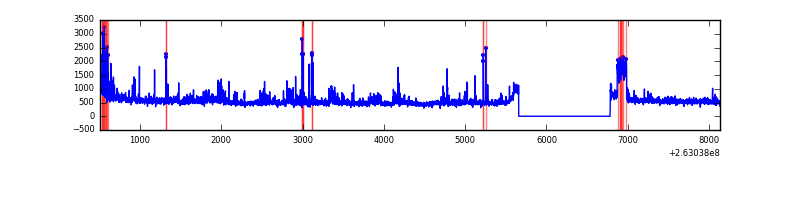 |
Top three noisy pixels from each quadrant. If the there are fewer than three noisy pixels in the level2.evt file, extra rows are filled as -1
| Pixel properties | Quadrant properties | ||||||
|---|---|---|---|---|---|---|---|
| Quadrant | DetID | PixID | Counts | Sigma | Mean | Median | Sigma |
| A | 1 | 162 | 24945 | 139.24 | 851 | 834 | 173.2 |
| A | 1 | 178 | 8659 | 45.19 | 851 | 834 | 173.2 |
| A | 1 | 161 | 7645 | 39.33 | 851 | 834 | 173.2 |
| B | 0 | 230 | 55724 | 343.88 | 839 | 820 | 159.7 |
| B | 10 | 244 | 21966 | 132.44 | 839 | 820 | 159.7 |
| B | 12 | 111 | 19278 | 115.61 | 839 | 820 | 159.7 |
| C | 3 | 233 | 108636 | 568.32 | 821 | 828 | 189.7 |
| C | 14 | 220 | 32913 | 169.14 | 821 | 828 | 189.7 |
| C | 13 | 61 | 5895 | 26.71 | 821 | 828 | 189.7 |
| D | 1 | 52 | 332692 | 1706.72 | 817 | 798 | 194.5 |
| D | 10 | 157 | 212934 | 1090.88 | 817 | 798 | 194.5 |
| D | 8 | 195 | 123938 | 633.23 | 817 | 798 | 194.5 |
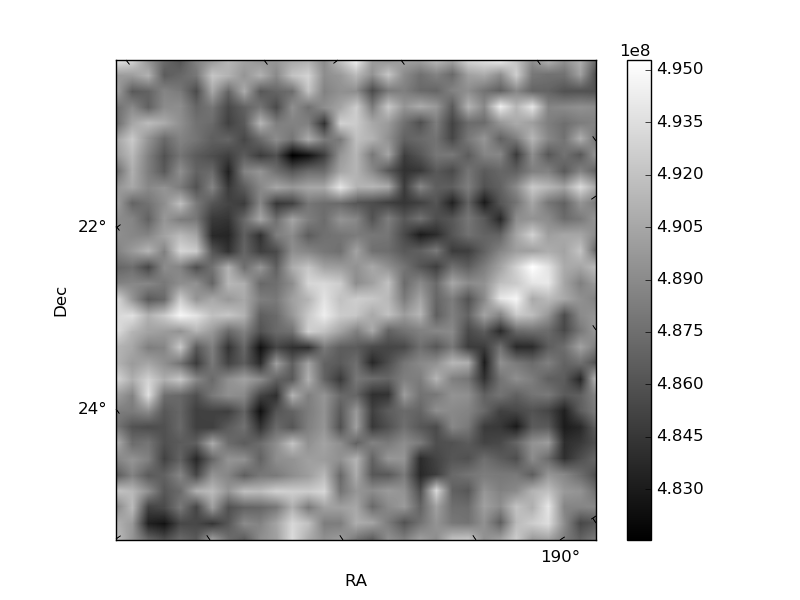
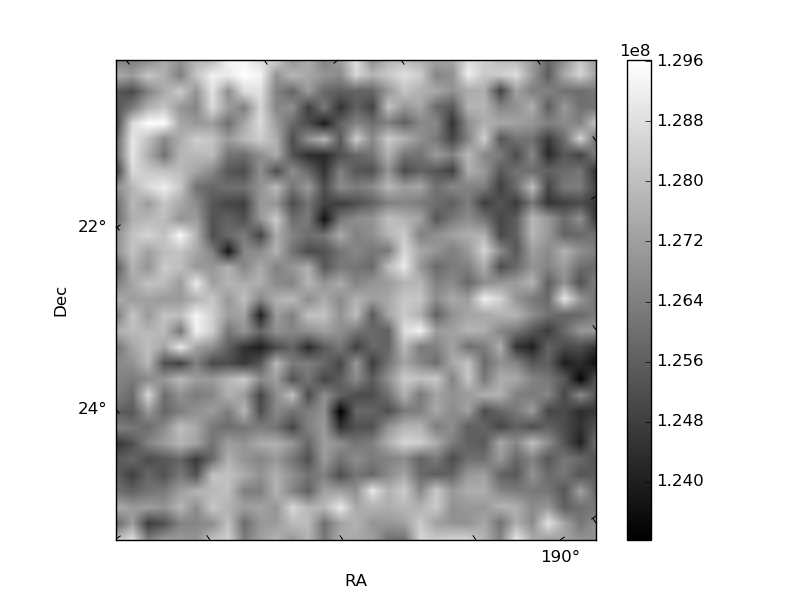
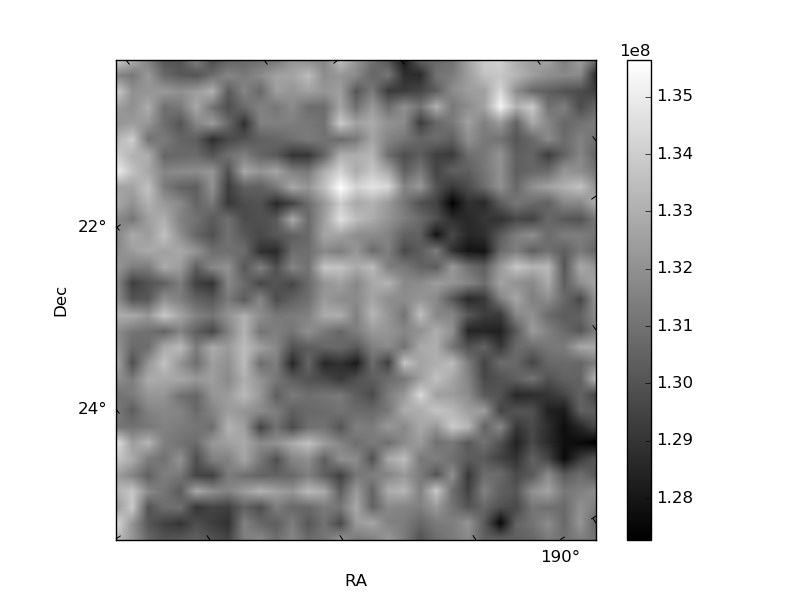
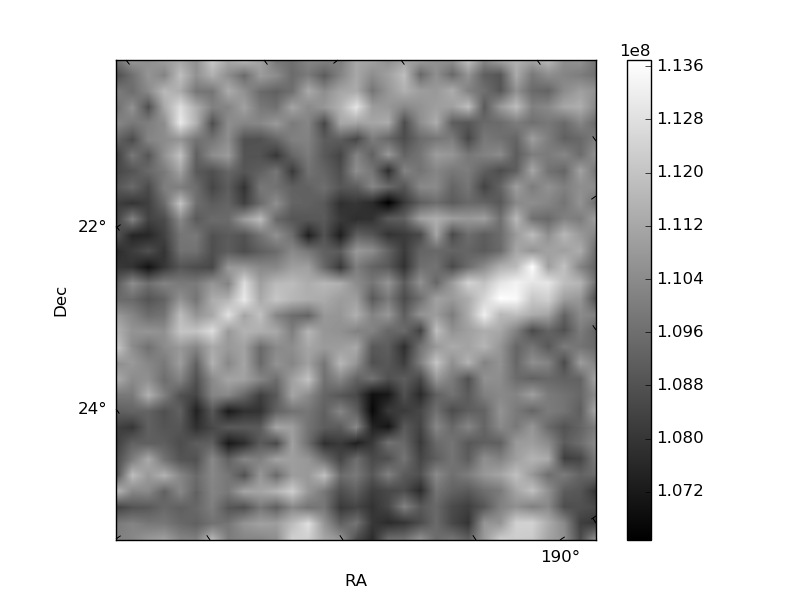
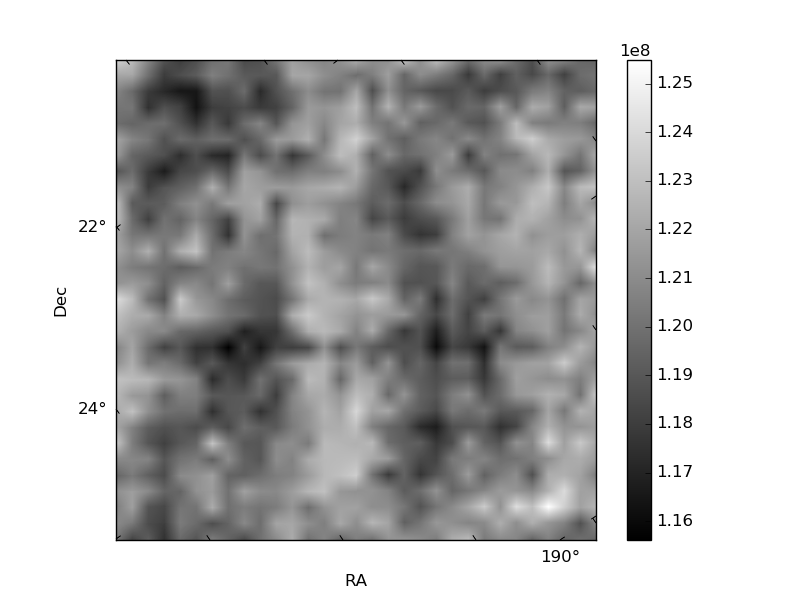
Histogram calculated using DETX and DETY for each event in the final _common_clean file
| Quadrant A | 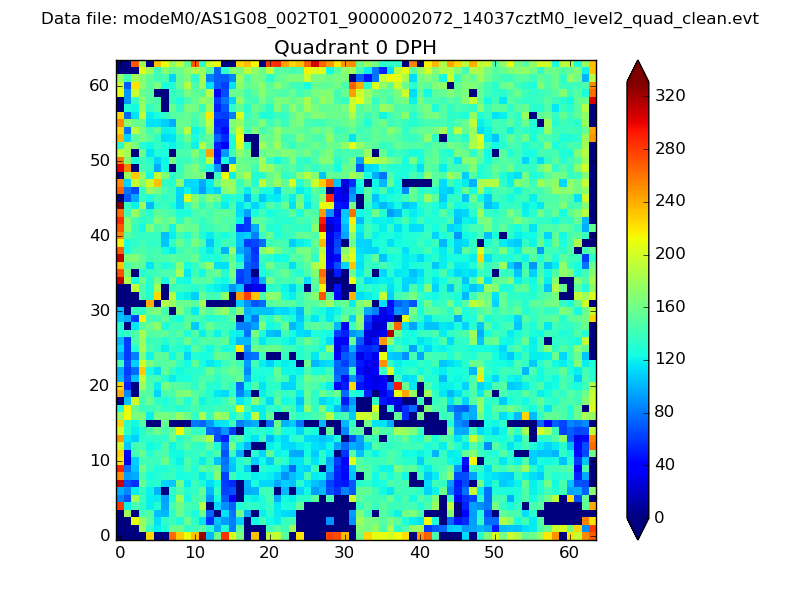 |
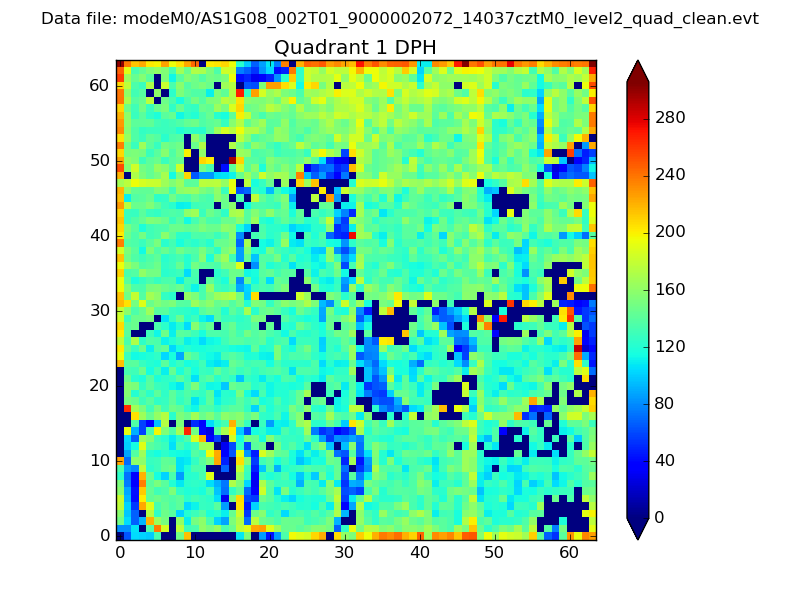 |
Quadrant B |
|---|---|---|---|
| Quadrant D | 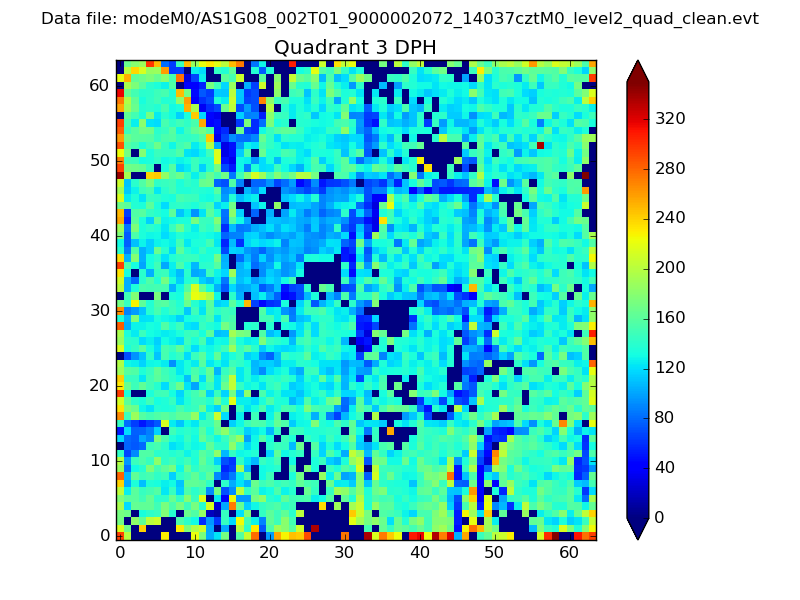 |
 |
Quadrant C |
| Plot type | Count rate plots | Images |
|---|---|---|
| Comparison with Poisson distribution Blue bars denote a histogram of data divided into 1 sec bins. Red curve is a Poisson curve with rate = median count rate of data. |
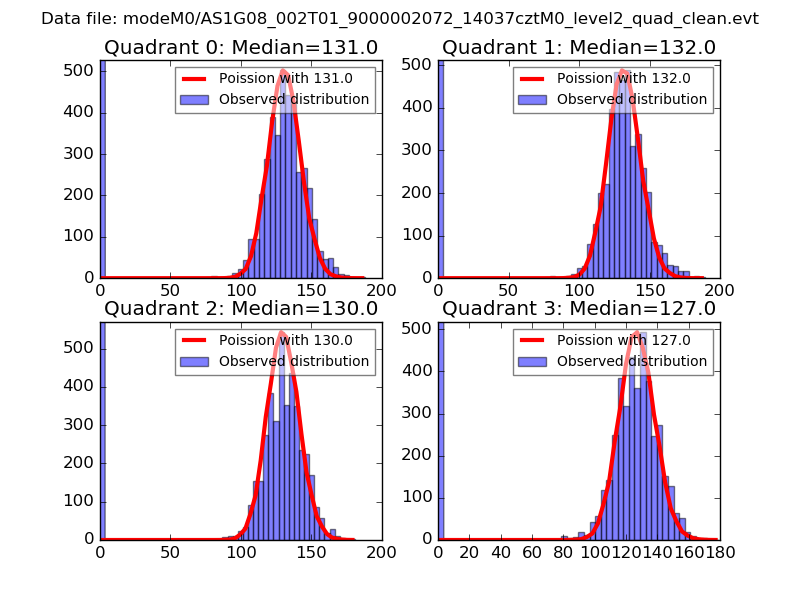 |
 |
| Quadrant-wise count rates Data is divided into 100 sec bins |
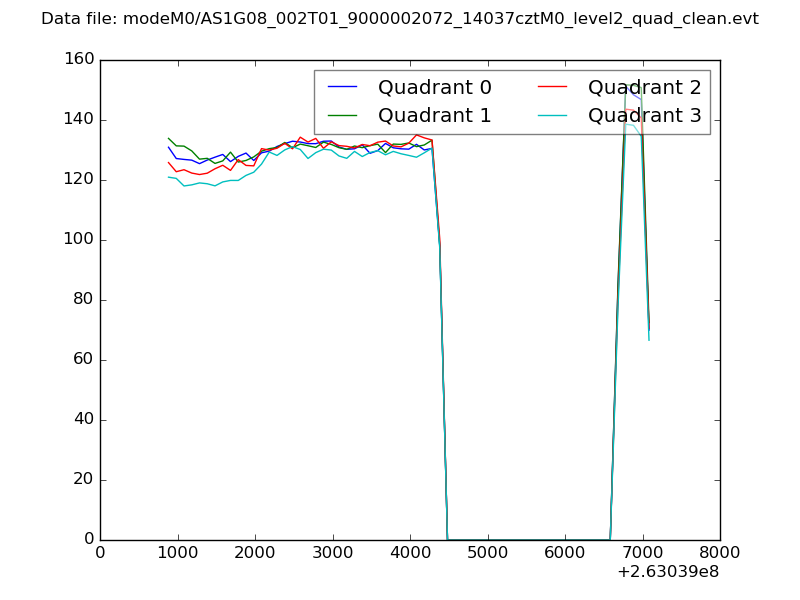 |
|
| Module-wise count rates for Quadrant A Data is divided into 100 sec bins |
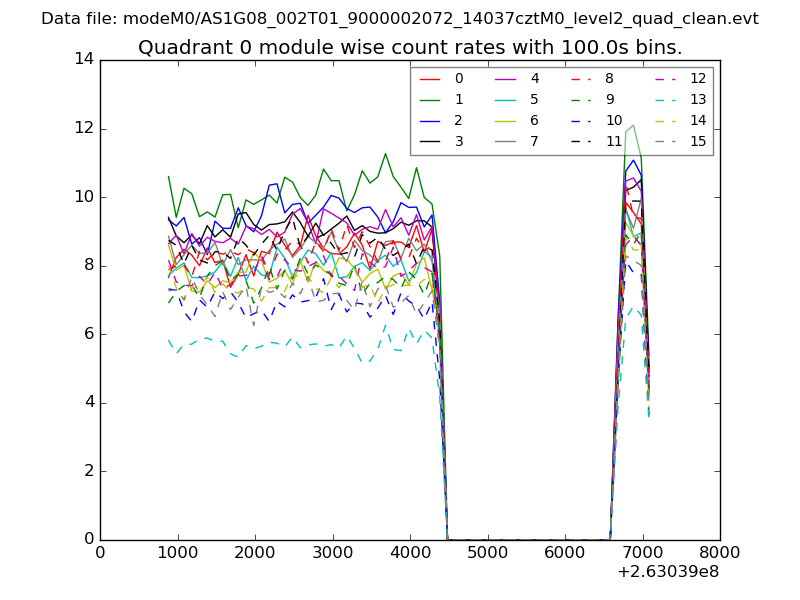 |
 |
| Module-wise count rates for Quadrant B Data is divided into 100 sec bins |
 |
 |
| Module-wise count rates for Quadrant C Data is divided into 100 sec bins |
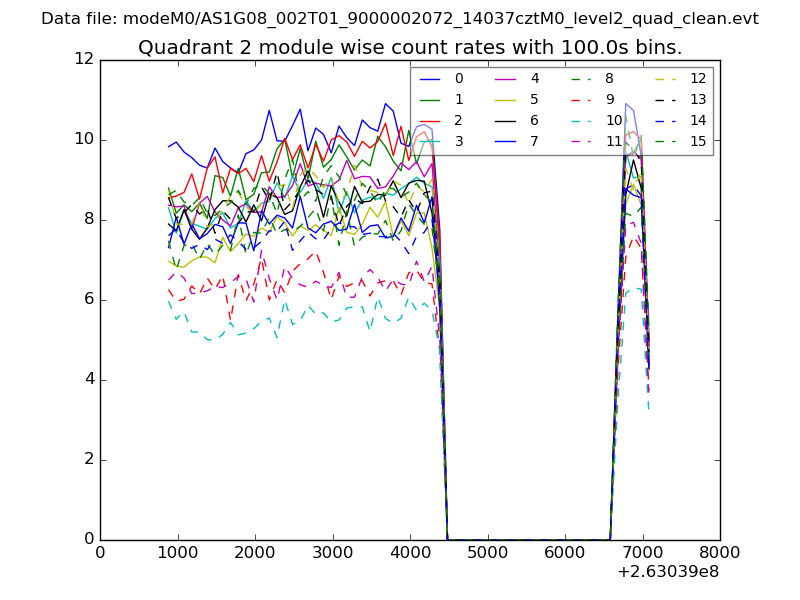 |
 |
| Module-wise count rates for Quadrant D Data is divided into 100 sec bins |
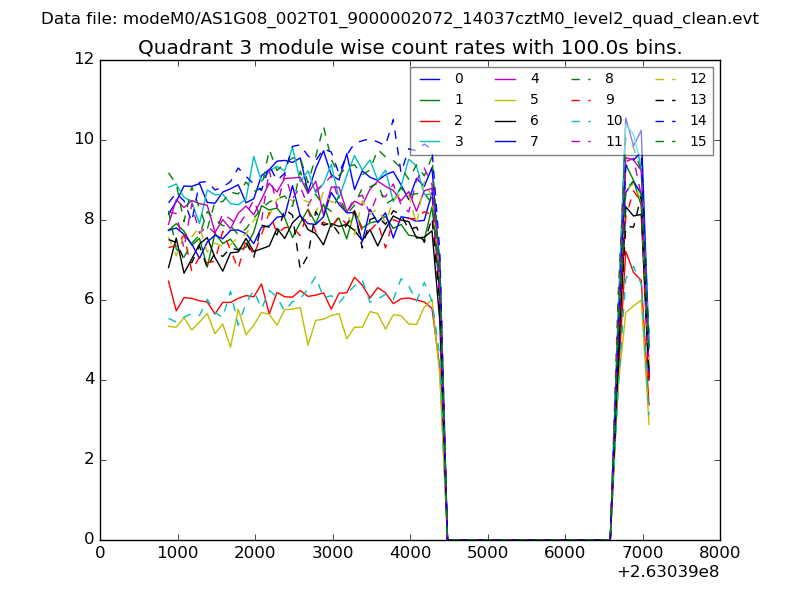 |
 |
| Parameter | Plot |
|---|---|
| CZT HV Monitor | 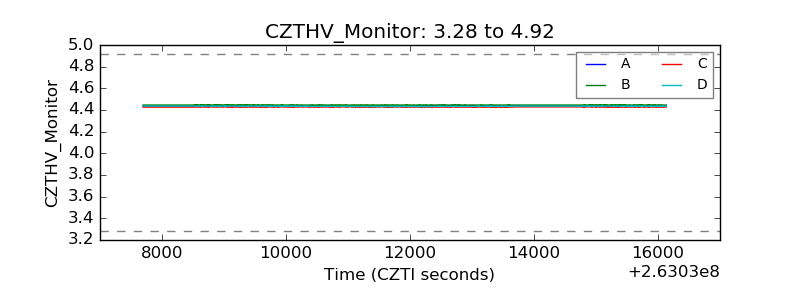 |
| D_VDD | 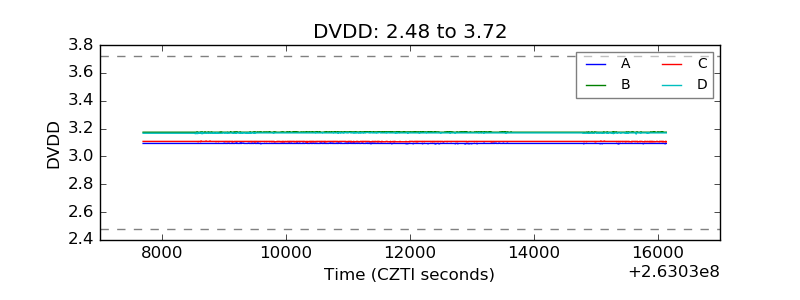 |
| Temperature 1 | 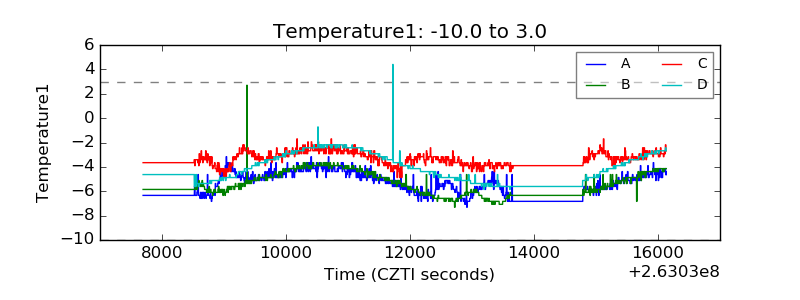 |
| Veto HV Monitor |  |
| Veto LLD | 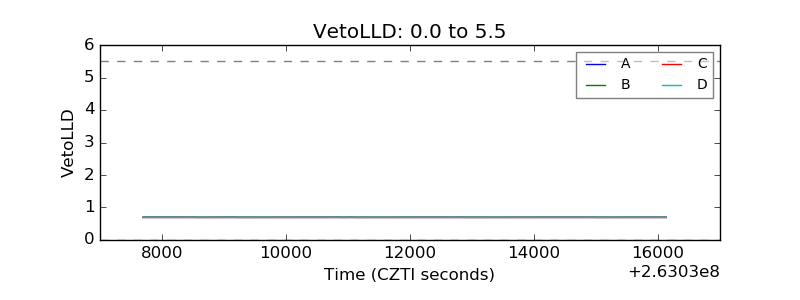 |
| Alpha Counter | 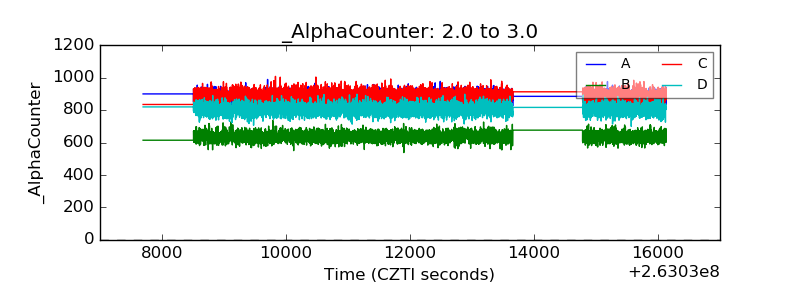 |
| _CPM_Rate |  |
| CZT Counter | 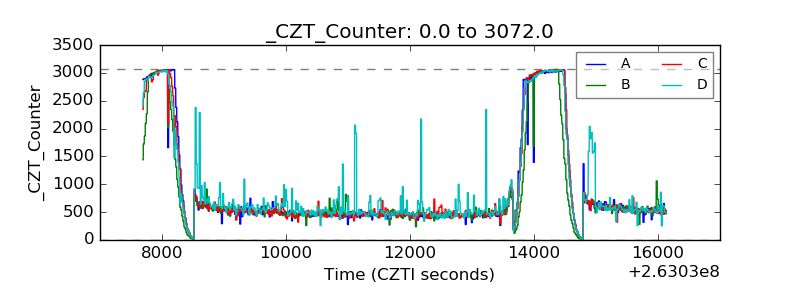 |
| +2.5 Volts monitor |  |
| +5 Volts monitor | 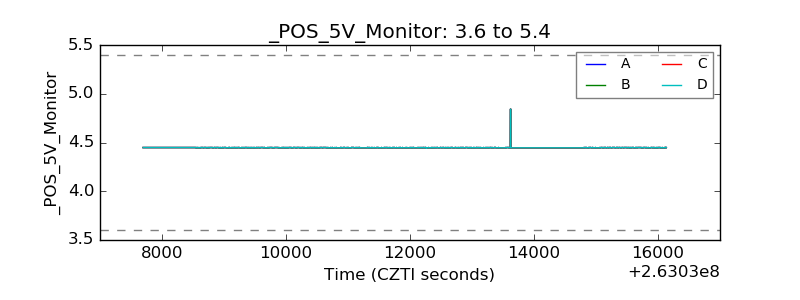 |
| _ROLL_ROT | 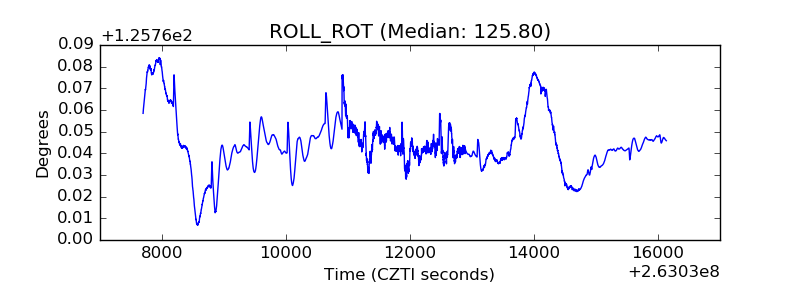 |
| _Roll_DEC | 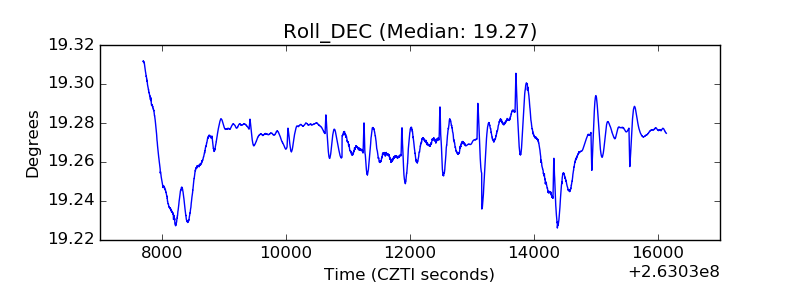 |
| _Roll_RA | 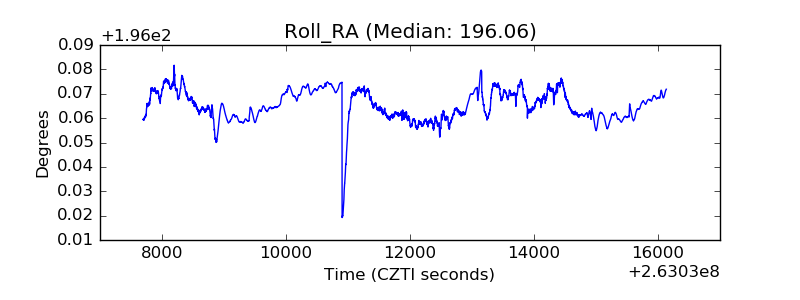 |
| Veto Counter | 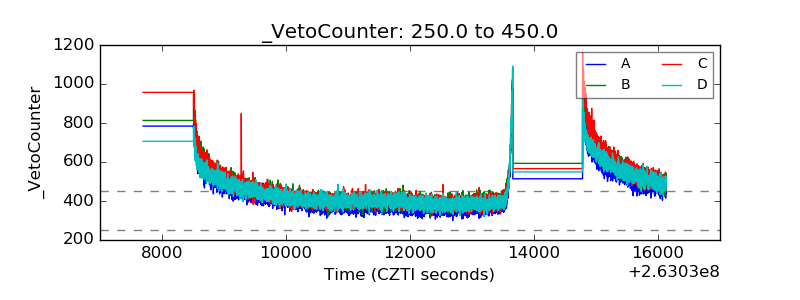 |