| Param | Original file | Final file |
|---|---|---|
| Filename | modeM0/AS1A04_162T01_9000002074_14039cztM0_level2.evt | modeM0/AS1A04_162T01_9000002074_14039cztM0_level2_quad_clean.evt |
| Size (bytes) | 452,453,760 | 123,641,280 |
| Size | 431.5 MB | 117.9 MB |
| Events in quadrant A | 2,861,417 | 862,341 |
| Events in quadrant B | 3,060,037 | 870,357 |
| Events in quadrant C | 2,922,292 | 827,083 |
| Events in quadrant D | 4,466,516 | 781,357 |
| Mode M0 | |||
|---|---|---|---|
| Quadrant | BADHDUFLAG | Total packets | Discarded packets |
| A | 0 | 12204 | 2 |
| B | 0 | 12852 | 1 |
| C | 0 | 12264 | 1 |
| D | 0 | 17186 | 1 |
| Mode M9 | |||
|---|---|---|---|
| Quadrant | BADHDUFLAG | Total packets | Discarded packets |
| A | 0 | 14 | 0 |
| B | 0 | 14 | 0 |
| C | 0 | 14 | 0 |
| D | 0 | 14 | 0 |
| Mode SS | |||
|---|---|---|---|
| Quadrant | BADHDUFLAG | Total packets | Discarded packets |
| A | 0 | 118 | 0 |
| B | 0 | 118 | 0 |
| C | 0 | 118 | 0 |
| D | 0 | 118 | 0 |
| Quadrant | Total seconds | Saturated seconds | Saturation percentage |
|---|---|---|---|
| A | 5774 | 67 | 1.160374% |
| B | 5774 | 67 | 1.160374% |
| C | 5774 | 40 | 0.692761% |
| D | 5774 | 428 | 7.412539% |
Noise dominated data is calculated using 1-second bins in cleaned event files. If a bin has >2000 counts, and if more than 50% of those come from <1% of pixels, then it is considered to be noise-dominated and hence unusable.
| Quadrant | # 1 sec bins | Bins with >0 counts | Bins with >2000 counts | High rate bins dominated by noise | Noise dominated (total time) | Noise dominated (detector-on time) | Marked lightcurve |
|---|---|---|---|---|---|---|---|
| A | 7110 | 5776 | 0 | 0 | 0.00% | 0.00% | 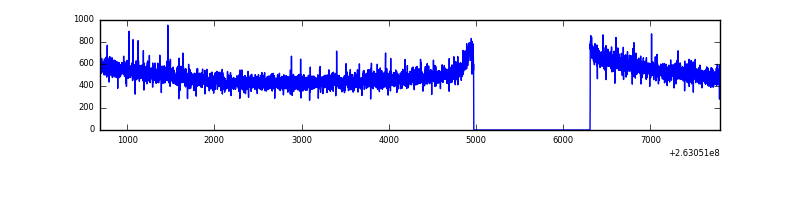 |
| B | 7110 | 5776 | 3 | 3 | 0.04% | 0.05% | 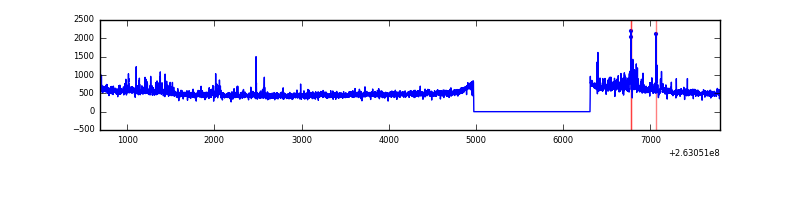 |
| C | 7110 | 5776 | 1 | 1 | 0.01% | 0.02% | 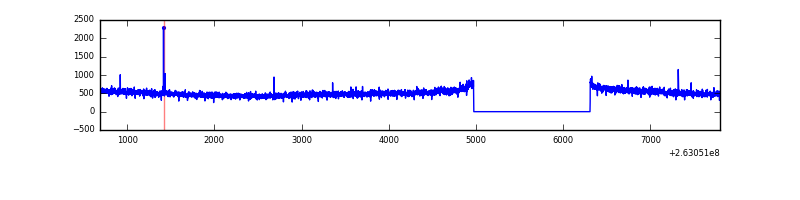 |
| D | 7110 | 5776 | 364 | 364 | 5.12% | 6.30% | 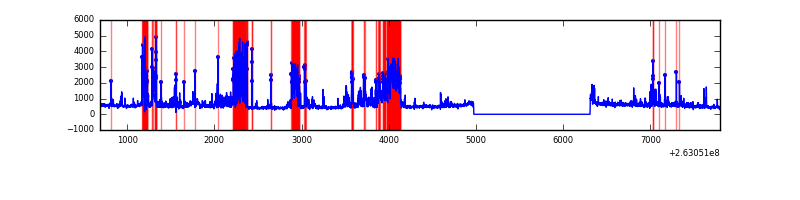 |
Top three noisy pixels from each quadrant. If the there are fewer than three noisy pixels in the level2.evt file, extra rows are filled as -1
| Pixel properties | Quadrant properties | ||||||
|---|---|---|---|---|---|---|---|
| Quadrant | DetID | PixID | Counts | Sigma | Mean | Median | Sigma |
| A | 1 | 162 | 12860 | 80.87 | 739 | 727 | 150.0 |
| A | 0 | 226 | 6638 | 39.4 | 739 | 727 | 150.0 |
| A | 12 | 194 | 5685 | 33.05 | 739 | 727 | 150.0 |
| B | 0 | 189 | 142132 | 1040.08 | 733 | 715 | 136.0 |
| B | 0 | 219 | 33253 | 239.31 | 733 | 715 | 136.0 |
| B | 3 | 209 | 21410 | 152.2 | 733 | 715 | 136.0 |
| C | 3 | 233 | 190790 | 1197.21 | 698 | 702 | 158.8 |
| C | 0 | 207 | 10525 | 61.87 | 698 | 702 | 158.8 |
| C | 13 | 61 | 5354 | 29.3 | 698 | 702 | 158.8 |
| D | 13 | 104 | 703940 | 4313.11 | 683 | 667 | 163.1 |
| D | 1 | 52 | 675579 | 4139.17 | 683 | 667 | 163.1 |
| D | 10 | 157 | 415226 | 2542.45 | 683 | 667 | 163.1 |
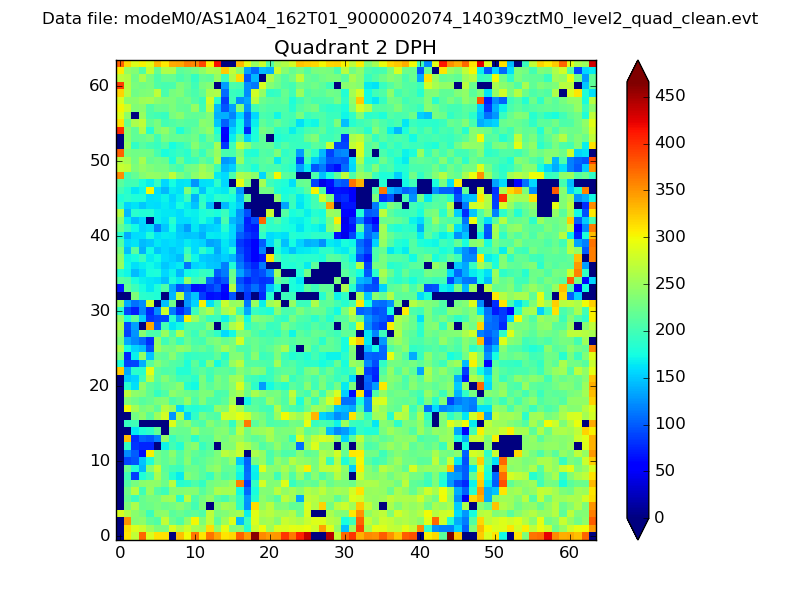
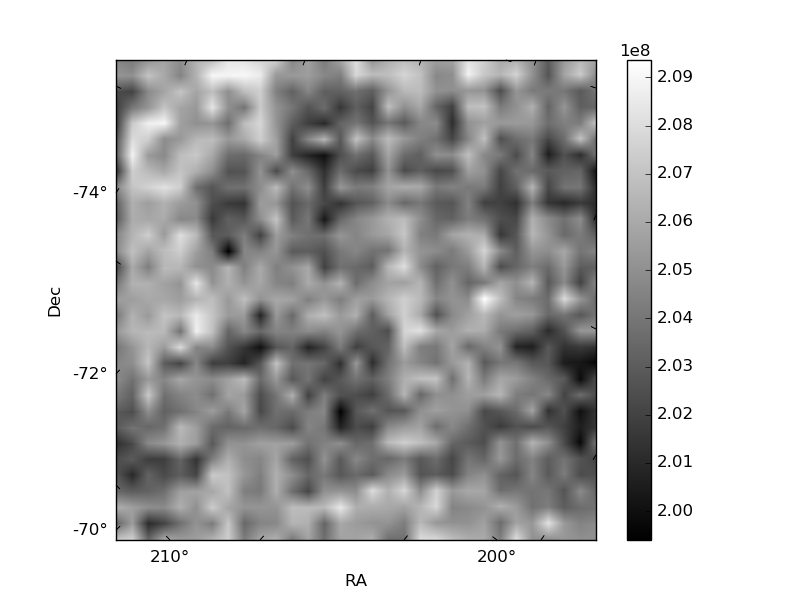
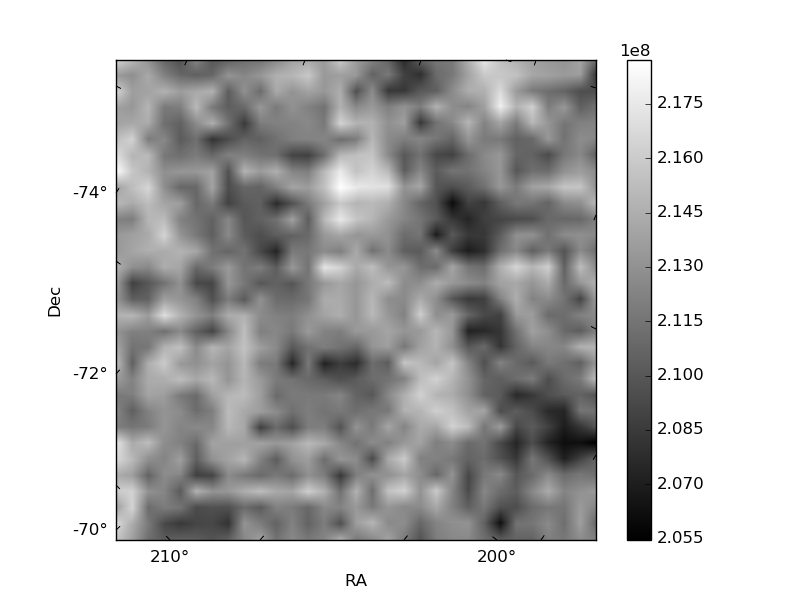
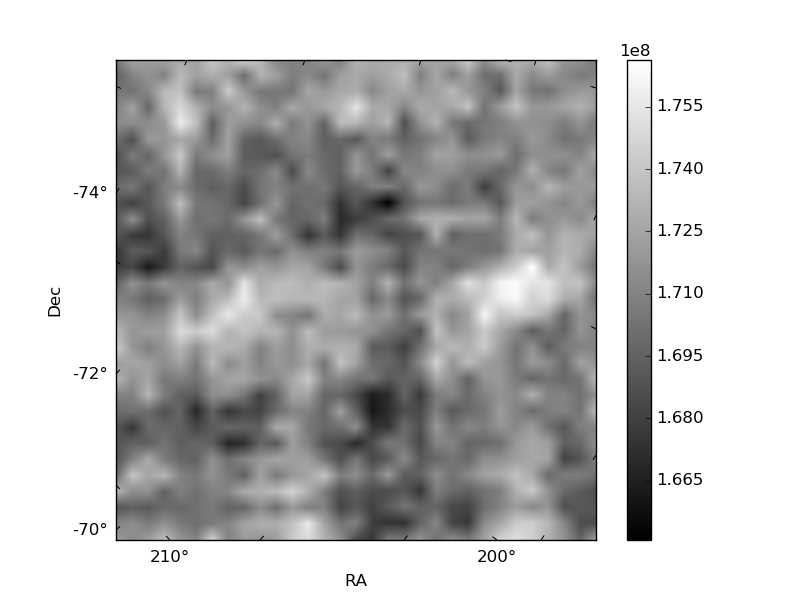
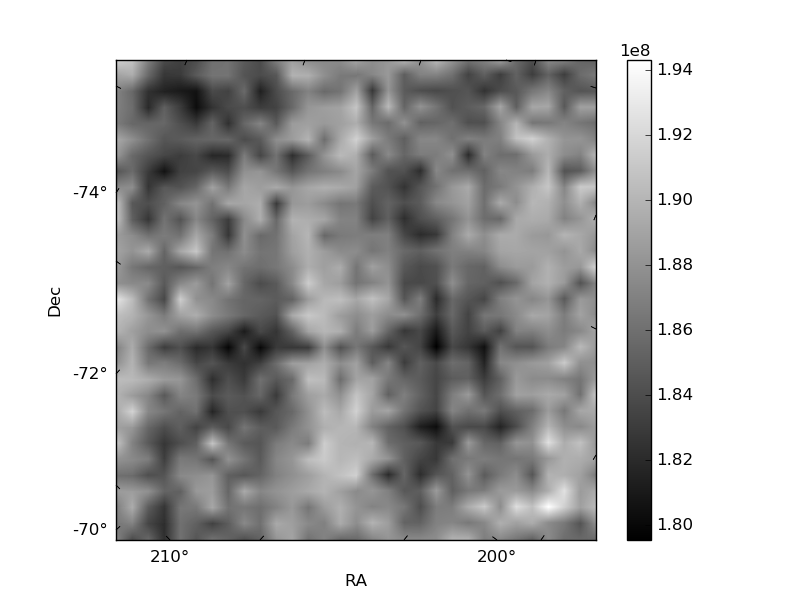
Histogram calculated using DETX and DETY for each event in the final _common_clean file
| Quadrant A | 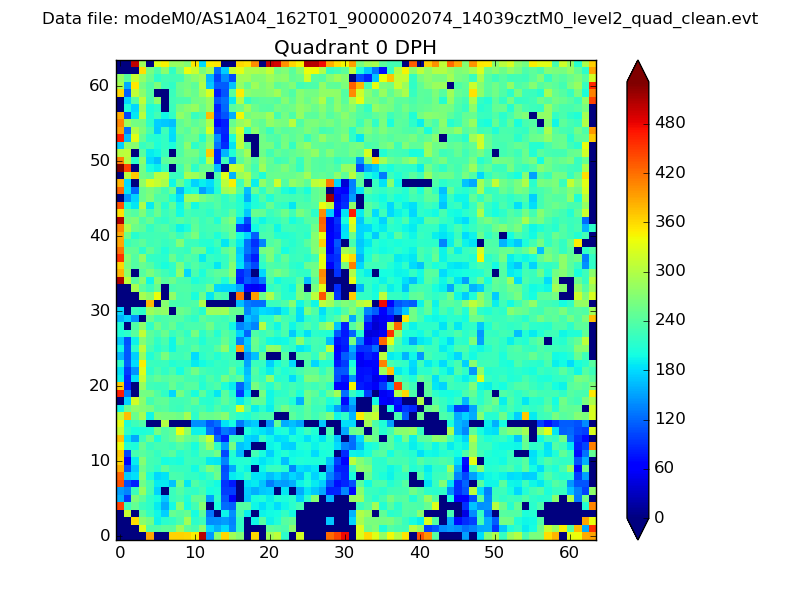 |
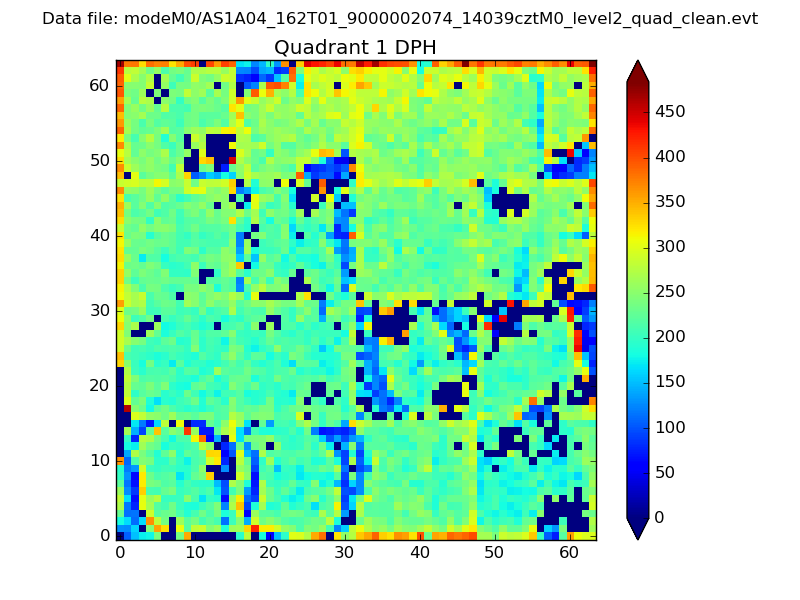 |
Quadrant B |
|---|---|---|---|
| Quadrant D | 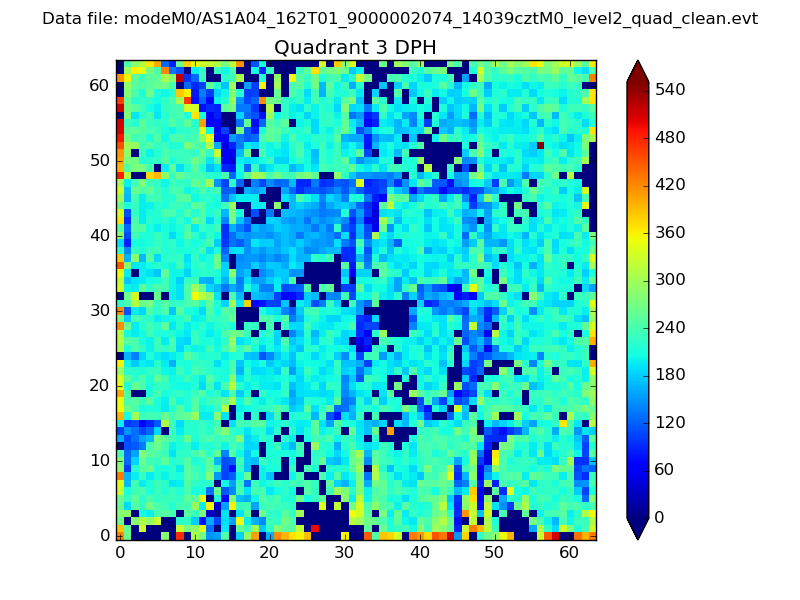 |
 |
Quadrant C |
| Plot type | Count rate plots | Images |
|---|---|---|
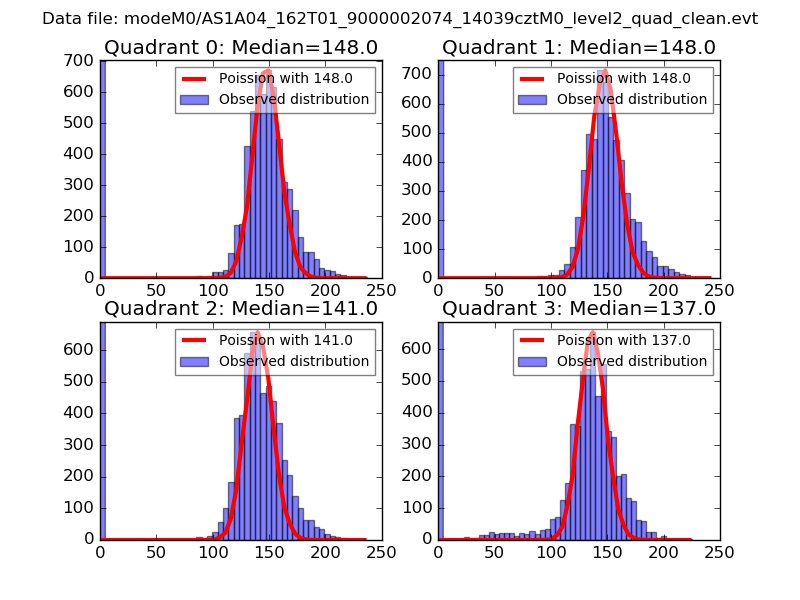
| Comparison with Poisson distribution Blue bars denote a histogram of data divided into 1 sec bins. Red curve is a Poisson curve with rate = median count rate of data. |
 |
 |
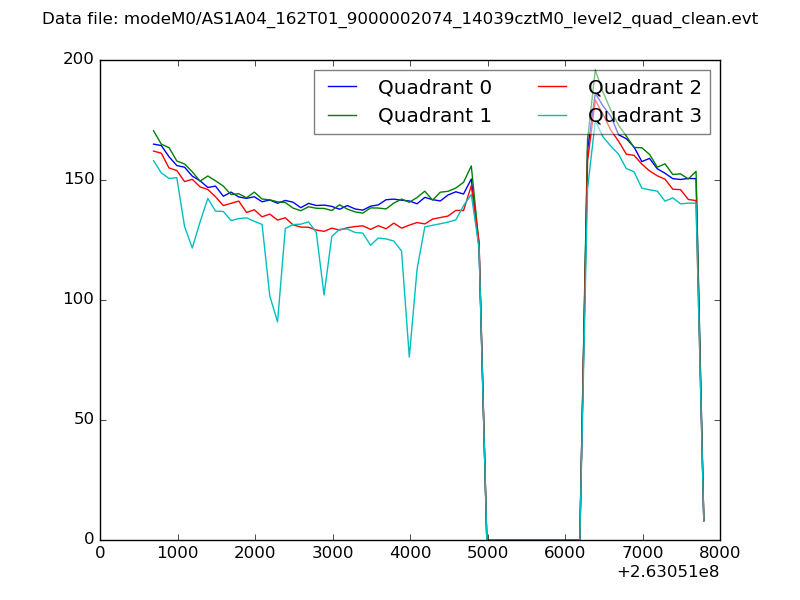
| Quadrant-wise count rates Data is divided into 100 sec bins |
 |
|
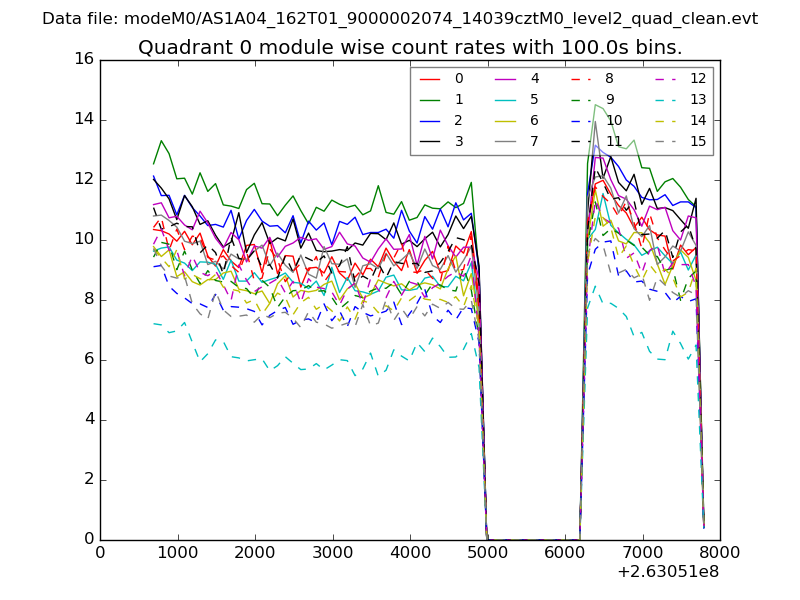
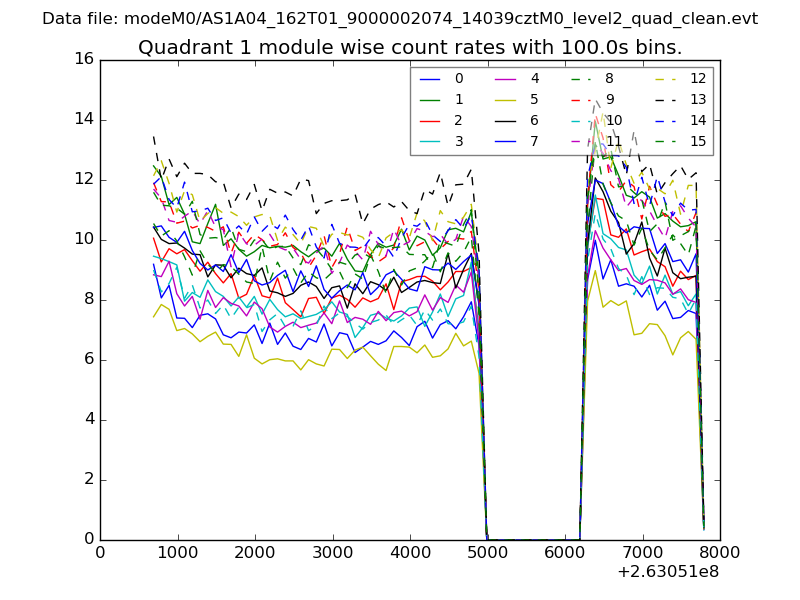
| Module-wise count rates for Quadrant A Data is divided into 100 sec bins |
 |
 |
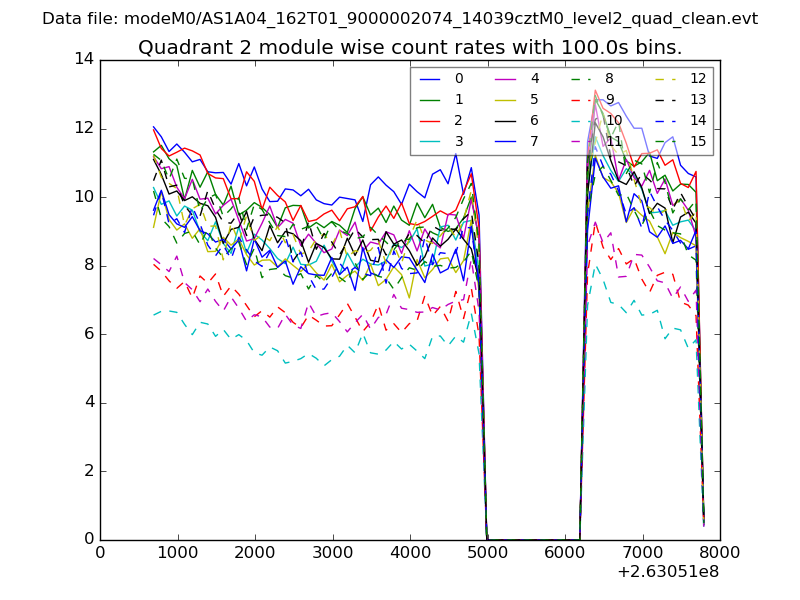
| Module-wise count rates for Quadrant B Data is divided into 100 sec bins |
 |
 |
| Module-wise count rates for Quadrant C Data is divided into 100 sec bins |
 |
 |
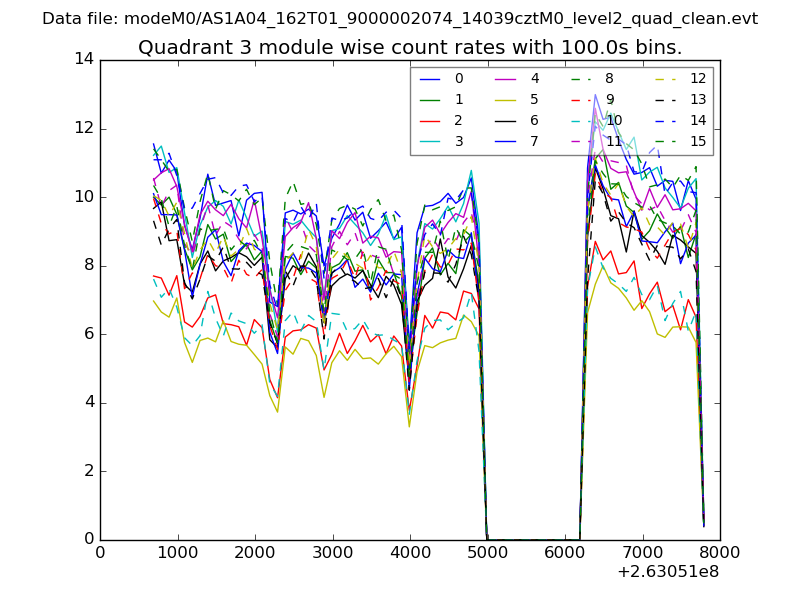
| Module-wise count rates for Quadrant D Data is divided into 100 sec bins |
 |
 |
| Parameter | Plot |
|---|---|
| CZT HV Monitor | 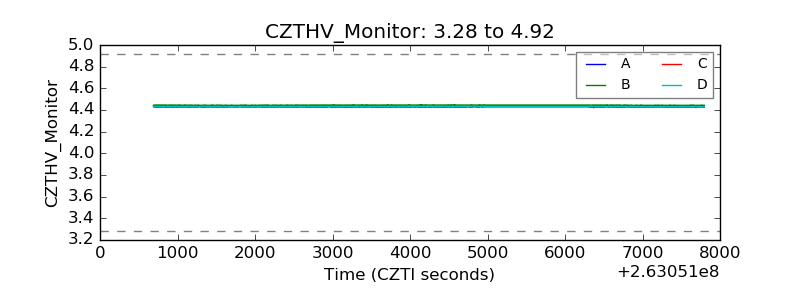 |
| D_VDD | 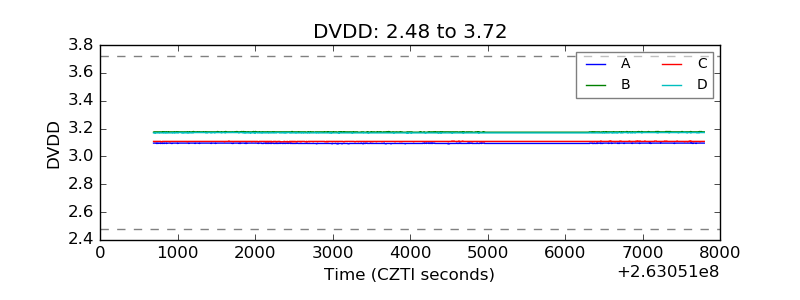 |
| Temperature 1 |  |
| Veto HV Monitor | 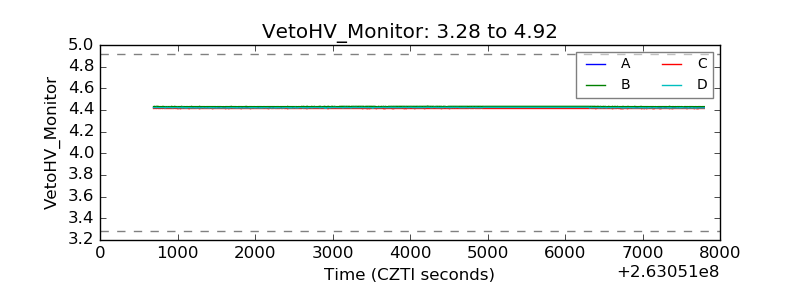 |
| Veto LLD |  |
| Alpha Counter | 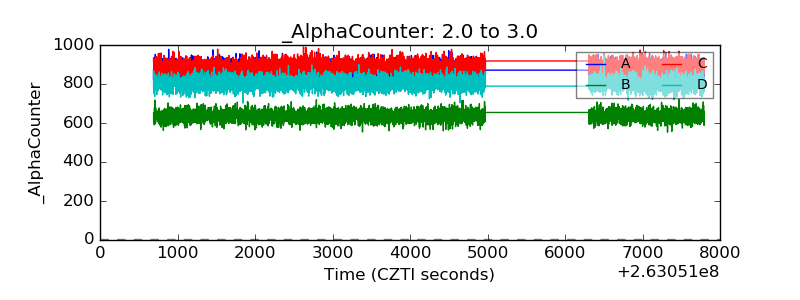 |
| _CPM_Rate | 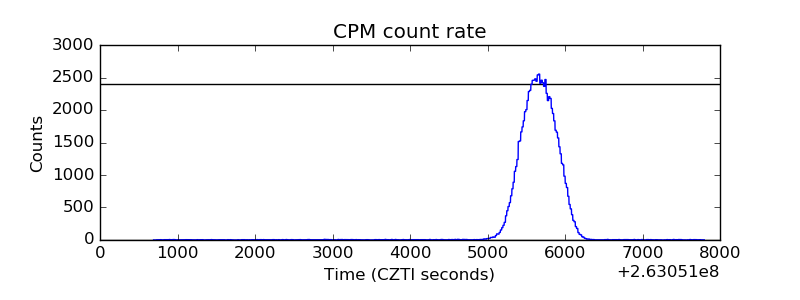 |
| CZT Counter | 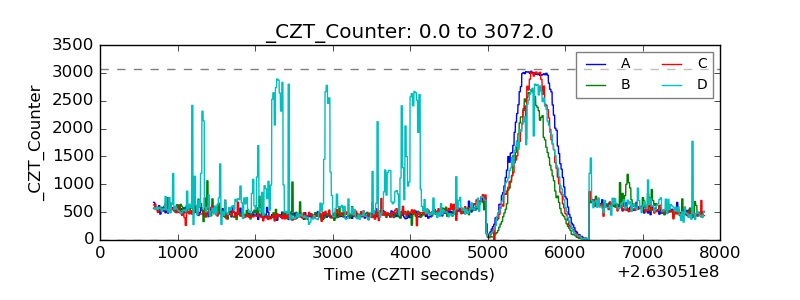 |
| +2.5 Volts monitor |  |
| +5 Volts monitor | 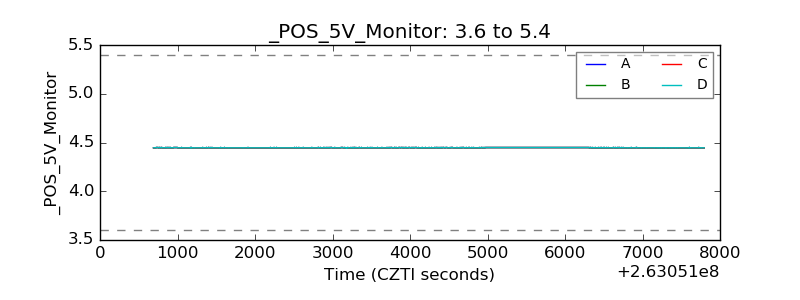 |
| _ROLL_ROT | 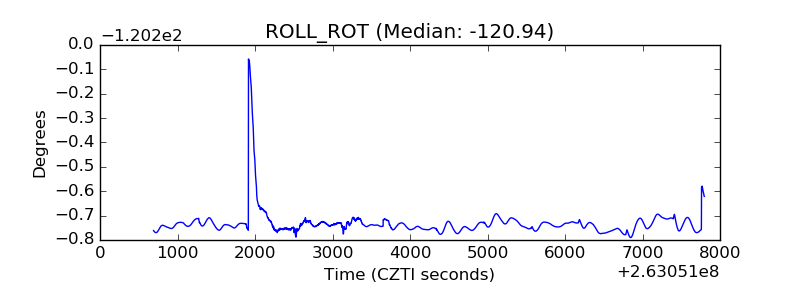 |
| _Roll_DEC | 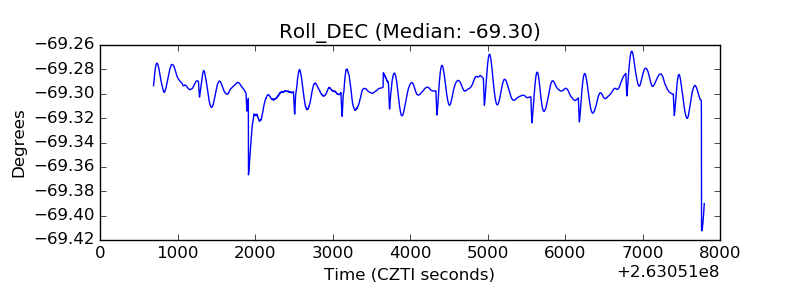 |
| _Roll_RA | 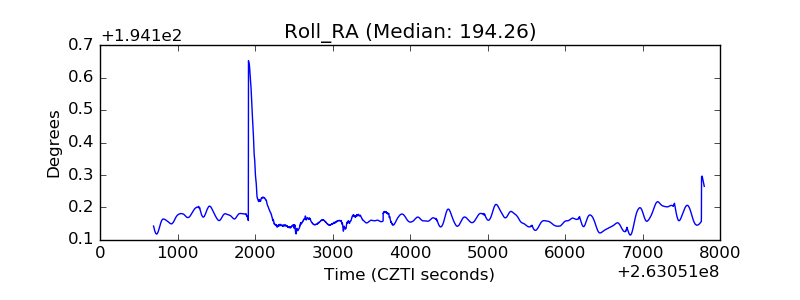 |
| Veto Counter | 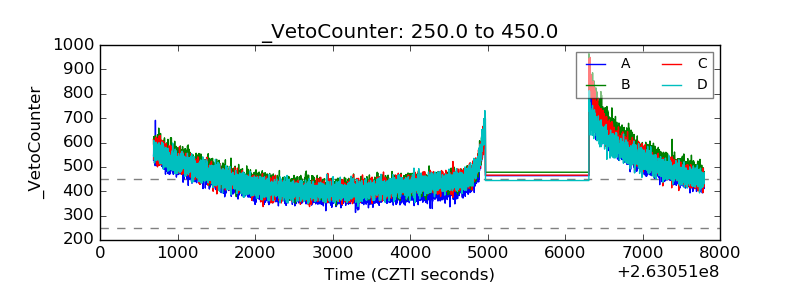 |