| Param | Original file | Final file |
|---|---|---|
| Filename | modeM0/AS1A04_162T01_9000002074_14041cztM0_level2.evt | modeM0/AS1A04_162T01_9000002074_14041cztM0_level2_quad_clean.evt |
| Size (bytes) | 439,202,880 | 125,225,280 |
| Size | 418.9 MB | 119.4 MB |
| Events in quadrant A | 3,082,513 | 862,445 |
| Events in quadrant B | 3,174,889 | 877,361 |
| Events in quadrant C | 3,025,945 | 832,258 |
| Events in quadrant D | 3,601,759 | 793,289 |
| Mode M0 | |||
|---|---|---|---|
| Quadrant | BADHDUFLAG | Total packets | Discarded packets |
| A | 0 | 13080 | 3 |
| B | 0 | 13377 | 2 |
| C | 0 | 12893 | 2 |
| D | 0 | 14978 | 2 |
| Mode M9 | |||
|---|---|---|---|
| Quadrant | BADHDUFLAG | Total packets | Discarded packets |
| A | 0 | 13 | 0 |
| B | 0 | 13 | 0 |
| C | 0 | 13 | 0 |
| D | 0 | 13 | 0 |
| Mode SS | |||
|---|---|---|---|
| Quadrant | BADHDUFLAG | Total packets | Discarded packets |
| A | 0 | 124 | 0 |
| B | 0 | 124 | 0 |
| C | 0 | 124 | 0 |
| D | 0 | 124 | 0 |
| Quadrant | Total seconds | Saturated seconds | Saturation percentage |
|---|---|---|---|
| A | 6124 | 30 | 0.489876% |
| B | 6124 | 61 | 0.996081% |
| C | 6124 | 10 | 0.163292% |
| D | 6125 | 228 | 3.722449% |
Noise dominated data is calculated using 1-second bins in cleaned event files. If a bin has >2000 counts, and if more than 50% of those come from <1% of pixels, then it is considered to be noise-dominated and hence unusable.
| Quadrant | # 1 sec bins | Bins with >0 counts | Bins with >2000 counts | High rate bins dominated by noise | Noise dominated (total time) | Noise dominated (detector-on time) | Marked lightcurve |
|---|---|---|---|---|---|---|---|
| A | 7400 | 6126 | 1 | 1 | 0.01% | 0.02% | 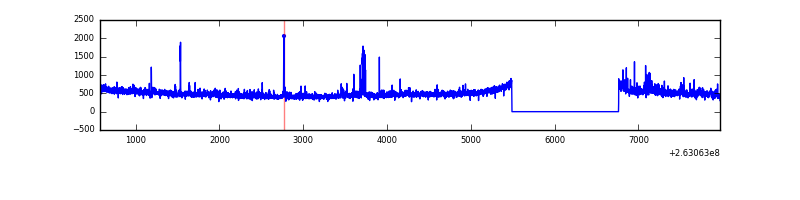 |
| B | 7400 | 6126 | 7 | 7 | 0.09% | 0.11% | 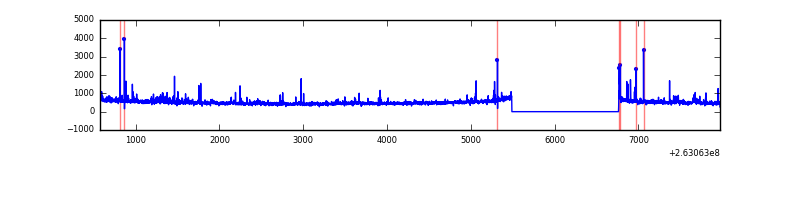 |
| C | 7400 | 6126 | 0 | 0 | 0.00% | 0.00% | 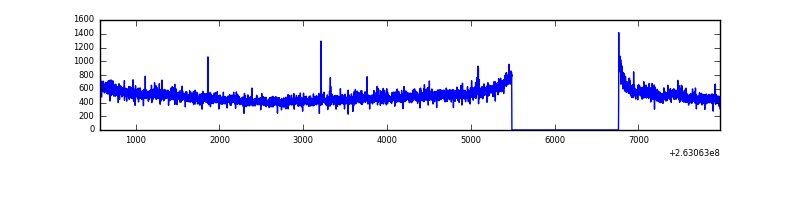 |
| D | 7401 | 6127 | 194 | 194 | 2.62% | 3.17% | 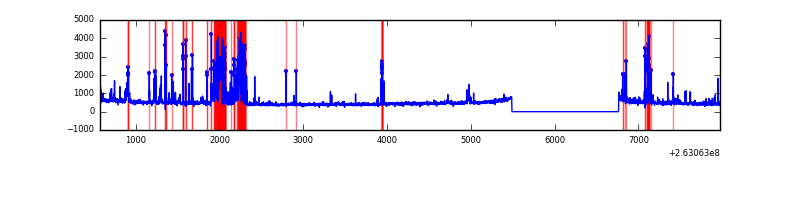 |
Top three noisy pixels from each quadrant. If the there are fewer than three noisy pixels in the level2.evt file, extra rows are filled as -1
| Pixel properties | Quadrant properties | ||||||
|---|---|---|---|---|---|---|---|
| Quadrant | DetID | PixID | Counts | Sigma | Mean | Median | Sigma |
| A | 15 | 222 | 66968 | 435.16 | 753 | 741 | 152.2 |
| A | 12 | 189 | 62756 | 407.49 | 753 | 741 | 152.2 |
| A | 1 | 162 | 26252 | 167.63 | 753 | 741 | 152.2 |
| B | 0 | 189 | 72491 | 512.65 | 756 | 740 | 140.0 |
| B | 10 | 245 | 52156 | 367.36 | 756 | 740 | 140.0 |
| B | 0 | 229 | 24257 | 168.03 | 756 | 740 | 140.0 |
| C | 3 | 233 | 223516 | 1362.56 | 717 | 720 | 163.5 |
| C | 13 | 61 | 5405 | 28.65 | 717 | 720 | 163.5 |
| C | 12 | 4 | 4242 | 21.54 | 717 | 720 | 163.5 |
| D | 15 | 0 | 464722 | 2508.69 | 700 | 684 | 185.0 |
| D | 1 | 52 | 135734 | 730.11 | 700 | 684 | 185.0 |
| D | 13 | 104 | 106720 | 573.25 | 700 | 684 | 185.0 |
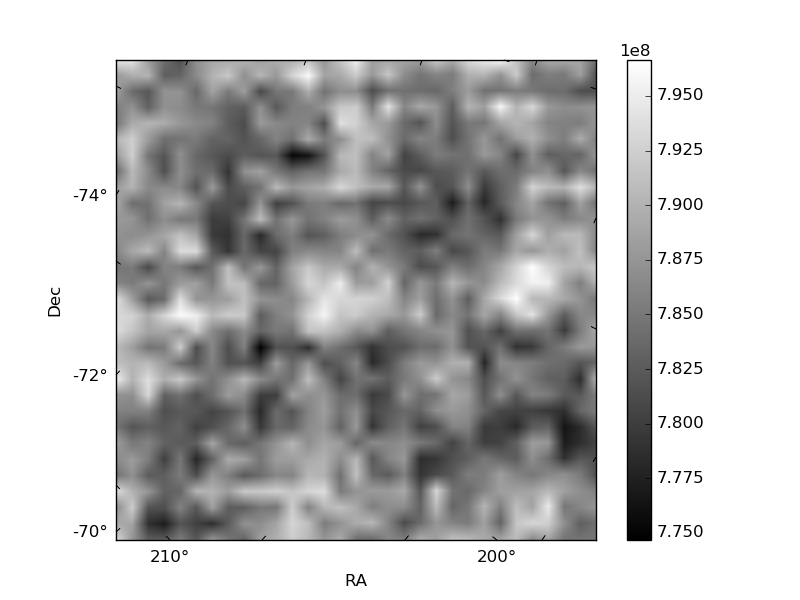
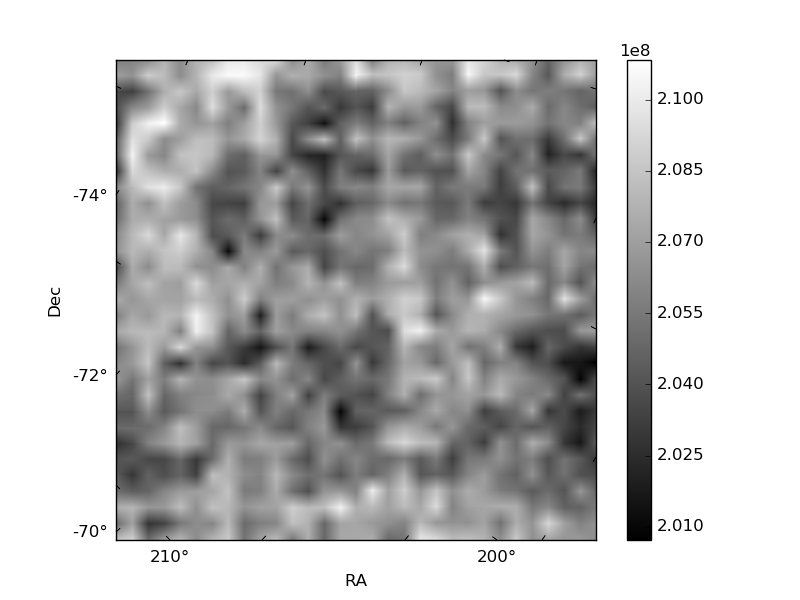
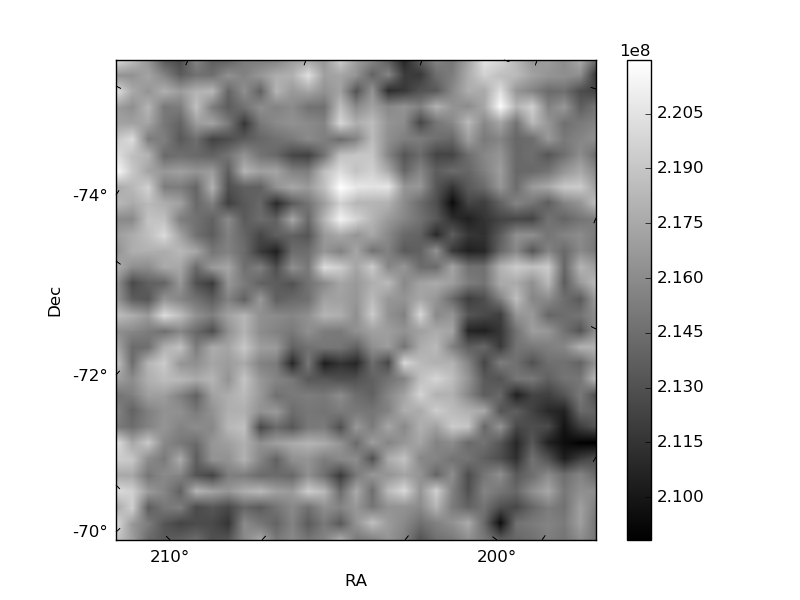
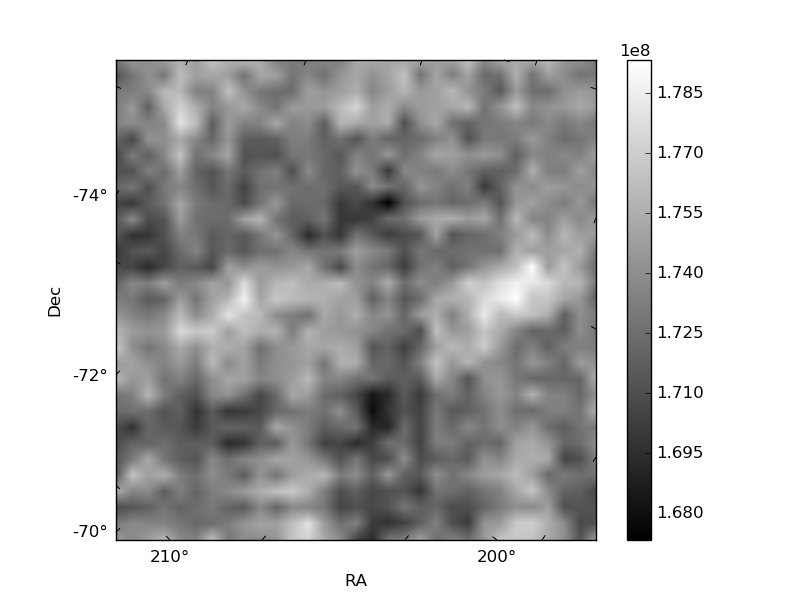
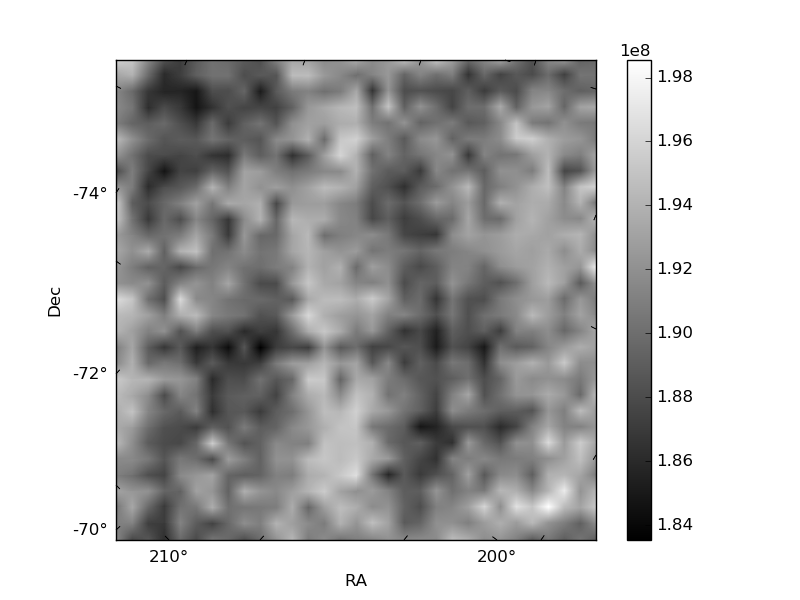
Histogram calculated using DETX and DETY for each event in the final _common_clean file
| Quadrant A | 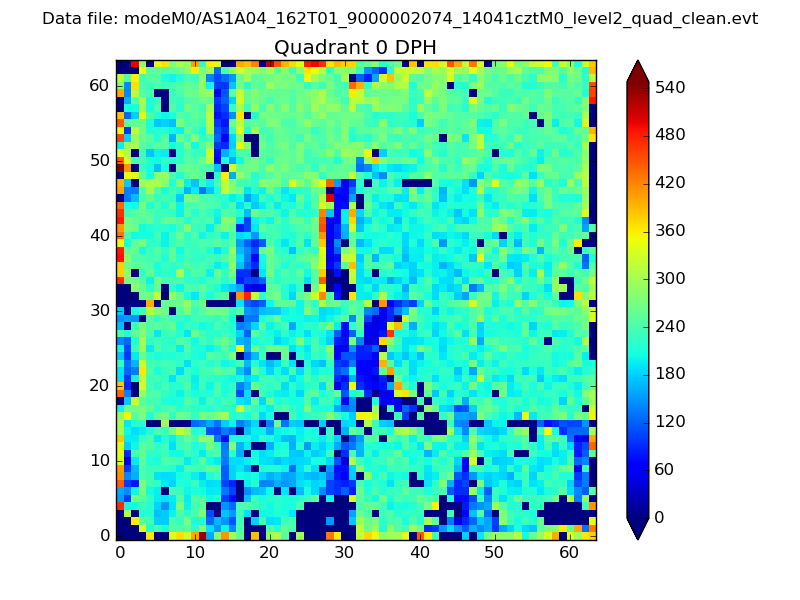 |
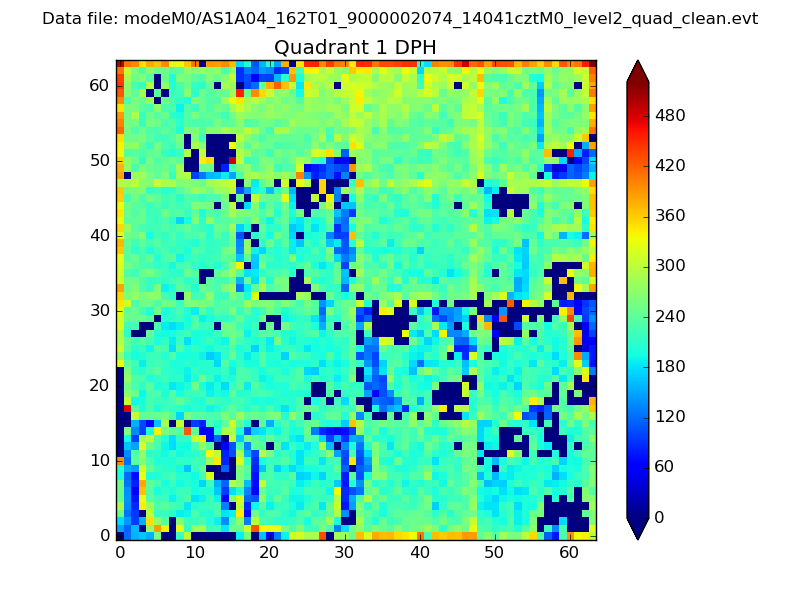 |
Quadrant B |
|---|---|---|---|
| Quadrant D | 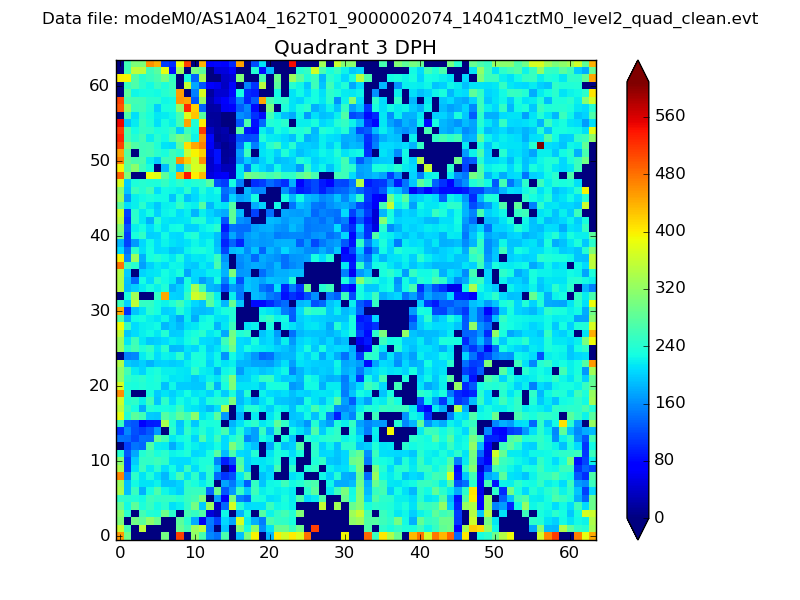 |
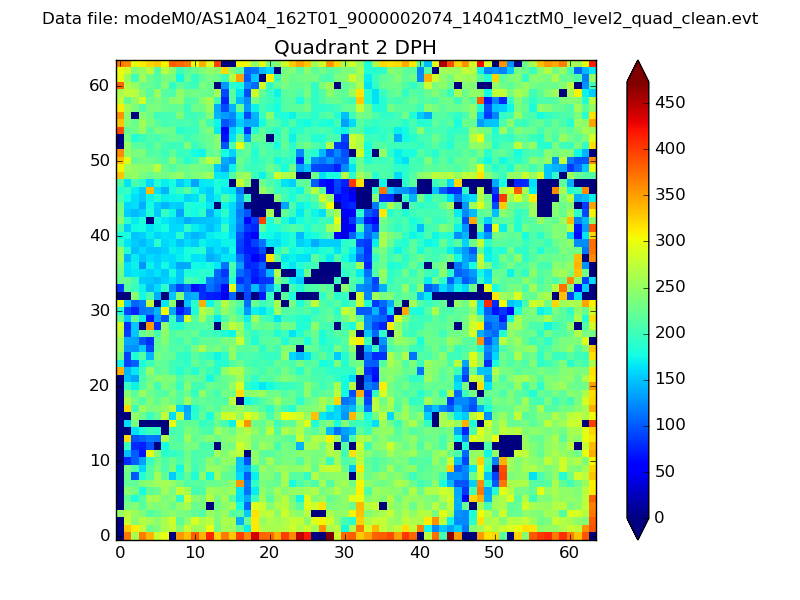 |
Quadrant C |
| Plot type | Count rate plots | Images |
|---|---|---|
| Comparison with Poisson distribution Blue bars denote a histogram of data divided into 1 sec bins. Red curve is a Poisson curve with rate = median count rate of data. |
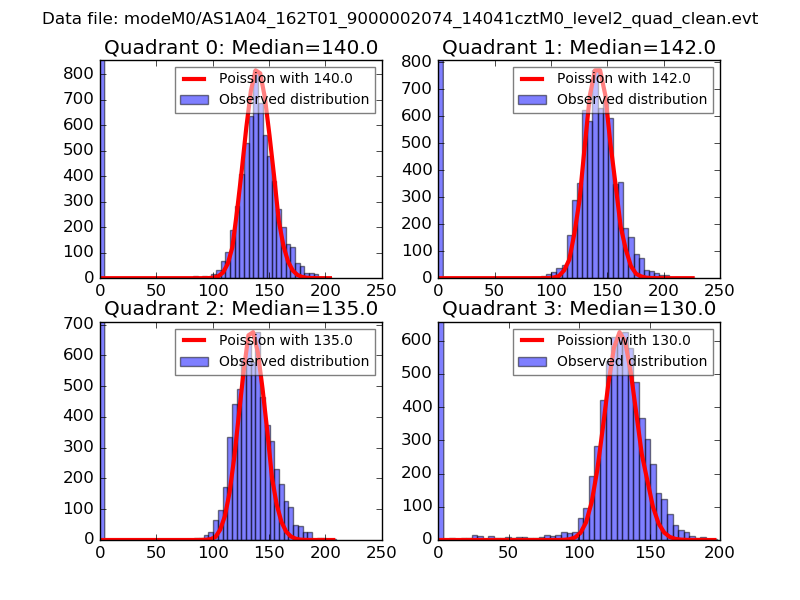 |
 |
| Quadrant-wise count rates Data is divided into 100 sec bins |
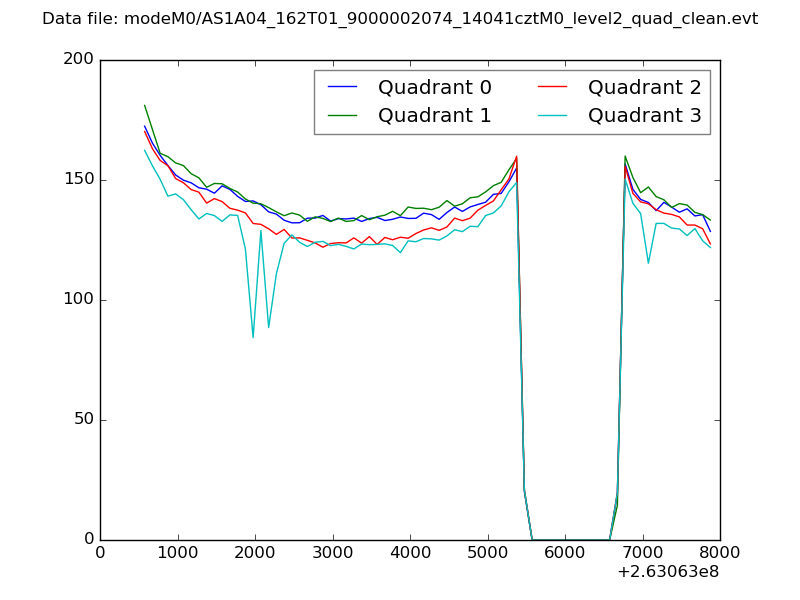 |
|
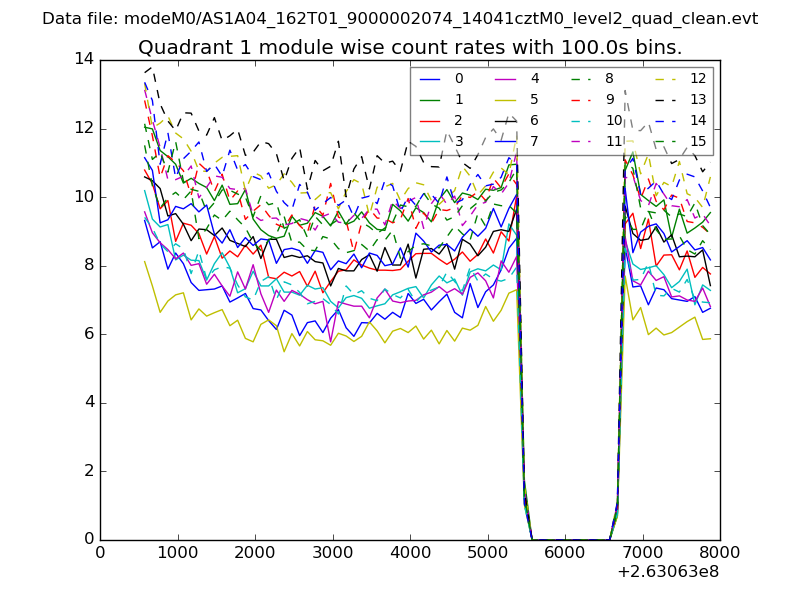
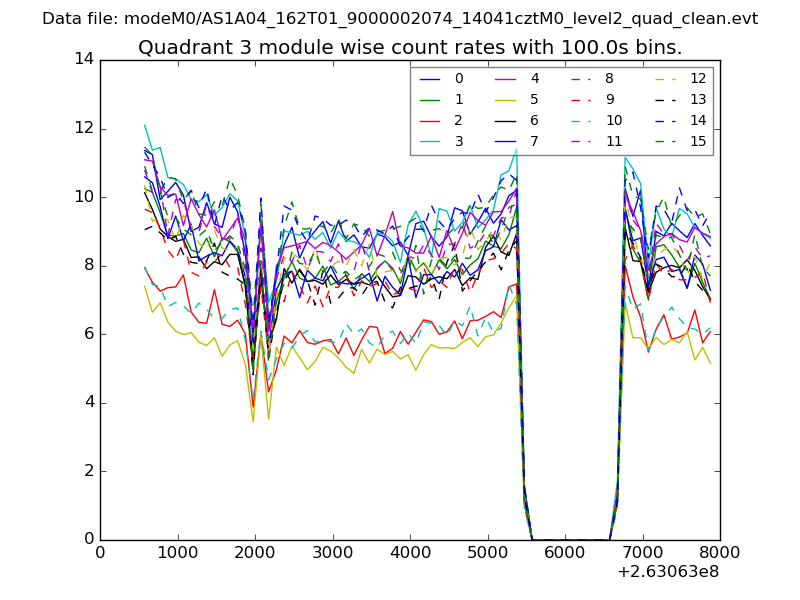
| Module-wise count rates for Quadrant A Data is divided into 100 sec bins |
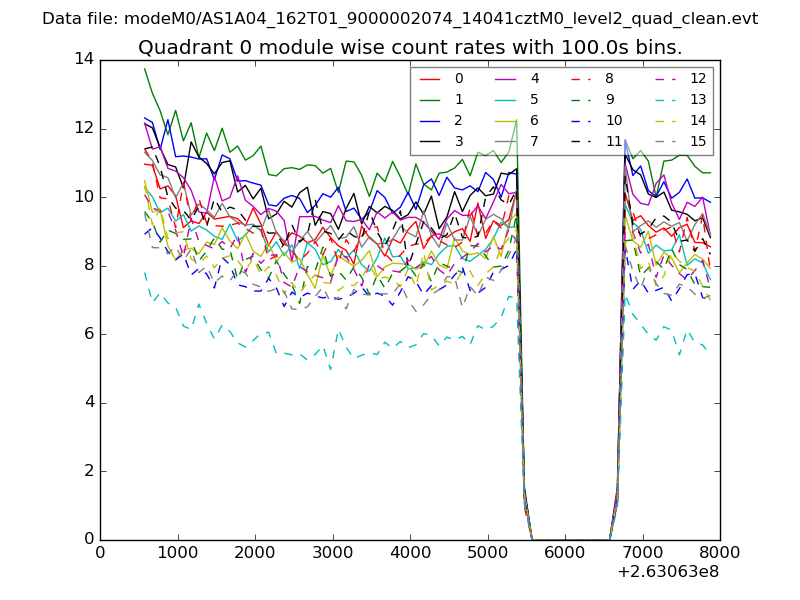 |
 |
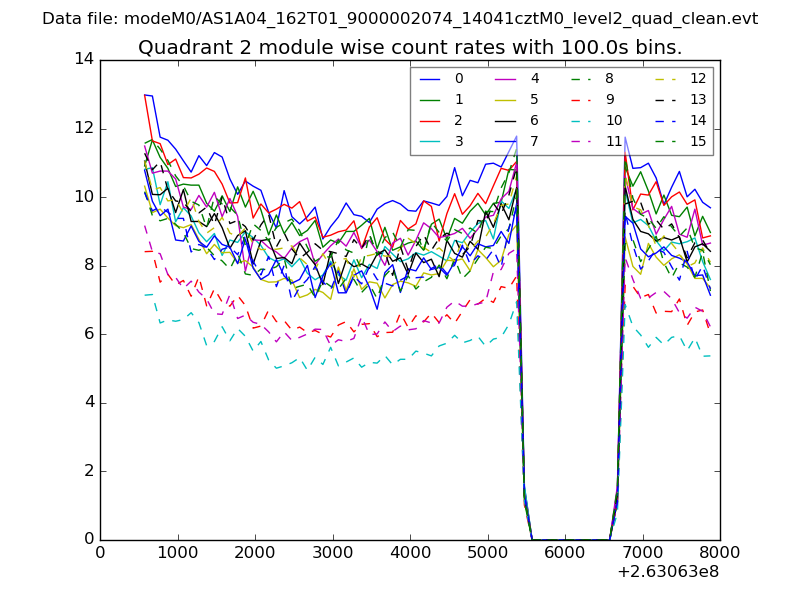
| Module-wise count rates for Quadrant B Data is divided into 100 sec bins |
 |
 |
| Module-wise count rates for Quadrant C Data is divided into 100 sec bins |
 |
 |
| Module-wise count rates for Quadrant D Data is divided into 100 sec bins |
 |
 |
| Parameter | Plot |
|---|---|
| CZT HV Monitor | 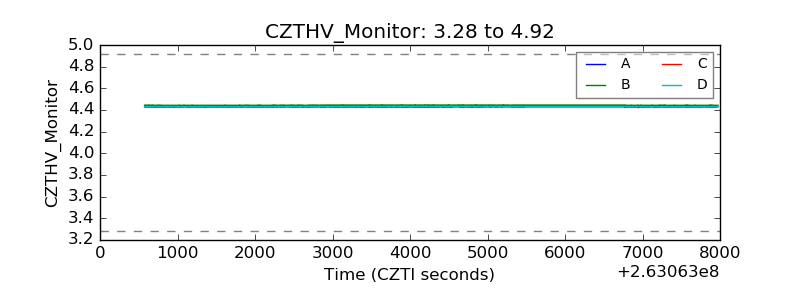 |
| D_VDD | 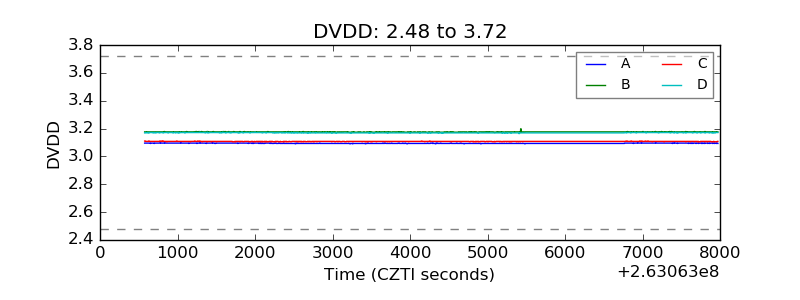 |
| Temperature 1 | 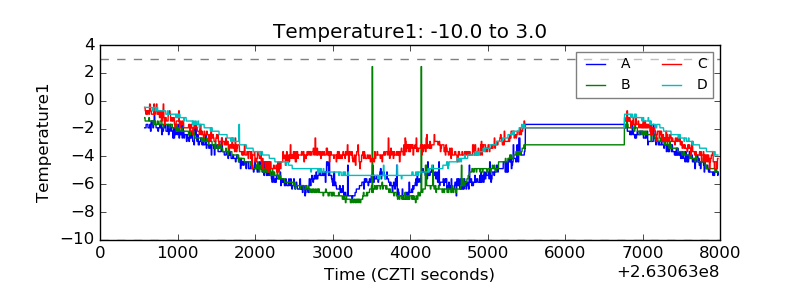 |
| Veto HV Monitor | 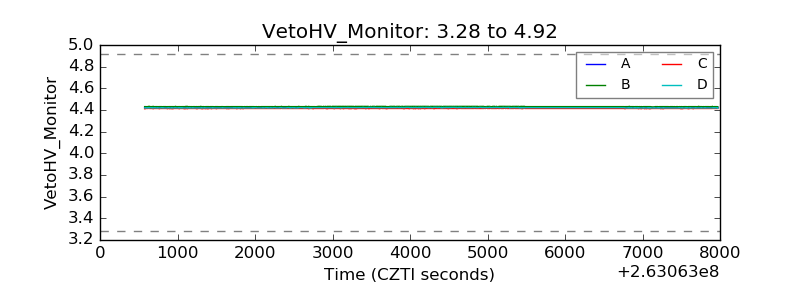 |
| Veto LLD | 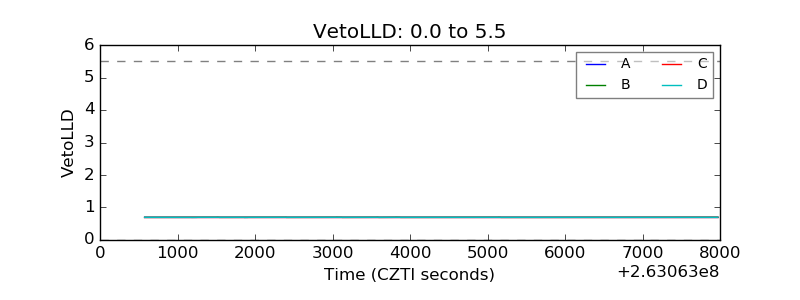 |
| Alpha Counter | 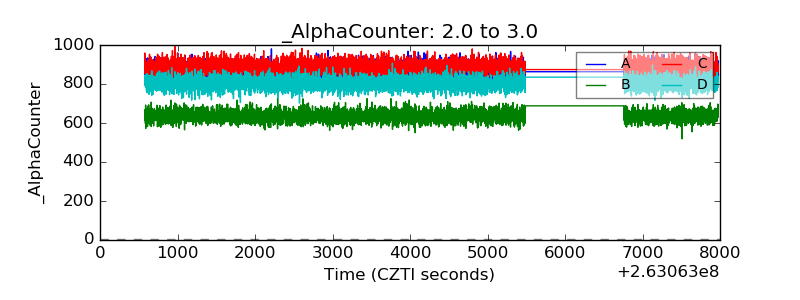 |
| _CPM_Rate | 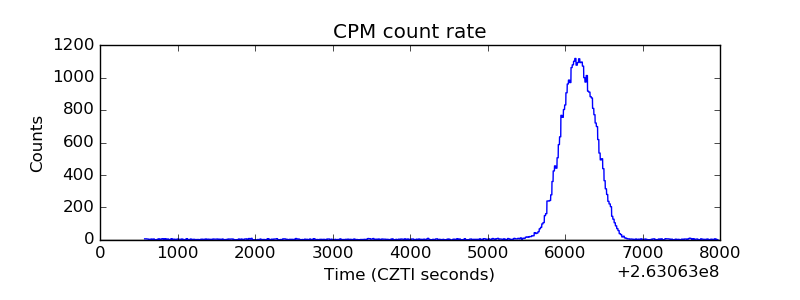 |
| CZT Counter | 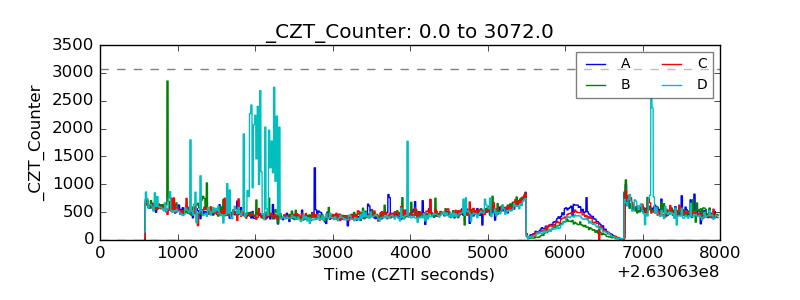 |
| +2.5 Volts monitor |  |
| +5 Volts monitor | 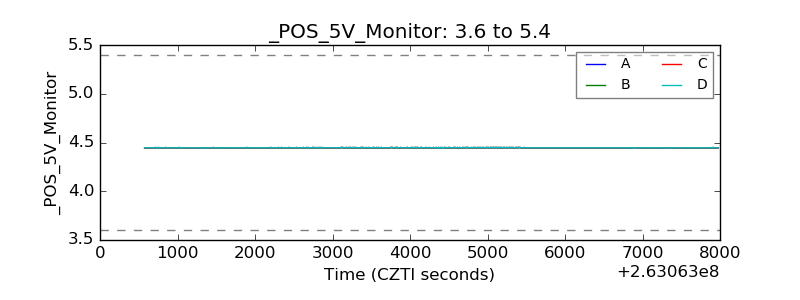 |
| _ROLL_ROT | 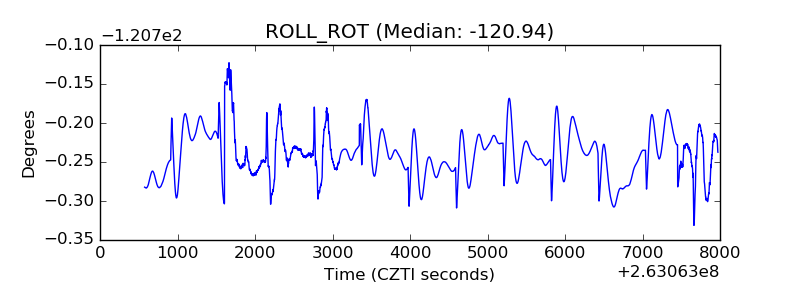 |
| _Roll_DEC | 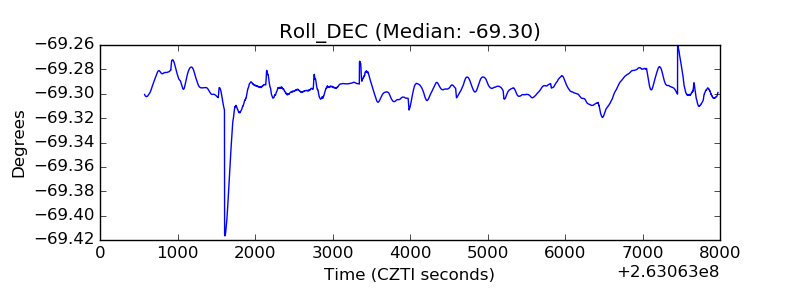 |
| _Roll_RA | 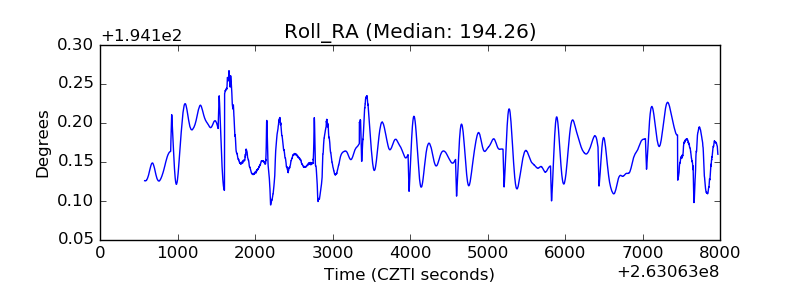 |
| Veto Counter | 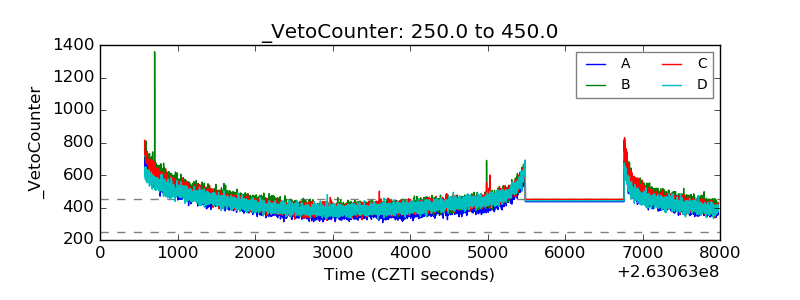 |