| Param | Original file | Final file |
|---|---|---|
| Filename | modeM0/AS1A04_162T01_9000002074_14044cztM0_level2.evt | modeM0/AS1A04_162T01_9000002074_14044cztM0_level2_quad_clean.evt |
| Size (bytes) | 566,161,920 | 140,411,520 |
| Size | 539.9 MB | 133.9 MB |
| Events in quadrant A | 3,724,827 | 953,377 |
| Events in quadrant B | 4,397,253 | 959,601 |
| Events in quadrant C | 3,757,302 | 922,821 |
| Events in quadrant D | 4,747,397 | 884,330 |
| Mode M0 | |||
|---|---|---|---|
| Quadrant | BADHDUFLAG | Total packets | Discarded packets |
| A | 0 | 16314 | 3 |
| B | 0 | 18305 | 2 |
| C | 0 | 16264 | 2 |
| D | 0 | 19124 | 2 |
| Mode M9 | |||
|---|---|---|---|
| Quadrant | BADHDUFLAG | Total packets | Discarded packets |
| A | 0 | 9 | 0 |
| B | 0 | 9 | 0 |
| C | 0 | 9 | 0 |
| D | 0 | 9 | 0 |
| Mode SS | |||
|---|---|---|---|
| Quadrant | BADHDUFLAG | Total packets | Discarded packets |
| A | 0 | 154 | 0 |
| B | 0 | 154 | 0 |
| C | 0 | 154 | 0 |
| D | 0 | 154 | 0 |
| Quadrant | Total seconds | Saturated seconds | Saturation percentage |
|---|---|---|---|
| A | 7663 | 54 | 0.704685% |
| B | 7663 | 214 | 2.792640% |
| C | 7663 | 81 | 1.057027% |
| D | 7663 | 197 | 2.570795% |
Noise dominated data is calculated using 1-second bins in cleaned event files. If a bin has >2000 counts, and if more than 50% of those come from <1% of pixels, then it is considered to be noise-dominated and hence unusable.
| Quadrant | # 1 sec bins | Bins with >0 counts | Bins with >2000 counts | High rate bins dominated by noise | Noise dominated (total time) | Noise dominated (detector-on time) | Marked lightcurve |
|---|---|---|---|---|---|---|---|
| A | 8559 | 7666 | 4 | 4 | 0.05% | 0.05% | 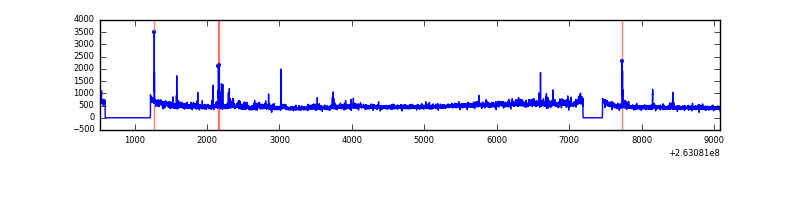 |
| B | 8559 | 7666 | 64 | 64 | 0.75% | 0.83% | 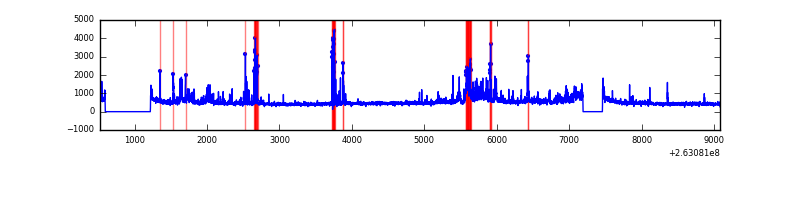 |
| C | 8559 | 7666 | 33 | 33 | 0.39% | 0.43% | 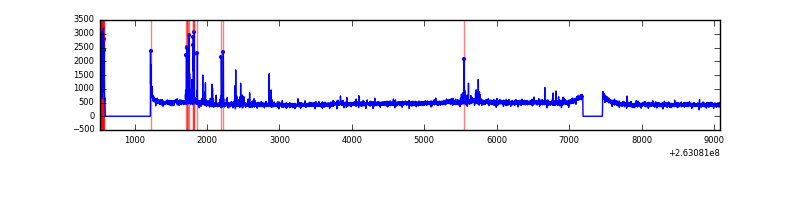 |
| D | 8559 | 7666 | 139 | 139 | 1.62% | 1.81% | 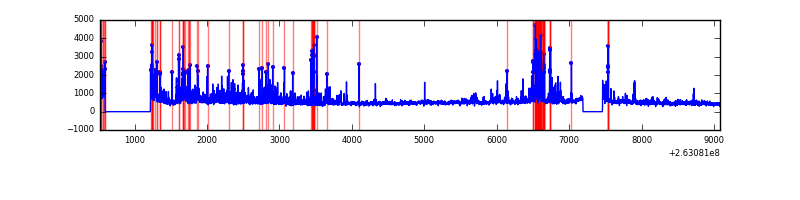 |
Top three noisy pixels from each quadrant. If the there are fewer than three noisy pixels in the level2.evt file, extra rows are filled as -1
| Pixel properties | Quadrant properties | ||||||
|---|---|---|---|---|---|---|---|
| Quadrant | DetID | PixID | Counts | Sigma | Mean | Median | Sigma |
| A | 8 | 15 | 114112 | 627.59 | 882 | 862 | 180.5 |
| A | 12 | 189 | 84080 | 461.17 | 882 | 862 | 180.5 |
| A | 15 | 222 | 75061 | 411.19 | 882 | 862 | 180.5 |
| B | 0 | 219 | 376311 | 2261.95 | 884 | 863 | 166.0 |
| B | 10 | 245 | 327774 | 1969.53 | 884 | 863 | 166.0 |
| B | 0 | 189 | 115696 | 691.83 | 884 | 863 | 166.0 |
| C | 3 | 233 | 340389 | 1744.51 | 846 | 849 | 194.6 |
| C | 14 | 220 | 58635 | 296.9 | 846 | 849 | 194.6 |
| C | 0 | 207 | 29029 | 144.79 | 846 | 849 | 194.6 |
| D | 1 | 52 | 703546 | 3471.38 | 836 | 810 | 202.4 |
| D | 15 | 0 | 345092 | 1700.69 | 836 | 810 | 202.4 |
| D | 8 | 195 | 325765 | 1605.22 | 836 | 810 | 202.4 |
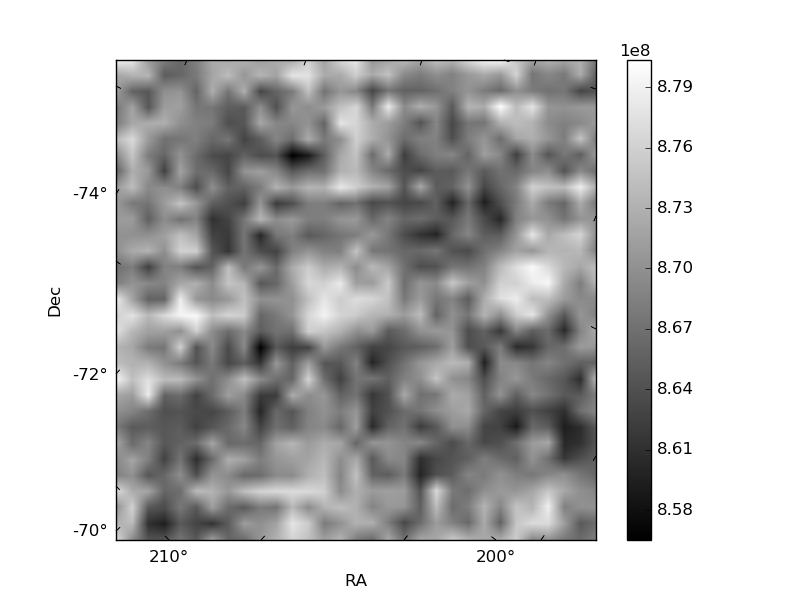
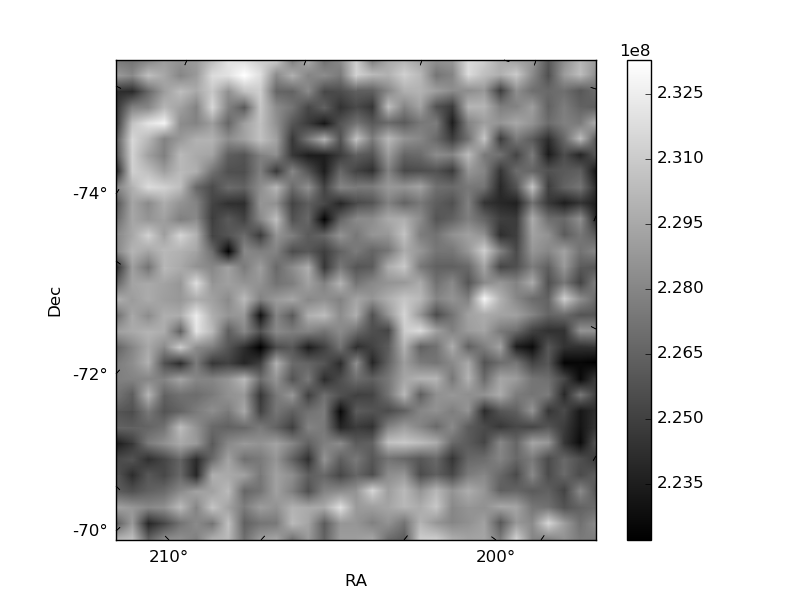
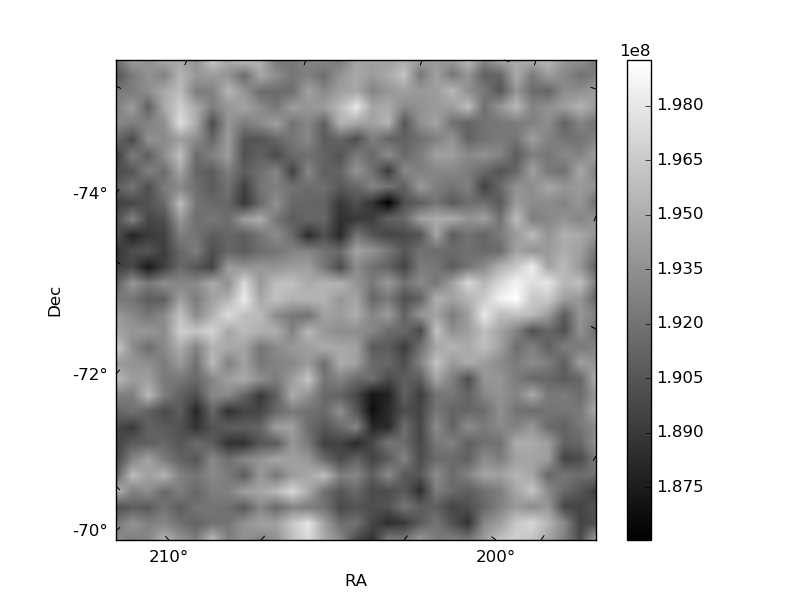
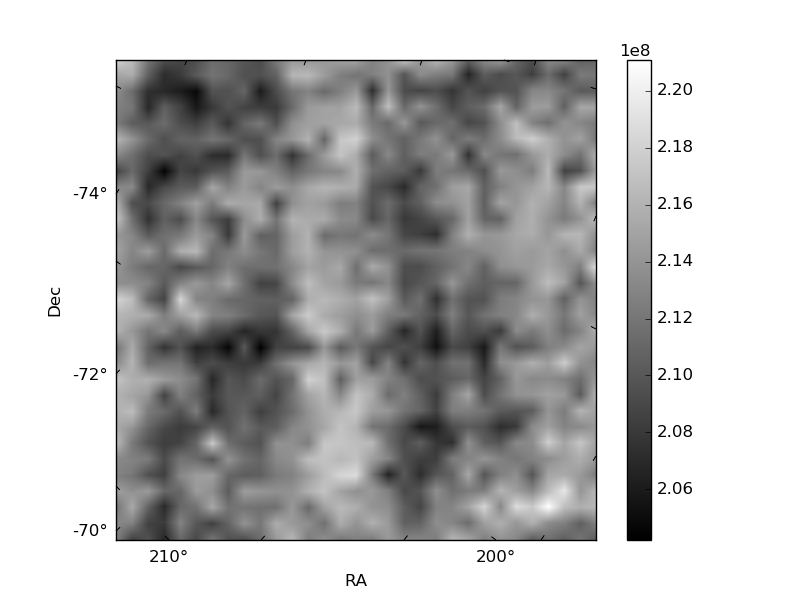
Histogram calculated using DETX and DETY for each event in the final _common_clean file
| Quadrant A | 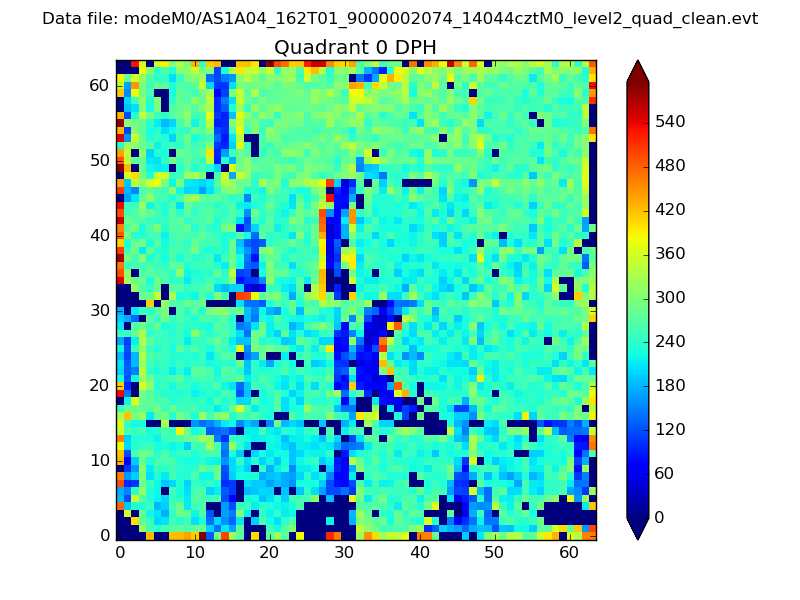 |
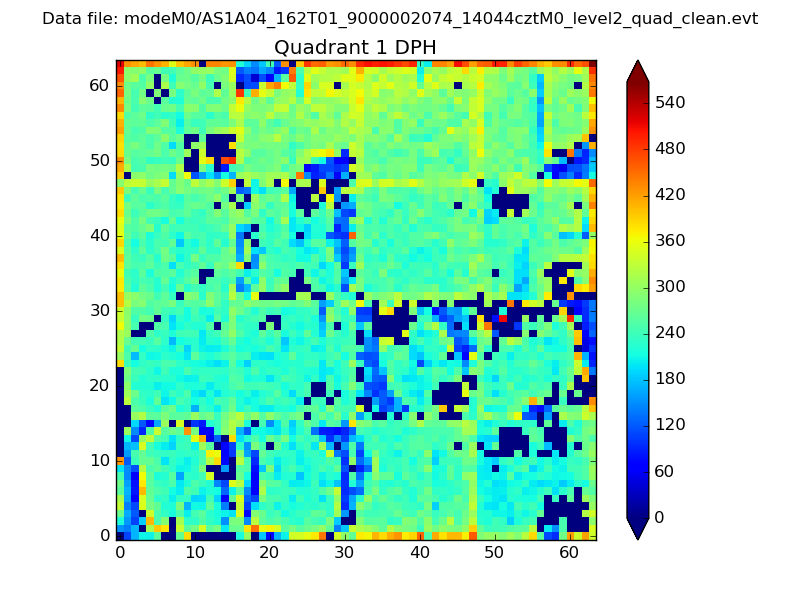 |
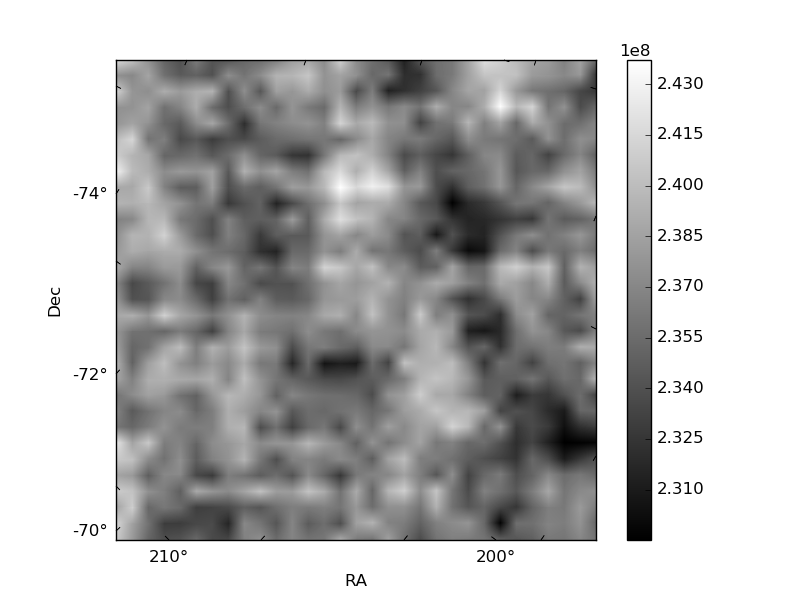
Quadrant B |
|---|---|---|---|
| Quadrant D | 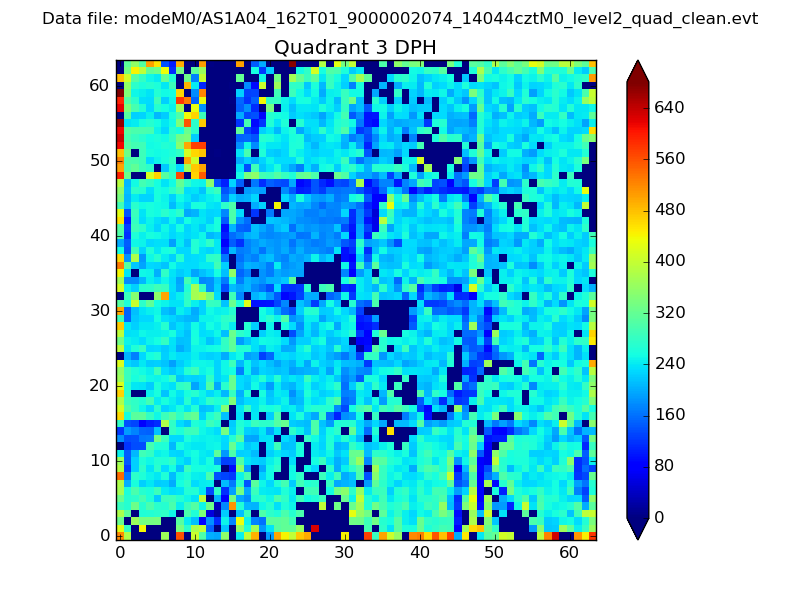 |
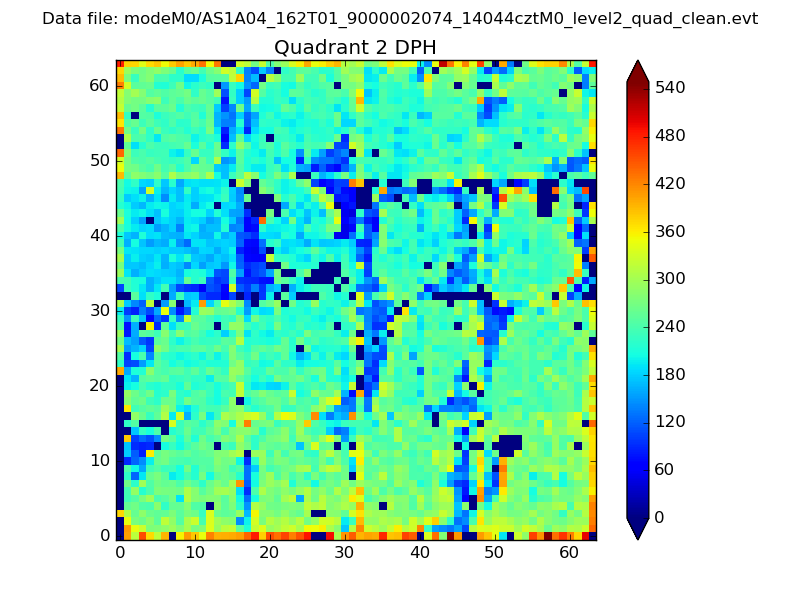 |
Quadrant C |
| Plot type | Count rate plots | Images |
|---|---|---|
| Comparison with Poisson distribution Blue bars denote a histogram of data divided into 1 sec bins. Red curve is a Poisson curve with rate = median count rate of data. |
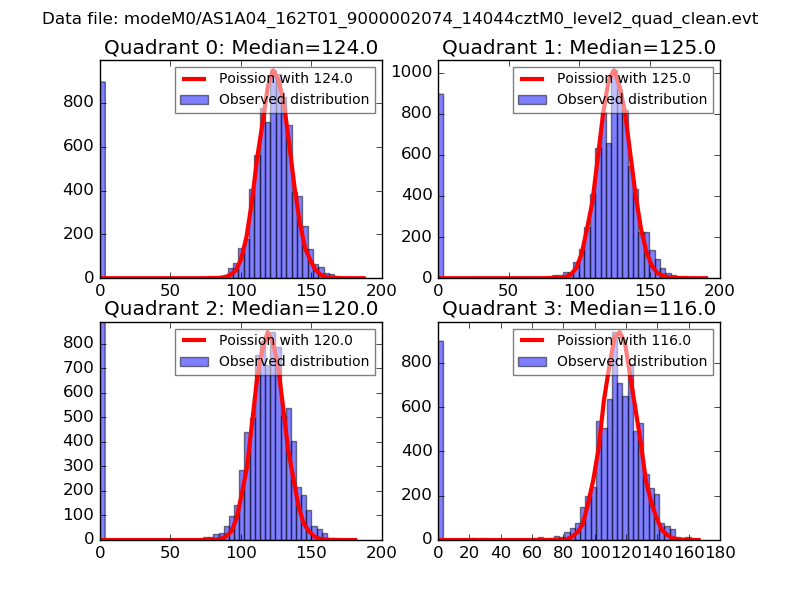 |
 |
| Quadrant-wise count rates Data is divided into 100 sec bins |
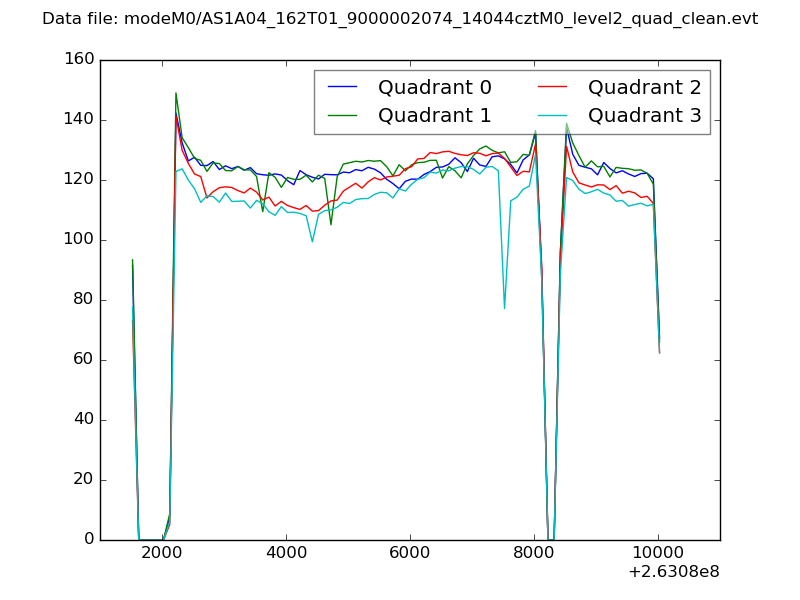 |
|
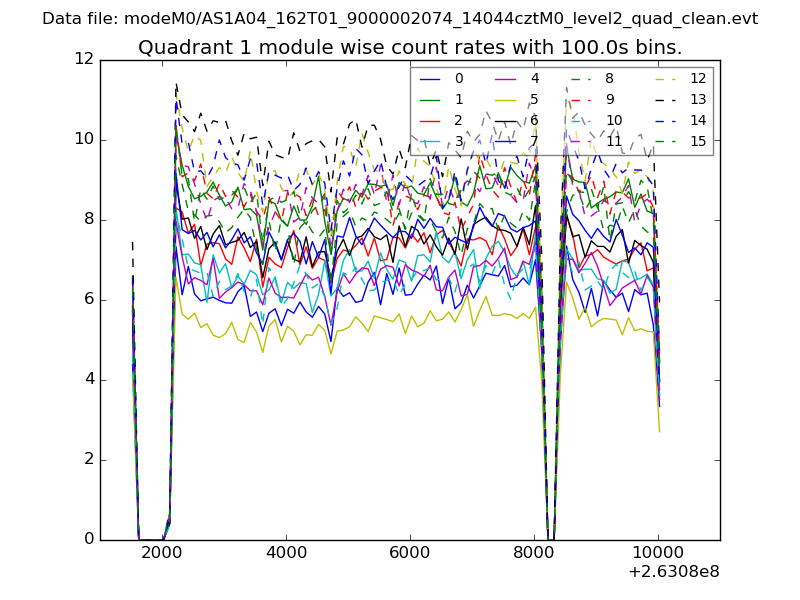
| Module-wise count rates for Quadrant A Data is divided into 100 sec bins |
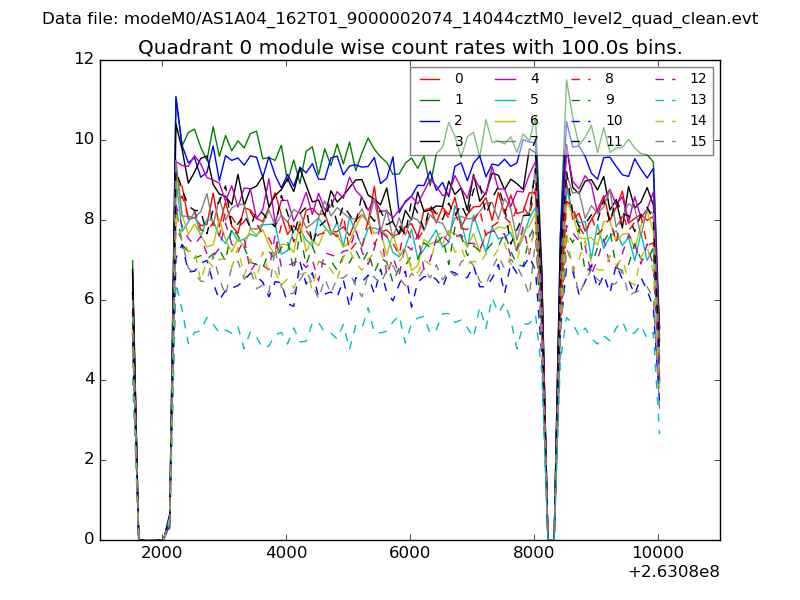 |
 |
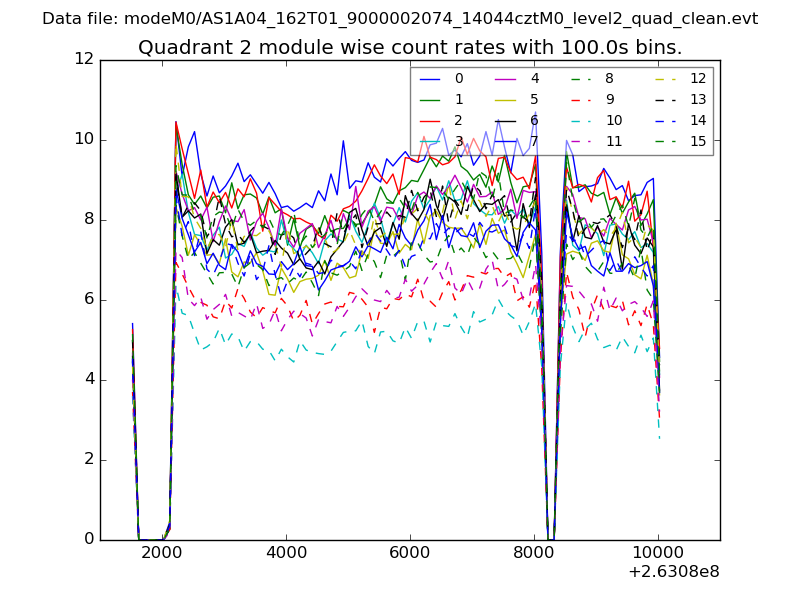
| Module-wise count rates for Quadrant B Data is divided into 100 sec bins |
 |
 |
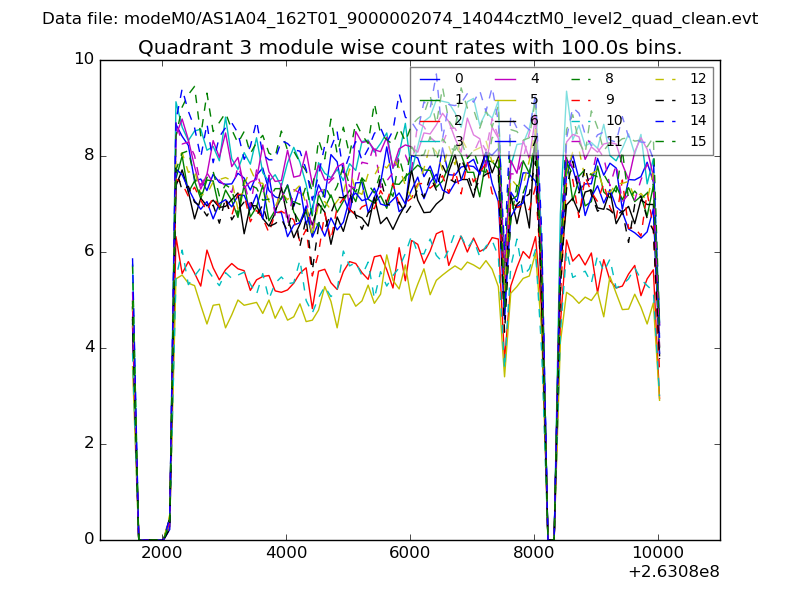
| Module-wise count rates for Quadrant C Data is divided into 100 sec bins |
 |
 |
| Module-wise count rates for Quadrant D Data is divided into 100 sec bins |
 |
 |
| Parameter | Plot |
|---|---|
| CZT HV Monitor | 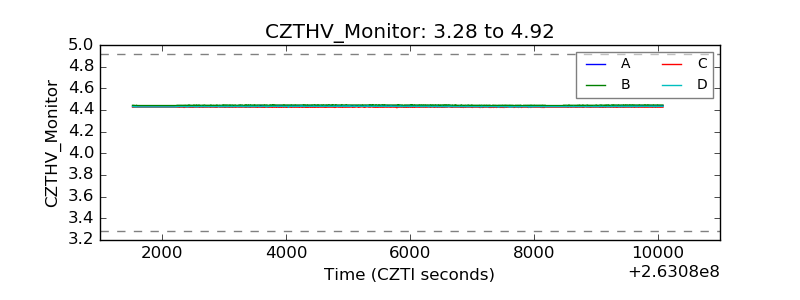 |
| D_VDD | 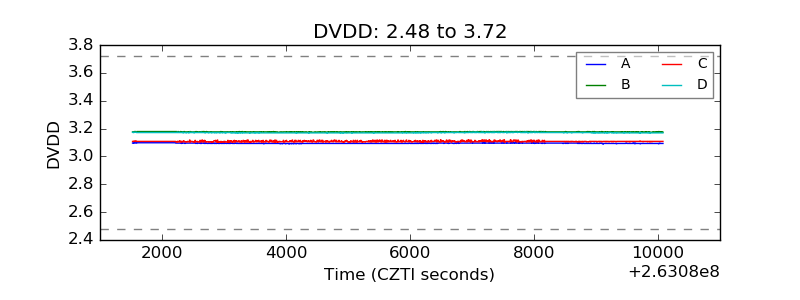 |
| Temperature 1 | 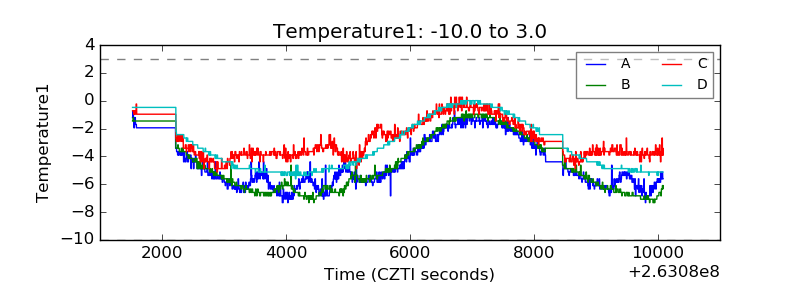 |
| Veto HV Monitor | 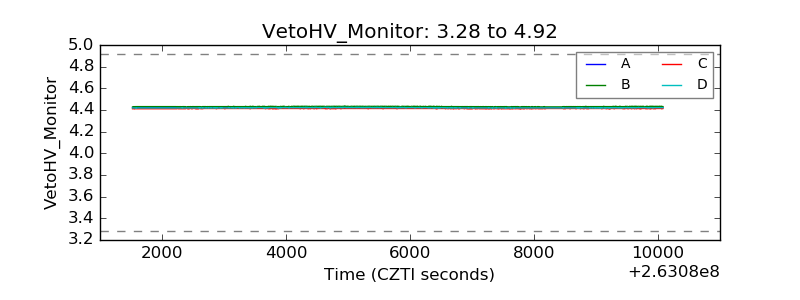 |
| Veto LLD | 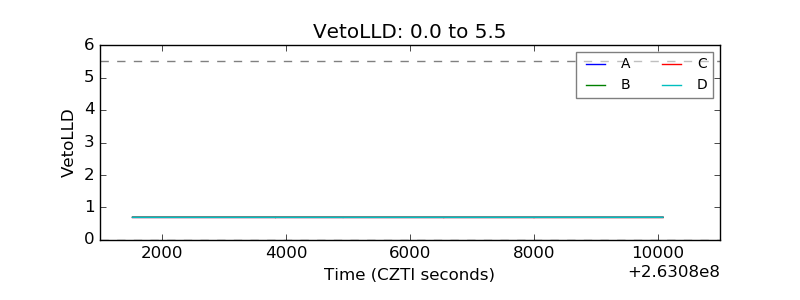 |
| Alpha Counter | 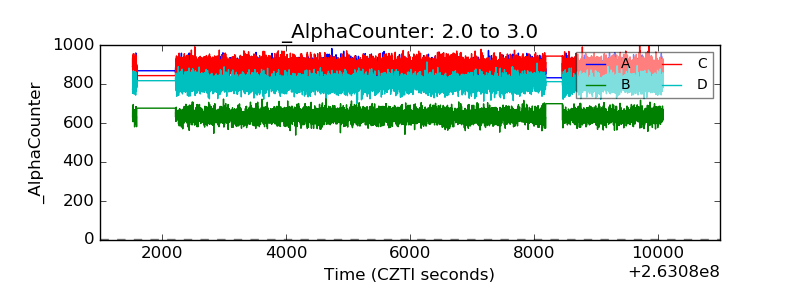 |
| _CPM_Rate | 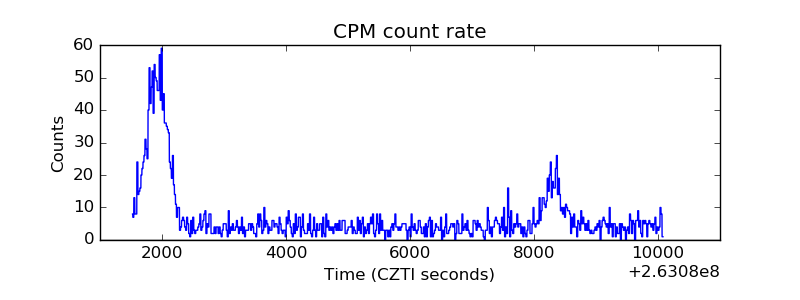 |
| CZT Counter | 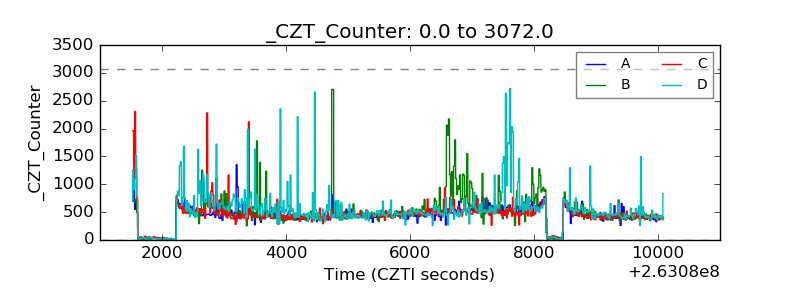 |
| +2.5 Volts monitor | 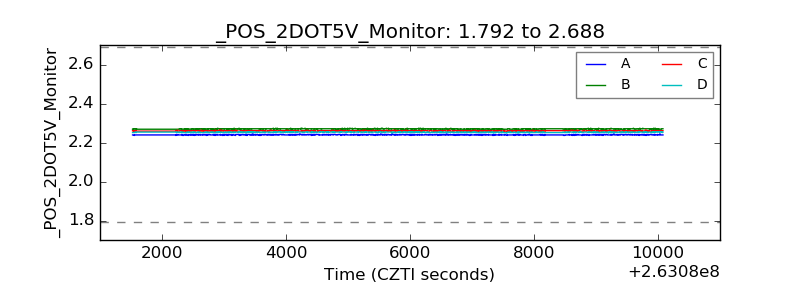 |
| +5 Volts monitor |  |
| _ROLL_ROT | 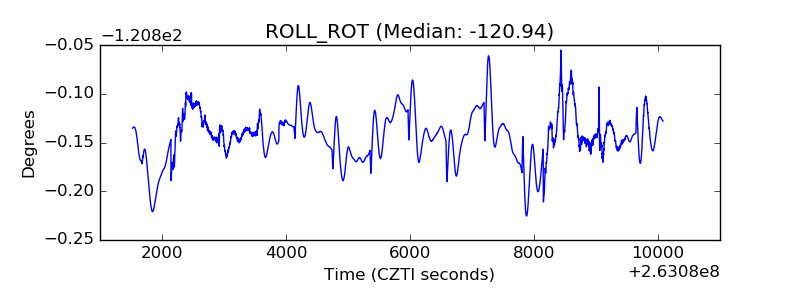 |
| _Roll_DEC | 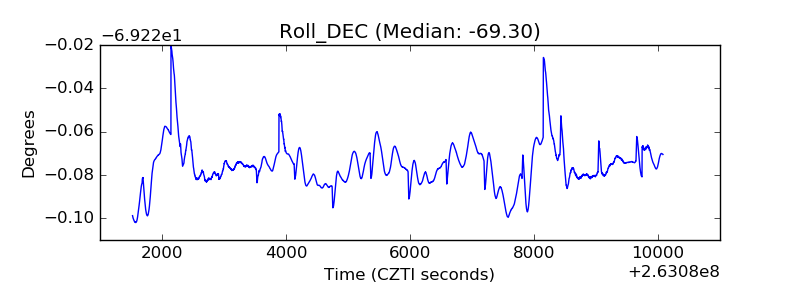 |
| _Roll_RA | 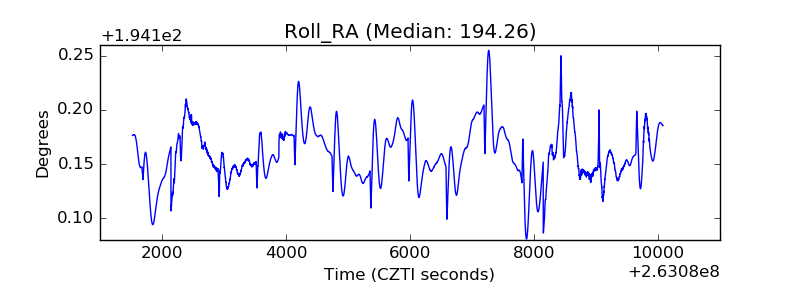 |
| Veto Counter | 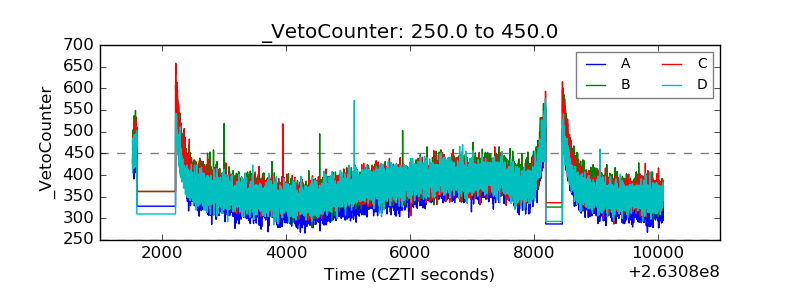 |