| Param | Original file | Final file |
|---|---|---|
| Filename | modeM0/AS1A04_162T01_9000002074_14045cztM0_level2.evt | modeM0/AS1A04_162T01_9000002074_14045cztM0_level2_quad_clean.evt |
| Size (bytes) | 575,161,920 | 146,813,760 |
| Size | 548.5 MB | 140.0 MB |
| Events in quadrant A | 3,812,640 | 998,443 |
| Events in quadrant B | 5,099,444 | 977,945 |
| Events in quadrant C | 3,766,062 | 968,170 |
| Events in quadrant D | 4,194,130 | 942,287 |
| Mode M0 | |||
|---|---|---|---|
| Quadrant | BADHDUFLAG | Total packets | Discarded packets |
| A | 0 | 16898 | 3 |
| B | 0 | 20597 | 2 |
| C | 0 | 16732 | 2 |
| D | 0 | 17761 | 2 |
| Mode M9 | |||
|---|---|---|---|
| Quadrant | BADHDUFLAG | Total packets | Discarded packets |
| A | 0 | 5 | 0 |
| B | 0 | 5 | 0 |
| C | 0 | 5 | 0 |
| D | 0 | 5 | 0 |
| Mode SS | |||
|---|---|---|---|
| Quadrant | BADHDUFLAG | Total packets | Discarded packets |
| A | 0 | 166 | 0 |
| B | 0 | 166 | 0 |
| C | 0 | 166 | 0 |
| D | 0 | 166 | 0 |
| Quadrant | Total seconds | Saturated seconds | Saturation percentage |
|---|---|---|---|
| A | 8055 | 134 | 1.663563% |
| B | 8055 | 560 | 6.952204% |
| C | 8055 | 116 | 1.440099% |
| D | 8055 | 126 | 1.564246% |
Noise dominated data is calculated using 1-second bins in cleaned event files. If a bin has >2000 counts, and if more than 50% of those come from <1% of pixels, then it is considered to be noise-dominated and hence unusable.
| Quadrant | # 1 sec bins | Bins with >0 counts | Bins with >2000 counts | High rate bins dominated by noise | Noise dominated (total time) | Noise dominated (detector-on time) | Marked lightcurve |
|---|---|---|---|---|---|---|---|
| A | 8516 | 8059 | 2 | 2 | 0.02% | 0.02% |  |
| B | 8516 | 8059 | 261 | 261 | 3.06% | 3.24% | 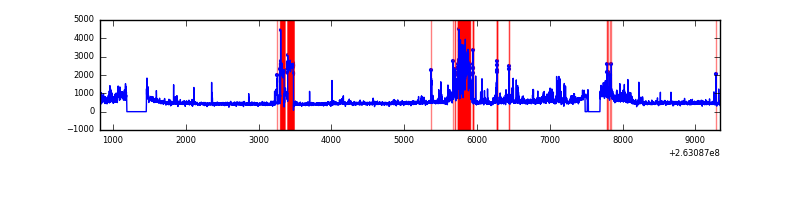 |
| C | 8516 | 8059 | 3 | 3 | 0.04% | 0.04% | 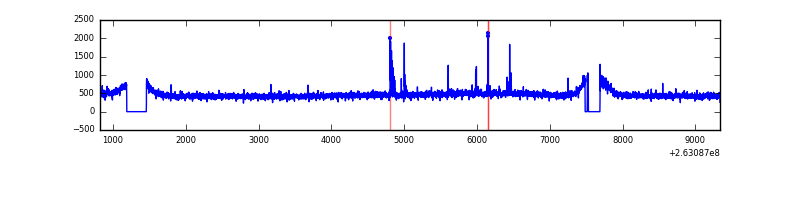 |
| D | 8516 | 8059 | 23 | 23 | 0.27% | 0.29% | 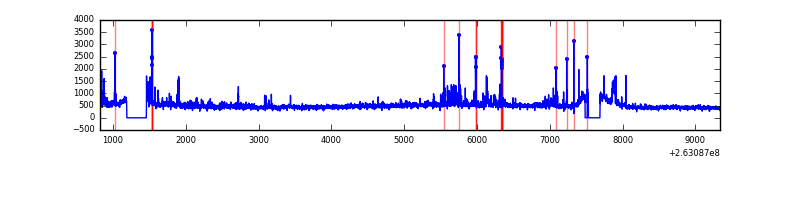 |
Top three noisy pixels from each quadrant. If the there are fewer than three noisy pixels in the level2.evt file, extra rows are filled as -1
| Pixel properties | Quadrant properties | ||||||
|---|---|---|---|---|---|---|---|
| Quadrant | DetID | PixID | Counts | Sigma | Mean | Median | Sigma |
| A | 12 | 189 | 94247 | 485.15 | 942 | 920 | 192.4 |
| A | 8 | 15 | 36473 | 184.82 | 942 | 920 | 192.4 |
| A | 15 | 69 | 18831 | 93.11 | 942 | 920 | 192.4 |
| B | 10 | 245 | 490199 | 2813.05 | 921 | 898 | 173.9 |
| B | 15 | 201 | 357363 | 2049.36 | 921 | 898 | 173.9 |
| B | 0 | 219 | 343891 | 1971.91 | 921 | 898 | 173.9 |
| C | 3 | 233 | 186801 | 880.2 | 910 | 911 | 211.2 |
| C | 0 | 207 | 26120 | 119.37 | 910 | 911 | 211.2 |
| C | 13 | 61 | 6546 | 26.68 | 910 | 911 | 211.2 |
| D | 8 | 195 | 257134 | 1080.11 | 896 | 875 | 237.3 |
| D | 1 | 52 | 225817 | 948.11 | 896 | 875 | 237.3 |
| D | 12 | 110 | 62289 | 258.85 | 896 | 875 | 237.3 |
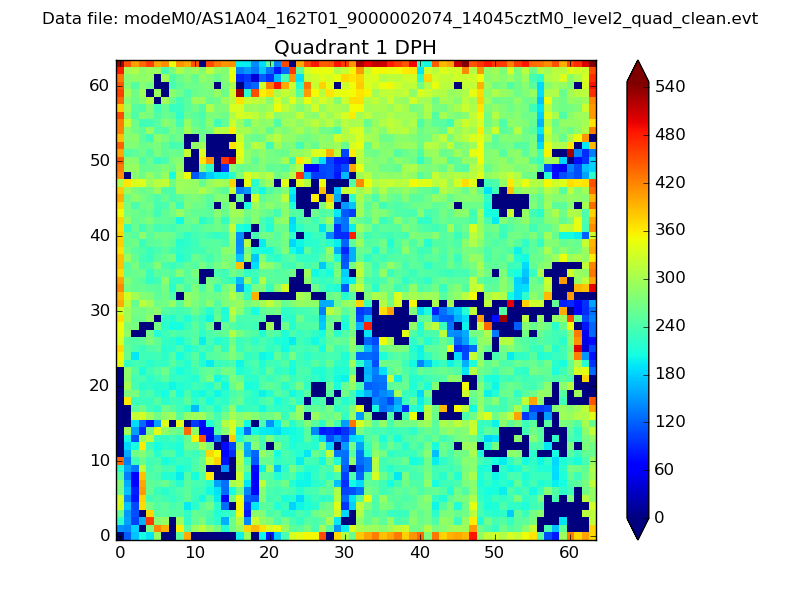
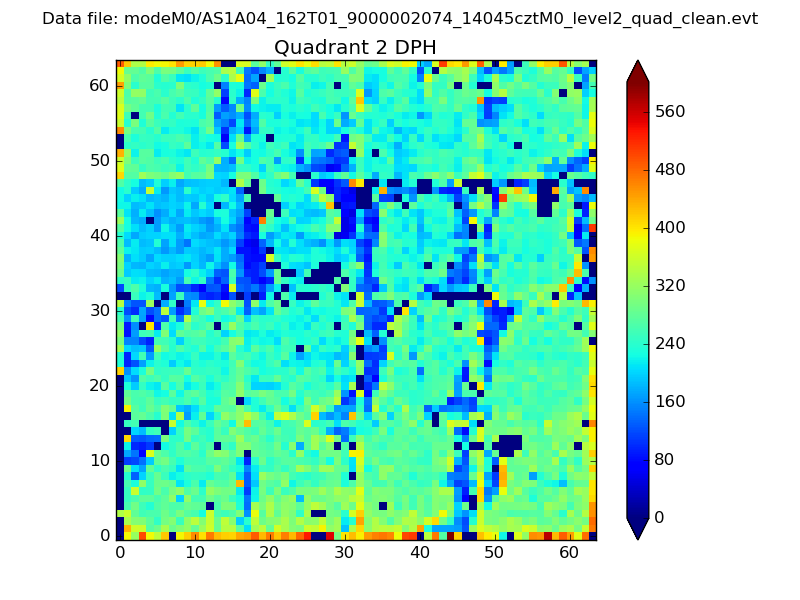
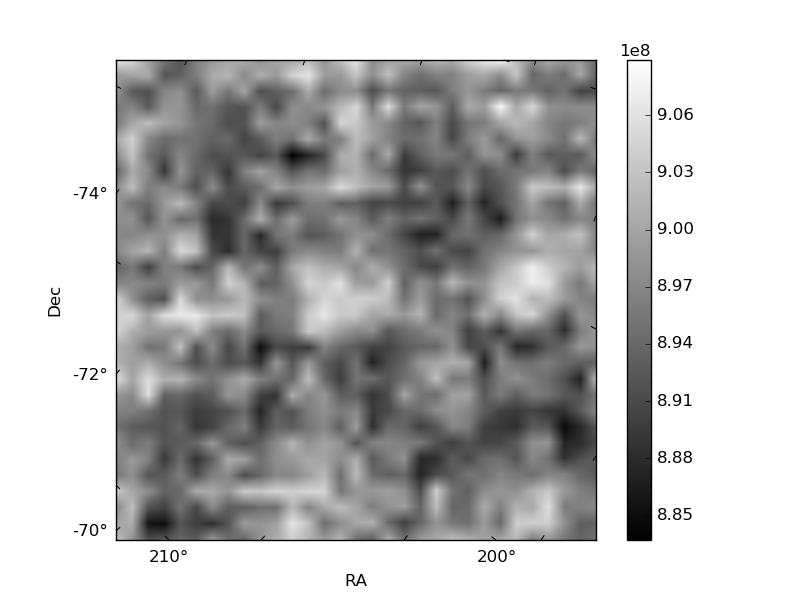
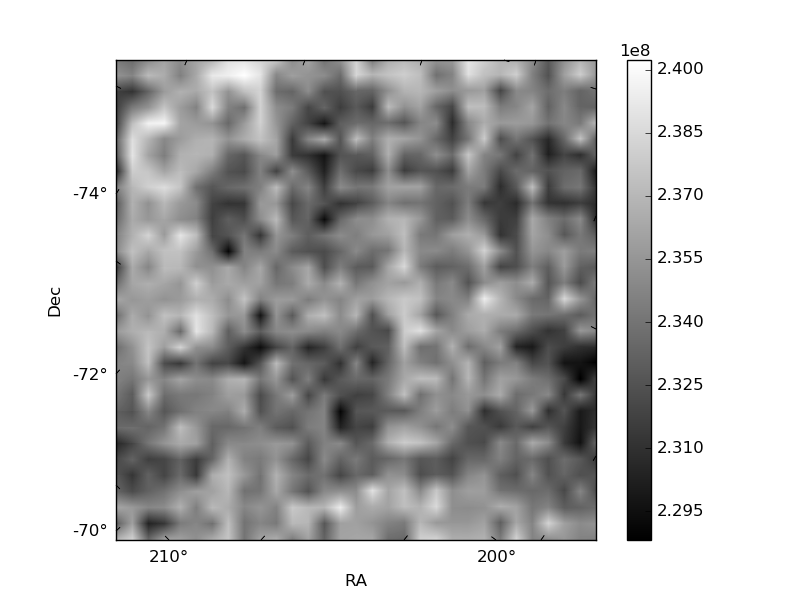
Histogram calculated using DETX and DETY for each event in the final _common_clean file
| Quadrant A | 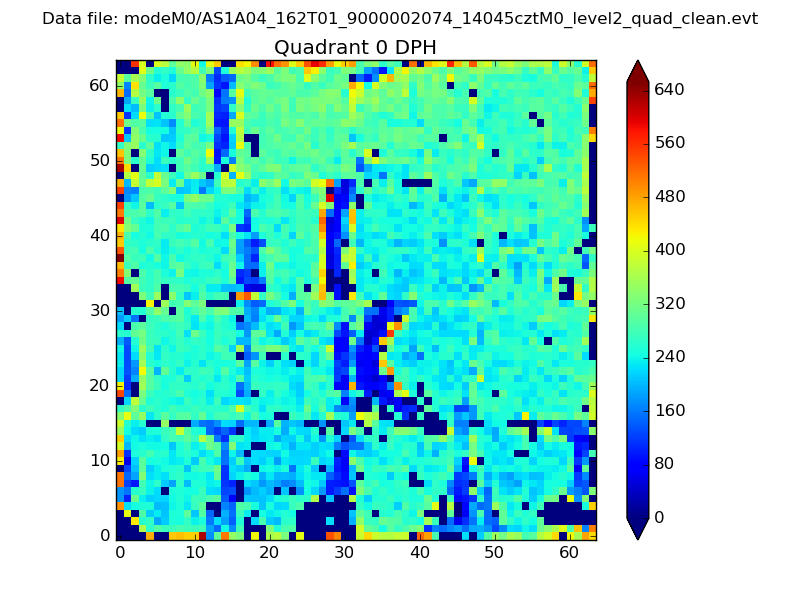 |
 |
Quadrant B |
|---|---|---|---|
| Quadrant D | 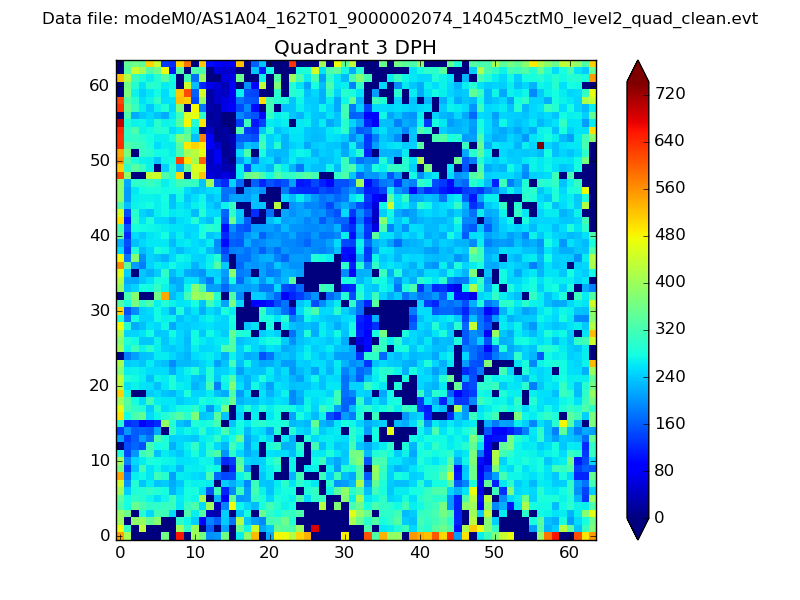 |
 |
Quadrant C |
| Plot type | Count rate plots | Images |
|---|---|---|
| Comparison with Poisson distribution Blue bars denote a histogram of data divided into 1 sec bins. Red curve is a Poisson curve with rate = median count rate of data. |
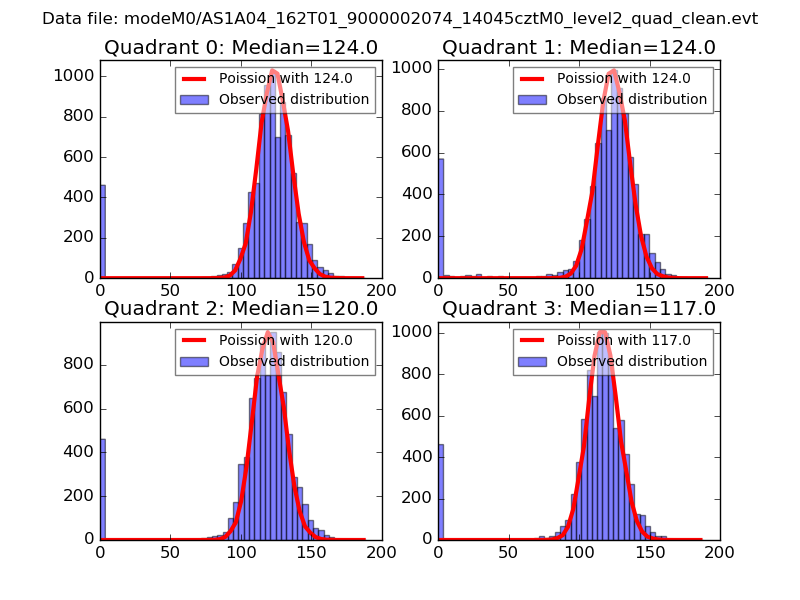 |
 |
| Quadrant-wise count rates Data is divided into 100 sec bins |
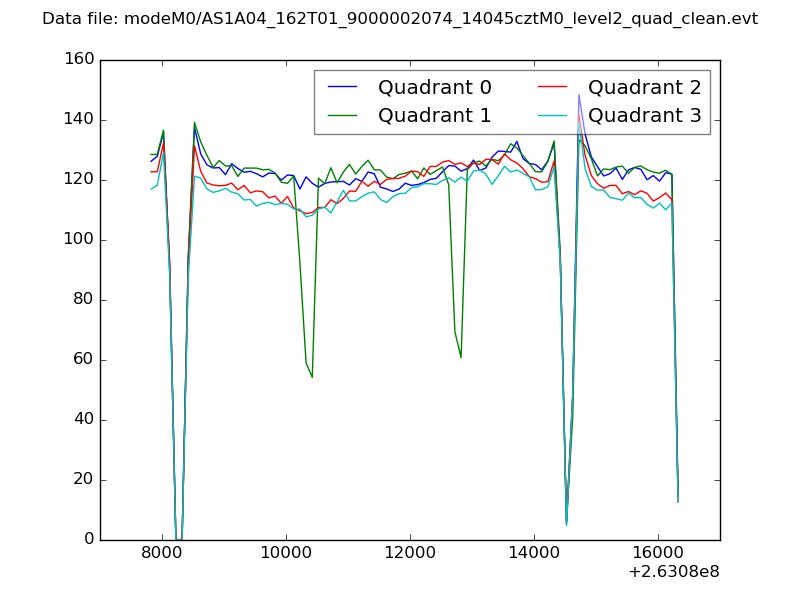 |
|
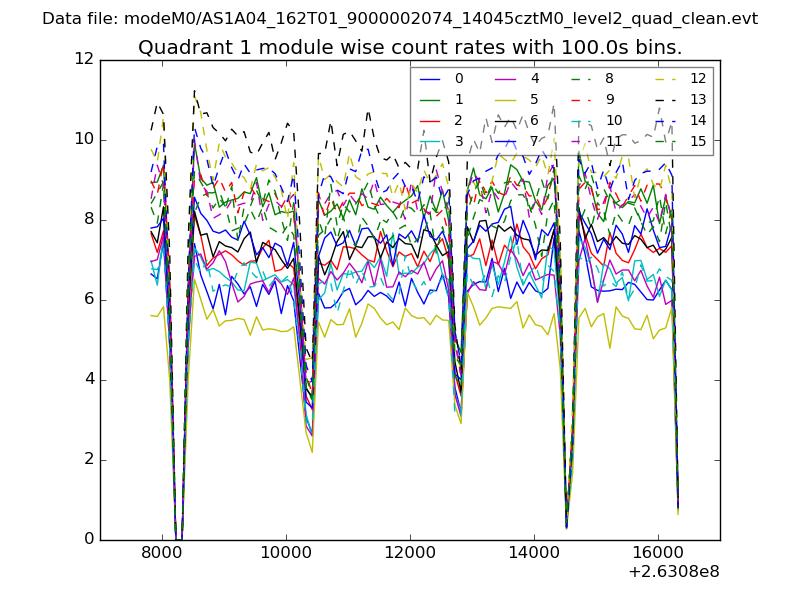
| Module-wise count rates for Quadrant A Data is divided into 100 sec bins |
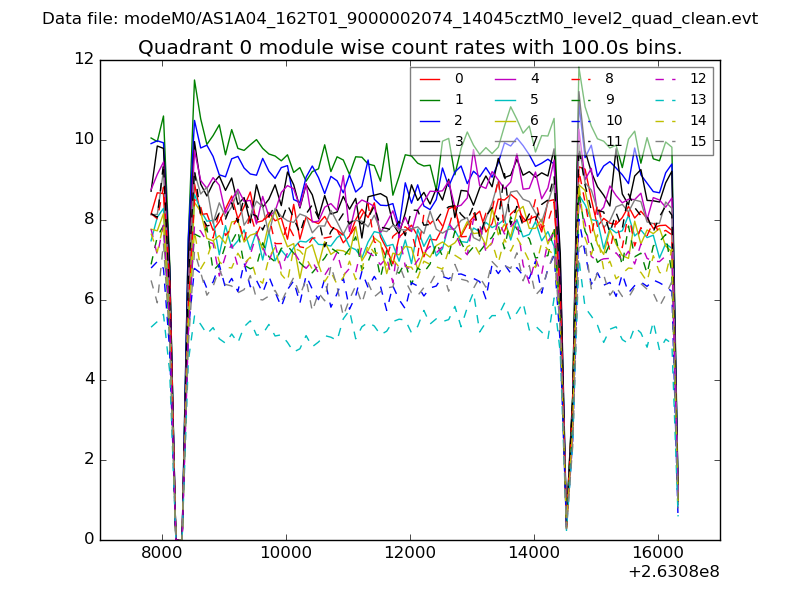 |
 |
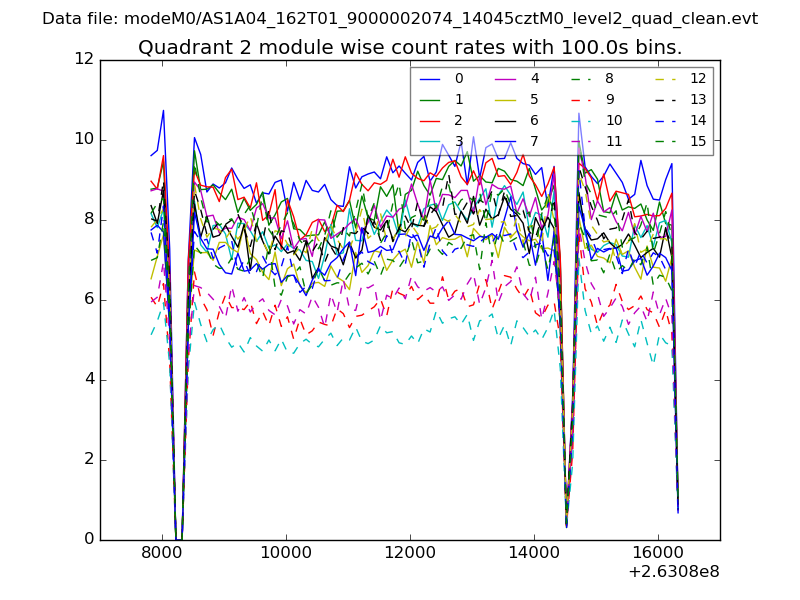
| Module-wise count rates for Quadrant B Data is divided into 100 sec bins |
 |
 |
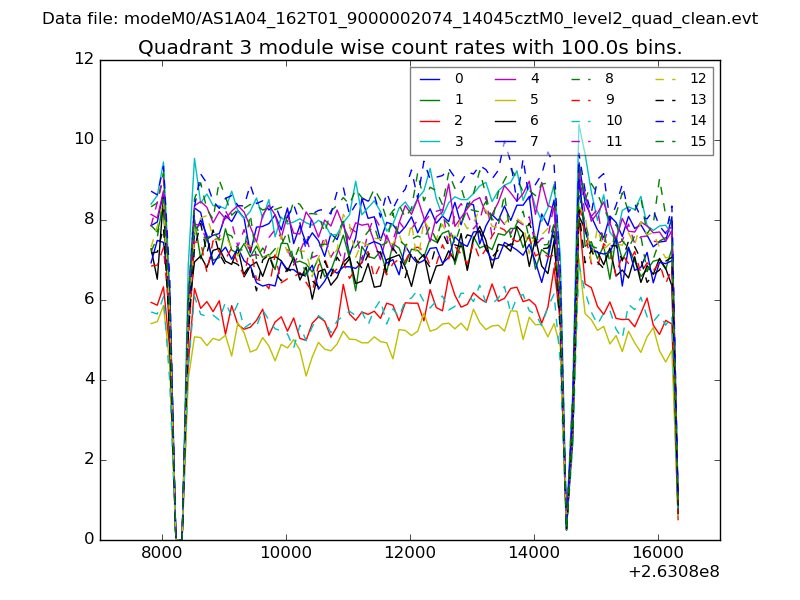
| Module-wise count rates for Quadrant C Data is divided into 100 sec bins |
 |
 |
| Module-wise count rates for Quadrant D Data is divided into 100 sec bins |
 |
 |
| Parameter | Plot |
|---|---|
| CZT HV Monitor | 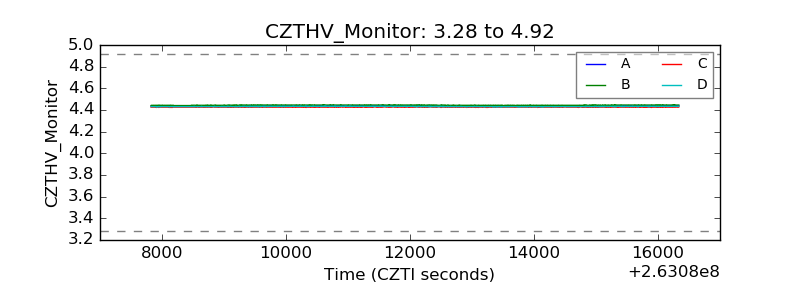 |
| D_VDD | 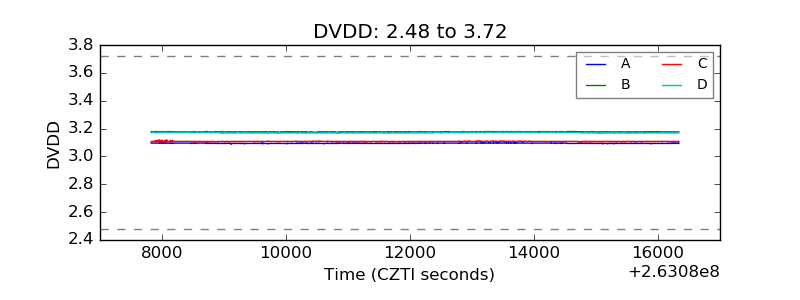 |
| Temperature 1 | 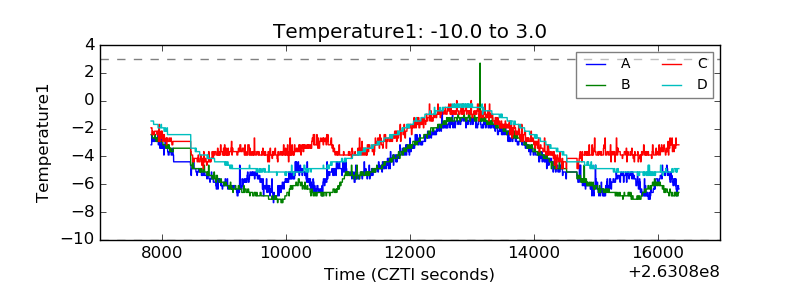 |
| Veto HV Monitor |  |
| Veto LLD | 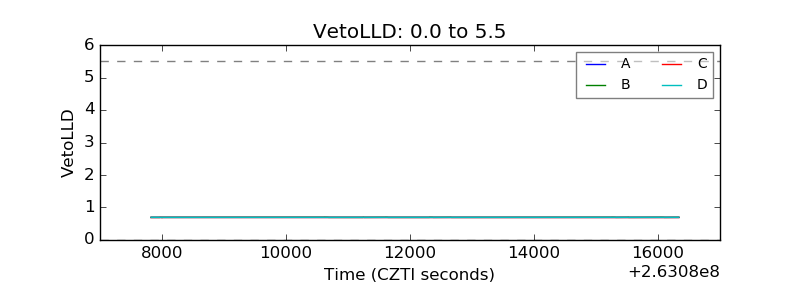 |
| Alpha Counter | 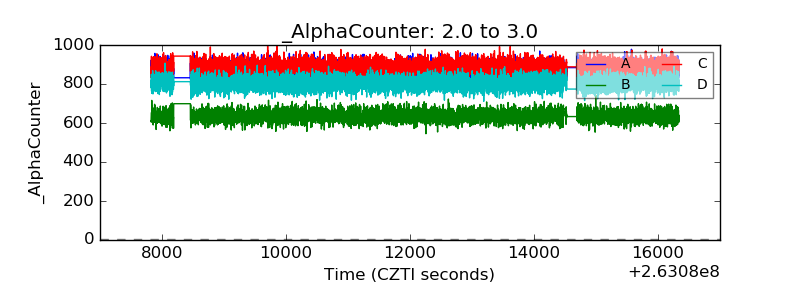 |
| _CPM_Rate | 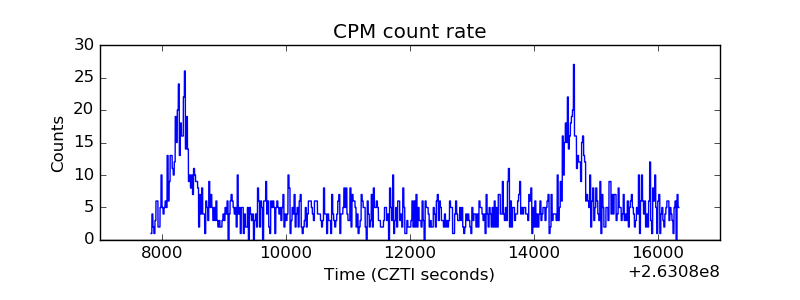 |
| CZT Counter | 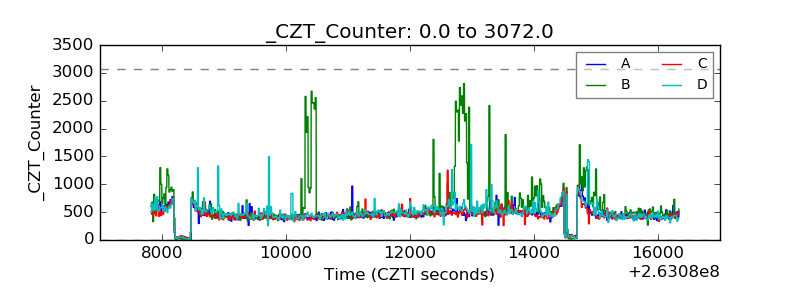 |
| +2.5 Volts monitor |  |
| +5 Volts monitor |  |
| _ROLL_ROT | 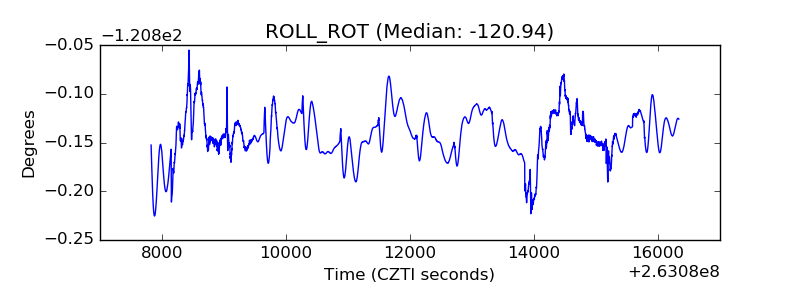 |
| _Roll_DEC | 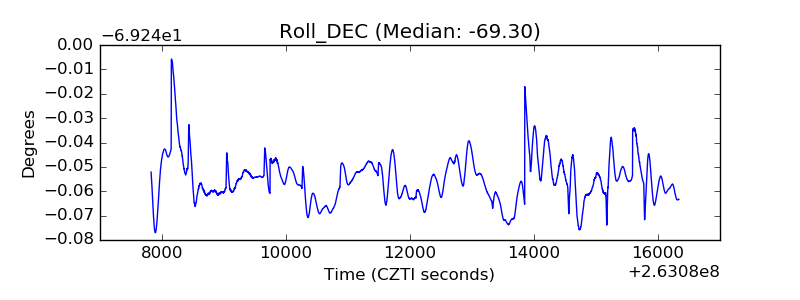 |
| _Roll_RA | 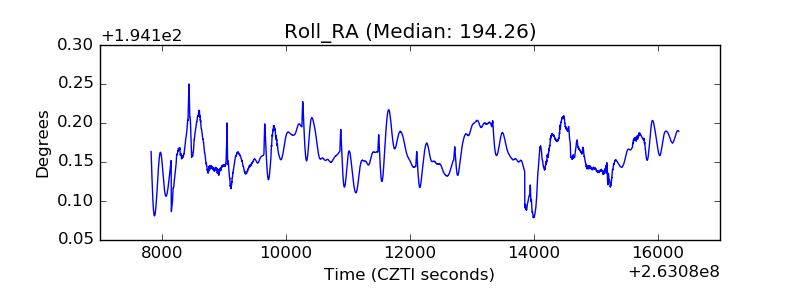 |
| Veto Counter | 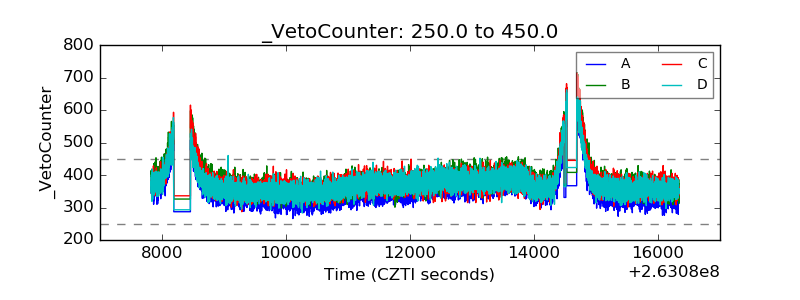 |