| Param | Original file | Final file |
|---|---|---|
| Filename | modeM0/AS1A04_162T01_9000002074_14048cztM0_level2.evt | modeM0/AS1A04_162T01_9000002074_14048cztM0_level2_quad_clean.evt |
| Size (bytes) | 1,332,089,280 | 343,848,960 |
| Size | 1.2 GB | 327.9 MB |
| Events in quadrant A | 8,977,581 | 2,316,992 |
| Events in quadrant B | 10,435,204 | 2,339,233 |
| Events in quadrant C | 9,106,330 | 2,271,517 |
| Events in quadrant D | 10,546,910 | 2,186,869 |
| Mode M0 | |||
|---|---|---|---|
| Quadrant | BADHDUFLAG | Total packets | Discarded packets |
| A | 0 | 39078 | 4 |
| B | 0 | 43042 | 3 |
| C | 0 | 39588 | 3 |
| D | 0 | 43502 | 3 |
| Mode M9 | |||
|---|---|---|---|
| Quadrant | BADHDUFLAG | Total packets | Discarded packets |
| A | 0 | 20 | 0 |
| B | 0 | 20 | 0 |
| C | 0 | 20 | 0 |
| D | 0 | 20 | 0 |
| Mode SS | |||
|---|---|---|---|
| Quadrant | BADHDUFLAG | Total packets | Discarded packets |
| A | 0 | 386 | 0 |
| B | 0 | 386 | 0 |
| C | 0 | 386 | 0 |
| D | 0 | 386 | 0 |
| Quadrant | Total seconds | Saturated seconds | Saturation percentage |
|---|---|---|---|
| A | 18887 | 242 | 1.281305% |
| B | 18887 | 430 | 2.276698% |
| C | 18887 | 275 | 1.456028% |
| D | 18887 | 356 | 1.884894% |
Noise dominated data is calculated using 1-second bins in cleaned event files. If a bin has >2000 counts, and if more than 50% of those come from <1% of pixels, then it is considered to be noise-dominated and hence unusable.
| Quadrant | # 1 sec bins | Bins with >0 counts | Bins with >2000 counts | High rate bins dominated by noise | Noise dominated (total time) | Noise dominated (detector-on time) | Marked lightcurve |
|---|---|---|---|---|---|---|---|
| A | 20863 | 18893 | 4 | 4 | 0.02% | 0.02% | 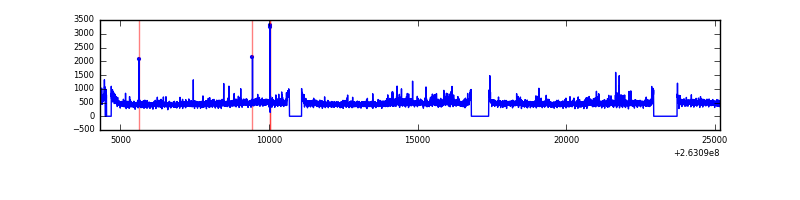 |
| B | 20863 | 18893 | 54 | 54 | 0.26% | 0.29% | 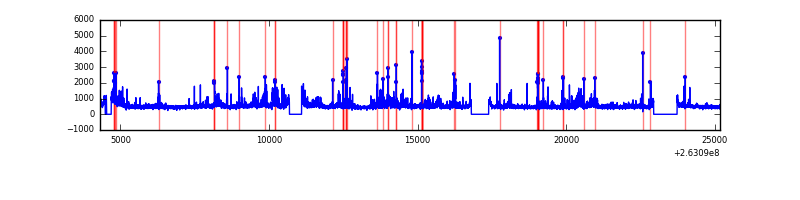 |
| C | 20863 | 18893 | 56 | 56 | 0.27% | 0.30% | 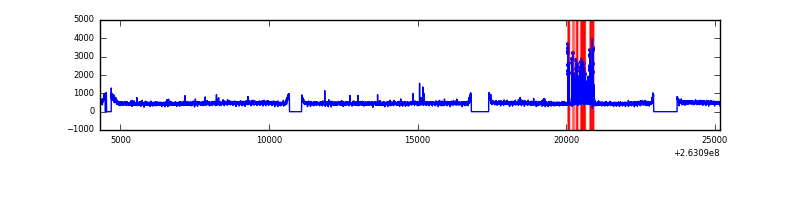 |
| D | 20863 | 18893 | 151 | 151 | 0.72% | 0.80% |  |
Top three noisy pixels from each quadrant. If the there are fewer than three noisy pixels in the level2.evt file, extra rows are filled as -1
| Pixel properties | Quadrant properties | ||||||
|---|---|---|---|---|---|---|---|
| Quadrant | DetID | PixID | Counts | Sigma | Mean | Median | Sigma |
| A | 12 | 189 | 214720 | 475.63 | 2210 | 2156 | 446.9 |
| A | 8 | 15 | 143970 | 317.32 | 2210 | 2156 | 446.9 |
| A | 15 | 222 | 47173 | 100.73 | 2210 | 2156 | 446.9 |
| B | 0 | 219 | 708102 | 1690.91 | 2207 | 2148 | 417.5 |
| B | 0 | 189 | 464473 | 1107.37 | 2207 | 2148 | 417.5 |
| B | 10 | 245 | 197471 | 467.84 | 2207 | 2148 | 417.5 |
| C | 0 | 207 | 386585 | 781.9 | 2141 | 2143 | 491.7 |
| C | 3 | 233 | 358699 | 725.19 | 2141 | 2143 | 491.7 |
| C | 13 | 61 | 15240 | 26.64 | 2141 | 2143 | 491.7 |
| D | 1 | 52 | 727752 | 1298.2 | 2118 | 2064 | 559.0 |
| D | 8 | 195 | 681774 | 1215.94 | 2118 | 2064 | 559.0 |
| D | 15 | 0 | 221334 | 392.26 | 2118 | 2064 | 559.0 |
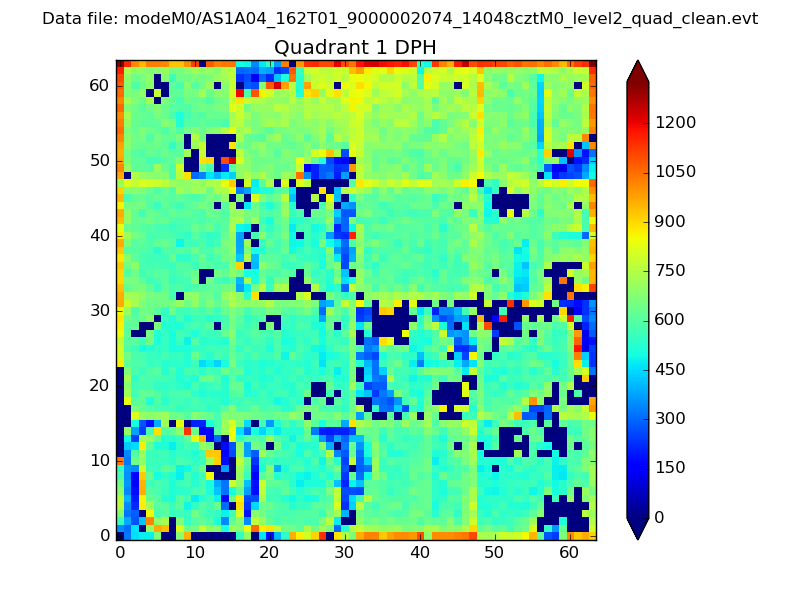
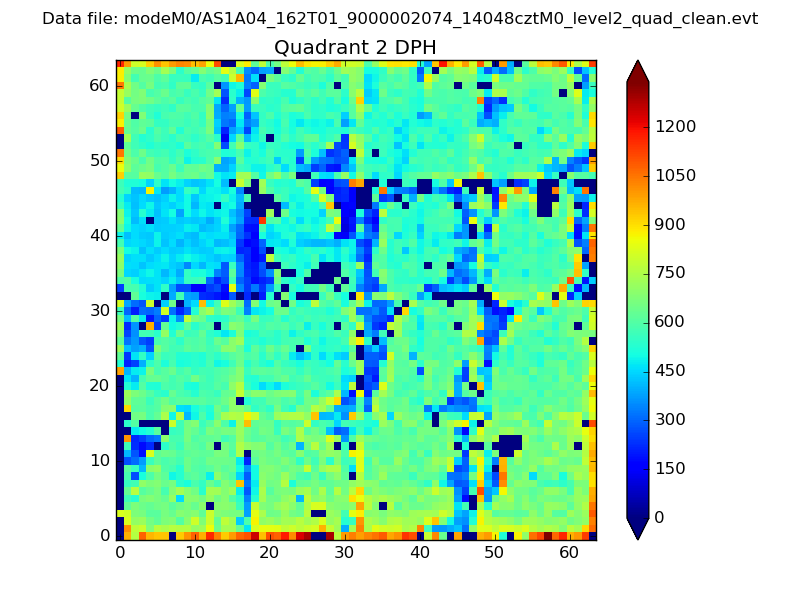
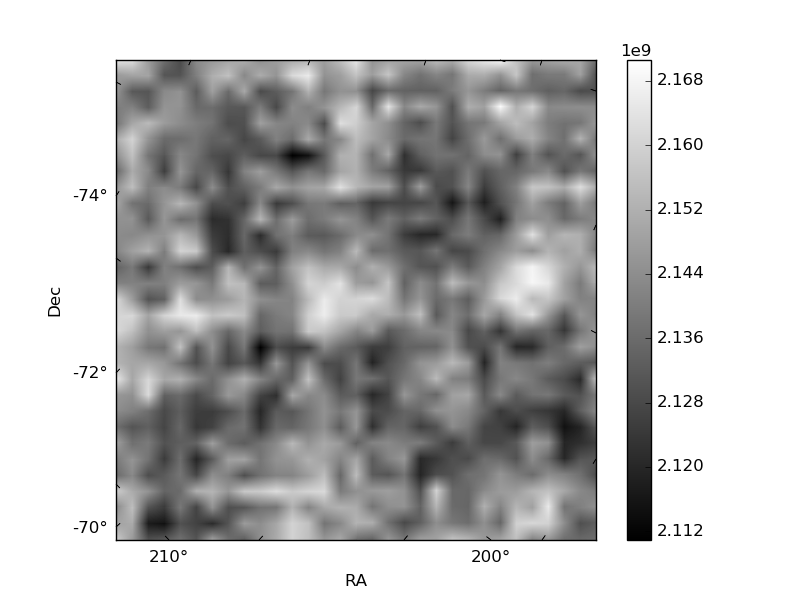
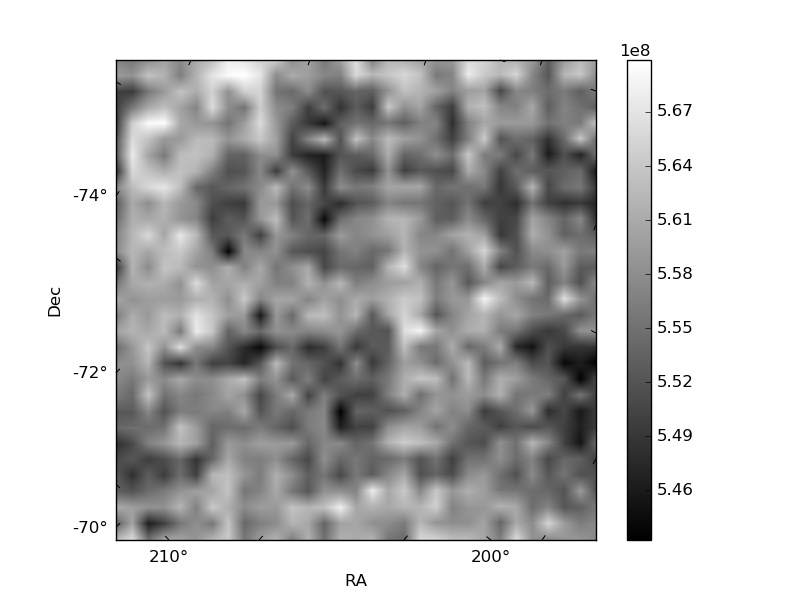
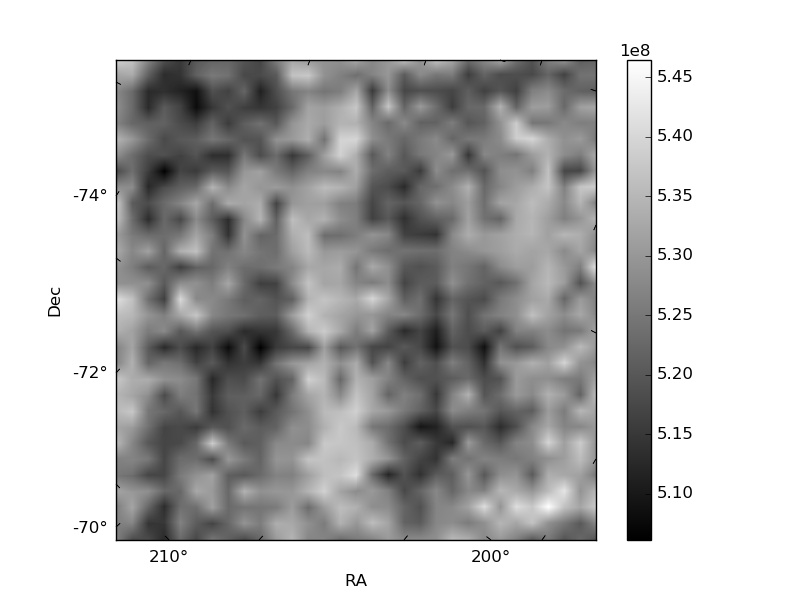
Histogram calculated using DETX and DETY for each event in the final _common_clean file
| Quadrant A | 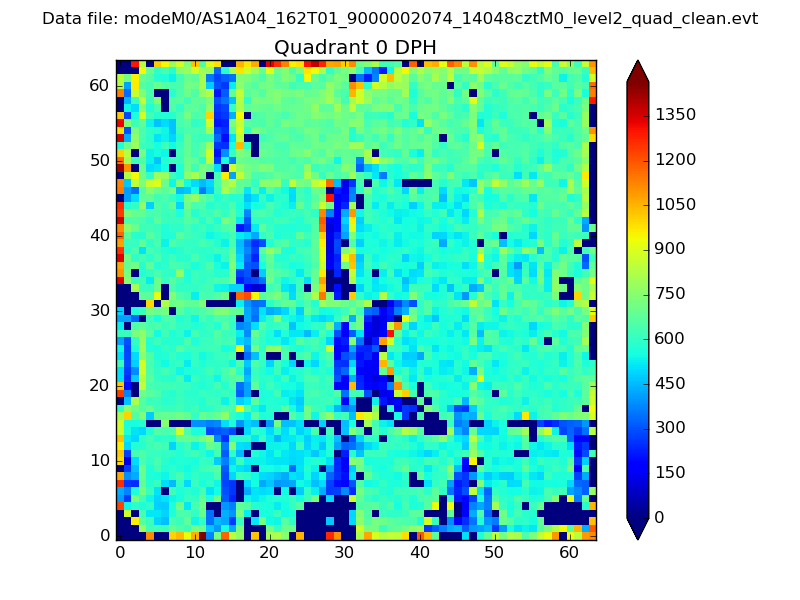 |
 |
Quadrant B |
|---|---|---|---|
| Quadrant D | 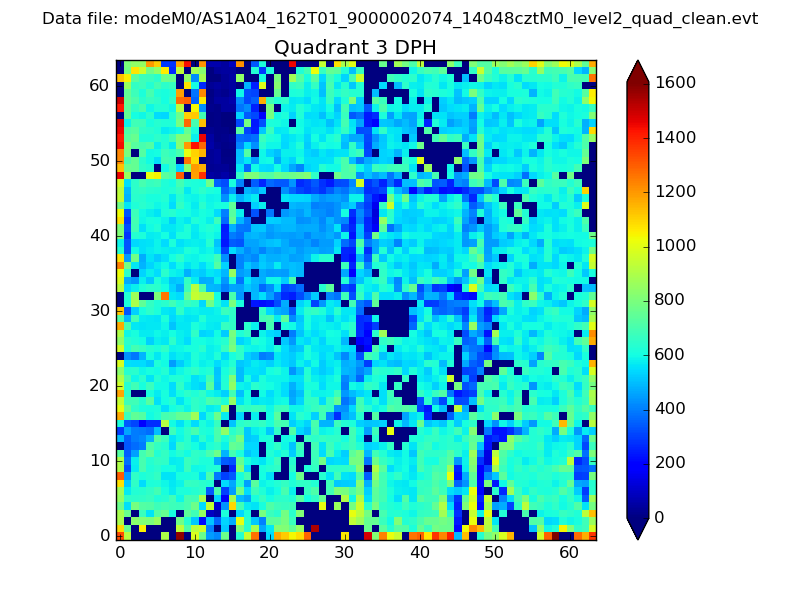 |
 |
Quadrant C |
| Plot type | Count rate plots | Images |
|---|---|---|
| Comparison with Poisson distribution Blue bars denote a histogram of data divided into 1 sec bins. Red curve is a Poisson curve with rate = median count rate of data. |
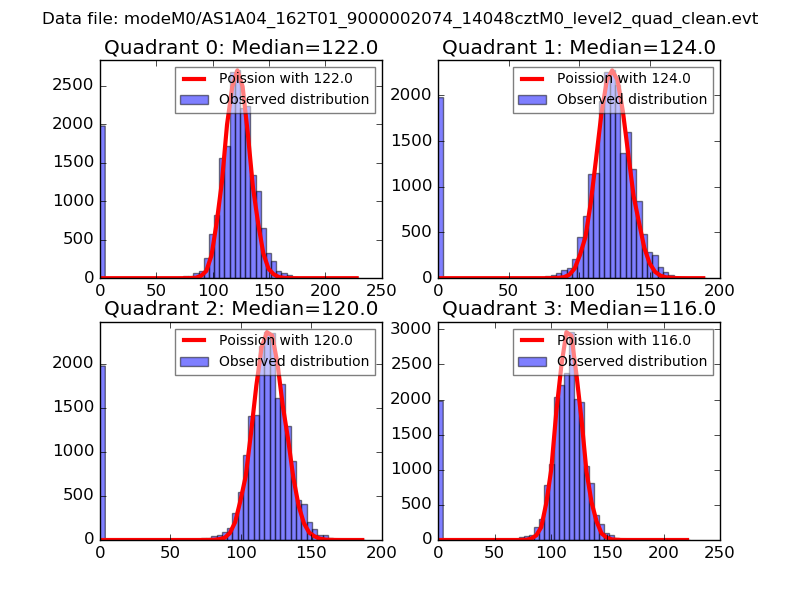 |
 |
| Quadrant-wise count rates Data is divided into 100 sec bins |
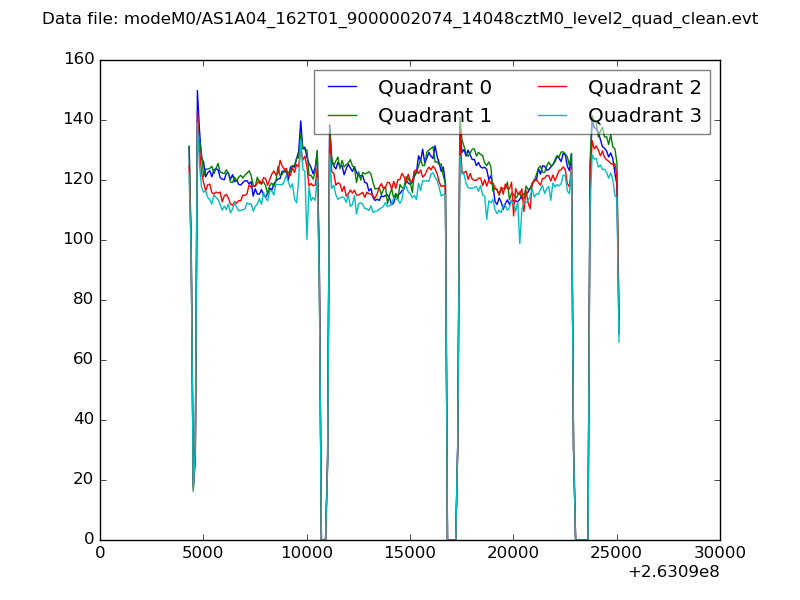 |
|
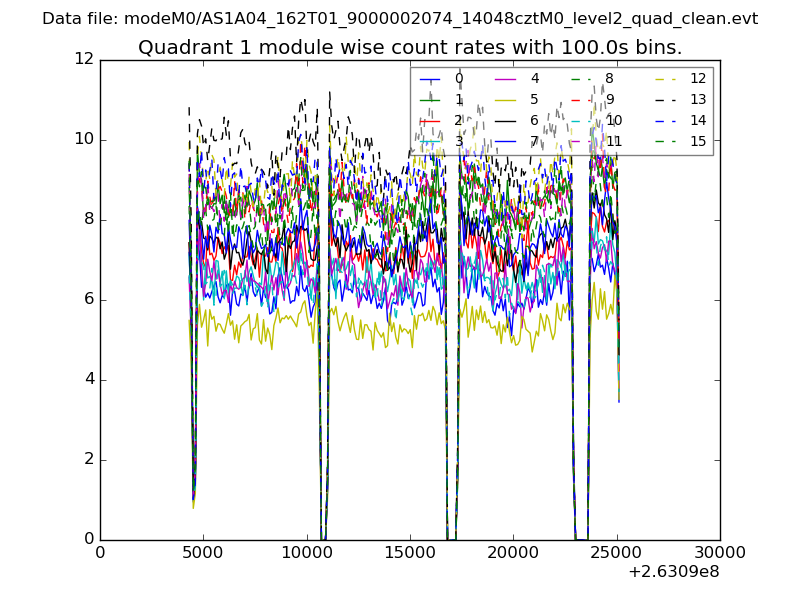
| Module-wise count rates for Quadrant A Data is divided into 100 sec bins |
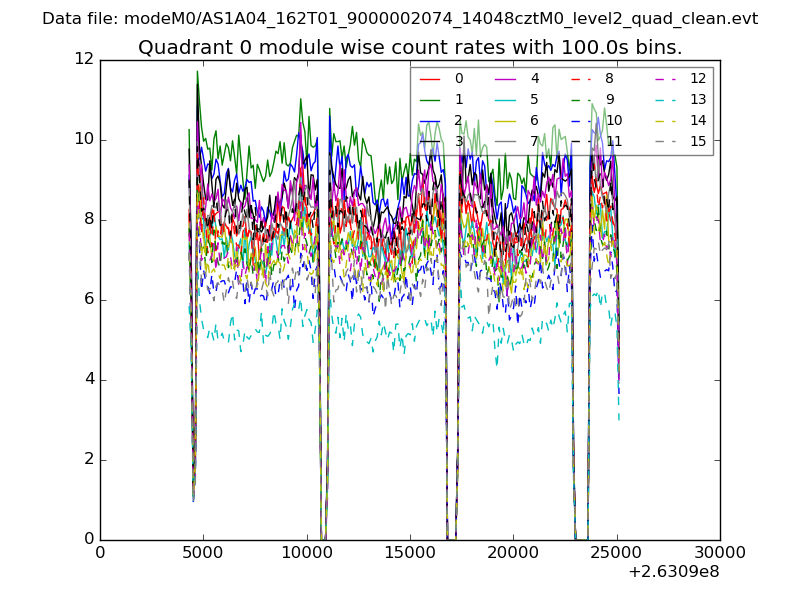 |
 |
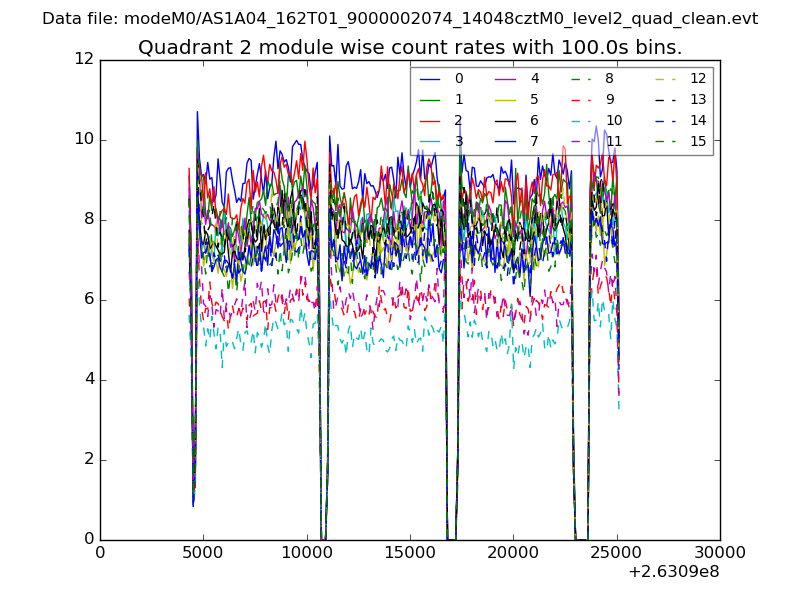
| Module-wise count rates for Quadrant B Data is divided into 100 sec bins |
 |
 |
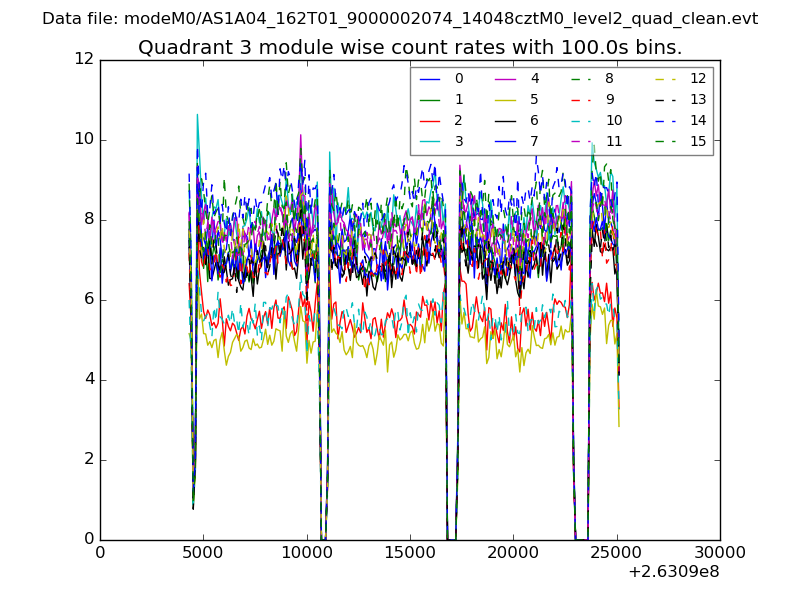
| Module-wise count rates for Quadrant C Data is divided into 100 sec bins |
 |
 |
| Module-wise count rates for Quadrant D Data is divided into 100 sec bins |
 |
 |
| Parameter | Plot |
|---|---|
| CZT HV Monitor | 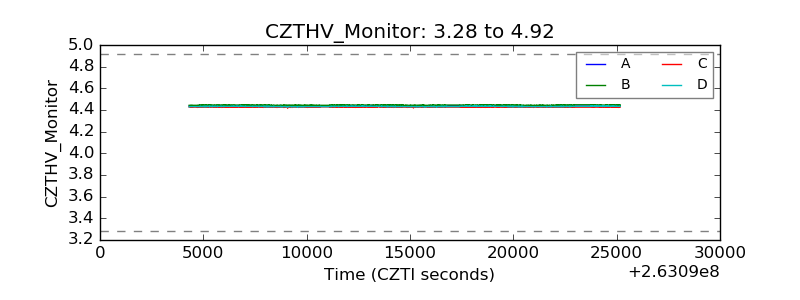 |
| D_VDD |  |
| Temperature 1 | 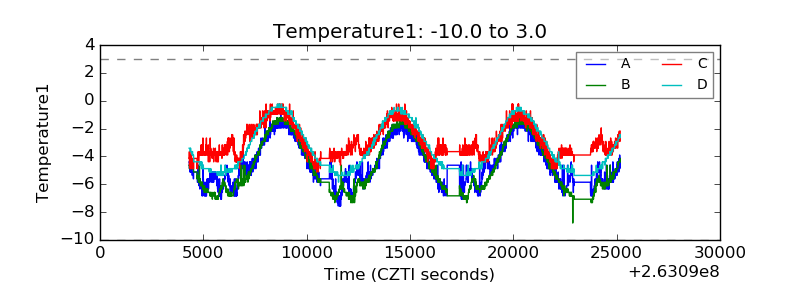 |
| Veto HV Monitor | 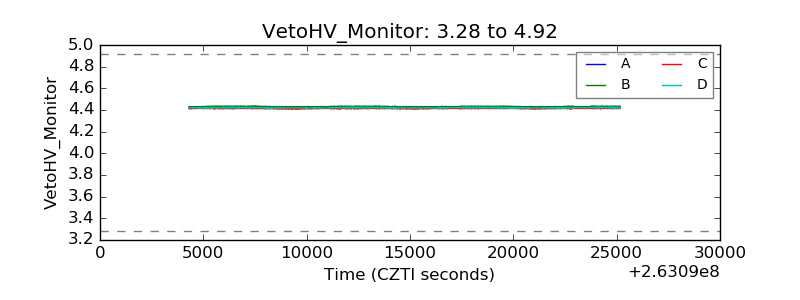 |
| Veto LLD | 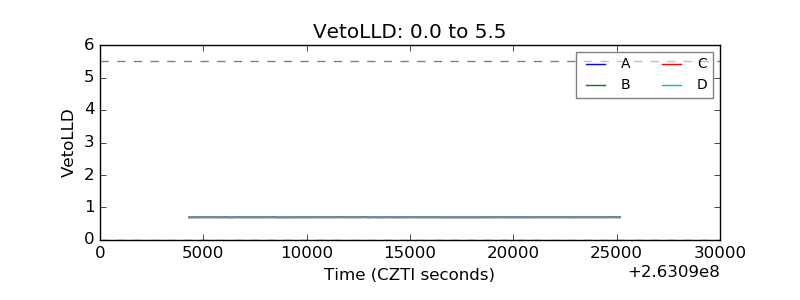 |
| Alpha Counter | 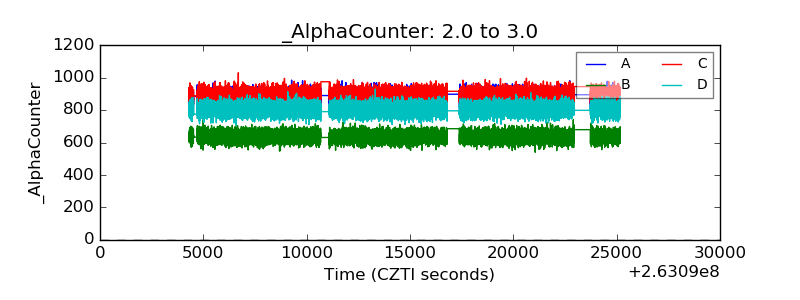 |
| _CPM_Rate |  |
| CZT Counter | 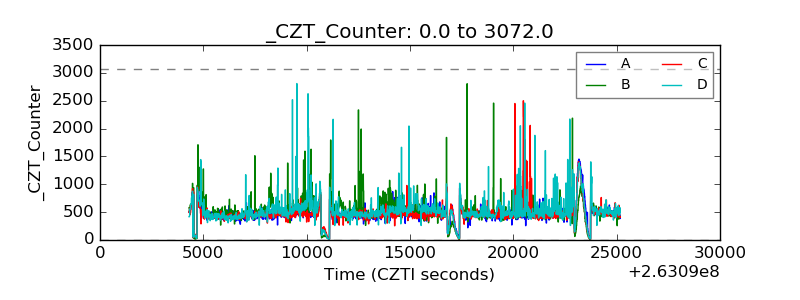 |
| +2.5 Volts monitor |  |
| +5 Volts monitor |  |
| _ROLL_ROT | 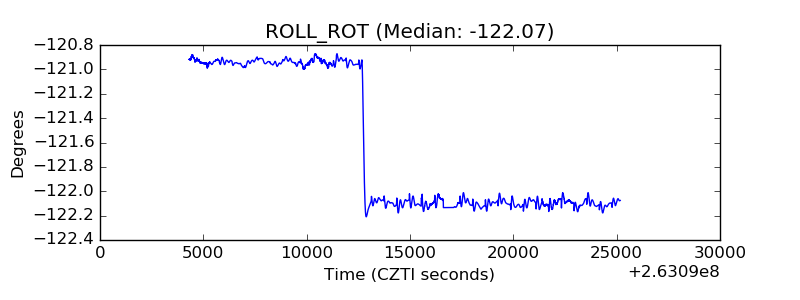 |
| _Roll_DEC | 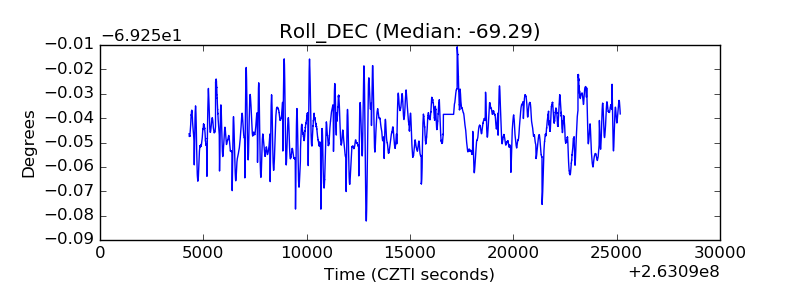 |
| _Roll_RA | 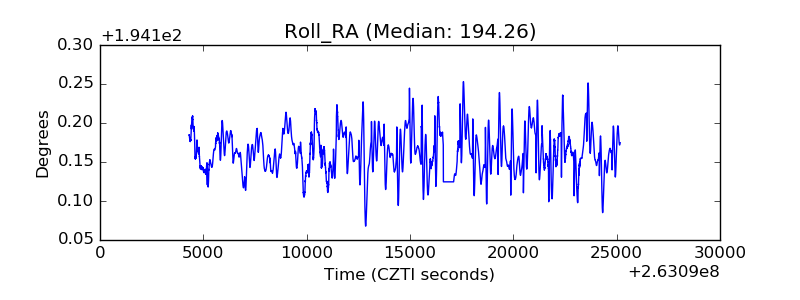 |
| Veto Counter | 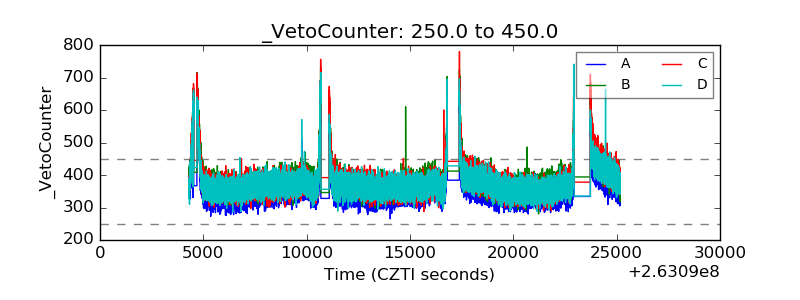 |