| Param | Original file | Final file |
|---|---|---|
| Filename | modeM0/AS1A04_162T01_9000002074_14049cztM0_level2.evt | modeM0/AS1A04_162T01_9000002074_14049cztM0_level2_quad_clean.evt |
| Size (bytes) | 486,884,160 | 125,441,280 |
| Size | 464.3 MB | 119.6 MB |
| Events in quadrant A | 3,241,578 | 846,497 |
| Events in quadrant B | 3,527,286 | 859,300 |
| Events in quadrant C | 3,149,495 | 837,642 |
| Events in quadrant D | 4,375,032 | 791,811 |
| Mode M0 | |||
|---|---|---|---|
| Quadrant | BADHDUFLAG | Total packets | Discarded packets |
| A | 0 | 13842 | 3 |
| B | 0 | 14626 | 2 |
| C | 0 | 13624 | 2 |
| D | 0 | 17208 | 2 |
| Mode M9 | |||
|---|---|---|---|
| Quadrant | BADHDUFLAG | Total packets | Discarded packets |
| A | 0 | 10 | 0 |
| B | 0 | 10 | 0 |
| C | 0 | 10 | 0 |
| D | 0 | 10 | 0 |
| Mode SS | |||
|---|---|---|---|
| Quadrant | BADHDUFLAG | Total packets | Discarded packets |
| A | 0 | 134 | 0 |
| B | 0 | 134 | 0 |
| C | 0 | 134 | 0 |
| D | 0 | 134 | 0 |
| Quadrant | Total seconds | Saturated seconds | Saturation percentage |
|---|---|---|---|
| A | 6662 | 66 | 0.990693% |
| B | 6662 | 107 | 1.606124% |
| C | 6662 | 59 | 0.885620% |
| D | 6662 | 192 | 2.882017% |
Noise dominated data is calculated using 1-second bins in cleaned event files. If a bin has >2000 counts, and if more than 50% of those come from <1% of pixels, then it is considered to be noise-dominated and hence unusable.
| Quadrant | # 1 sec bins | Bins with >0 counts | Bins with >2000 counts | High rate bins dominated by noise | Noise dominated (total time) | Noise dominated (detector-on time) | Marked lightcurve |
|---|---|---|---|---|---|---|---|
| A | 7583 | 6664 | 0 | 0 | 0.00% | 0.00% | 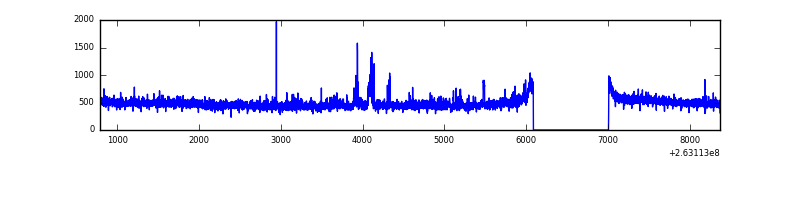 |
| B | 7583 | 6664 | 15 | 15 | 0.20% | 0.23% | 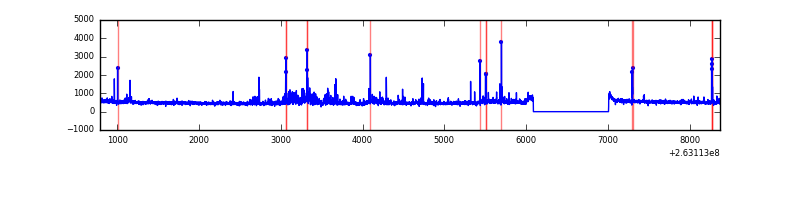 |
| C | 7583 | 6664 | 0 | 0 | 0.00% | 0.00% | 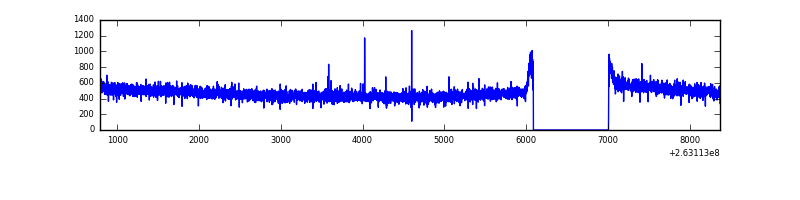 |
| D | 7583 | 6664 | 127 | 127 | 1.67% | 1.91% | 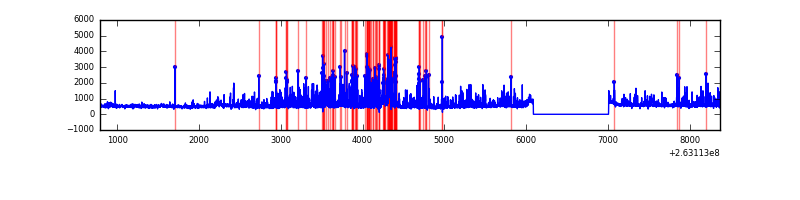 |
Top three noisy pixels from each quadrant. If the there are fewer than three noisy pixels in the level2.evt file, extra rows are filled as -1
| Pixel properties | Quadrant properties | ||||||
|---|---|---|---|---|---|---|---|
| Quadrant | DetID | PixID | Counts | Sigma | Mean | Median | Sigma |
| A | 12 | 189 | 88472 | 546.31 | 797 | 779 | 160.5 |
| A | 15 | 69 | 28798 | 174.55 | 797 | 779 | 160.5 |
| A | 8 | 15 | 28469 | 172.5 | 797 | 779 | 160.5 |
| B | 0 | 189 | 151814 | 1007.13 | 793 | 773 | 150.0 |
| B | 0 | 219 | 96502 | 638.31 | 793 | 773 | 150.0 |
| B | 3 | 209 | 41917 | 274.34 | 793 | 773 | 150.0 |
| C | 3 | 233 | 117386 | 654.72 | 775 | 777 | 178.1 |
| C | 0 | 207 | 7108 | 35.55 | 775 | 777 | 178.1 |
| C | 13 | 61 | 5443 | 26.2 | 775 | 777 | 178.1 |
| D | 1 | 52 | 850212 | 4516.89 | 772 | 749 | 188.1 |
| D | 8 | 195 | 235182 | 1246.56 | 772 | 749 | 188.1 |
| D | 13 | 122 | 139896 | 739.89 | 772 | 749 | 188.1 |
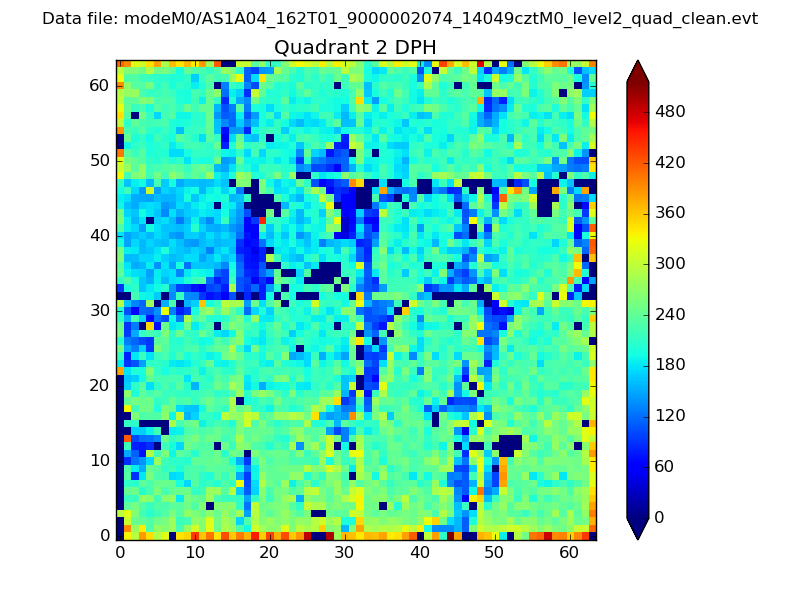
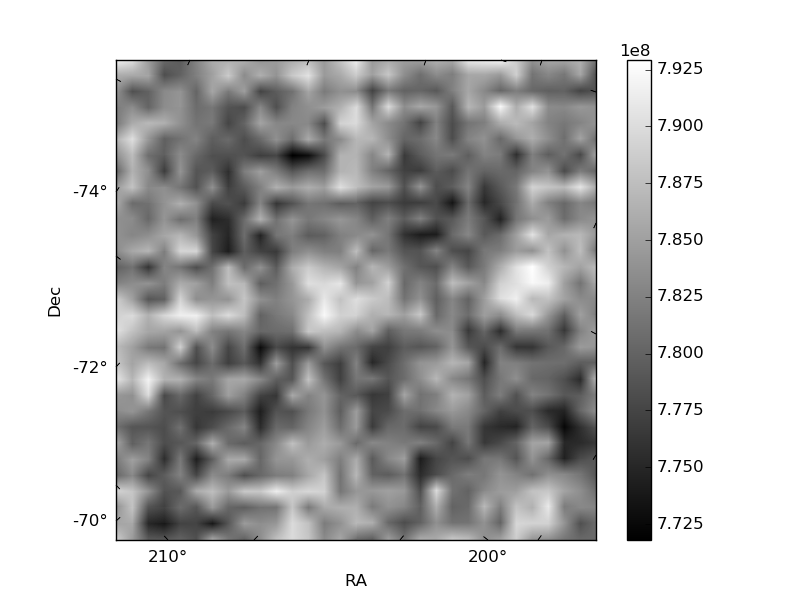
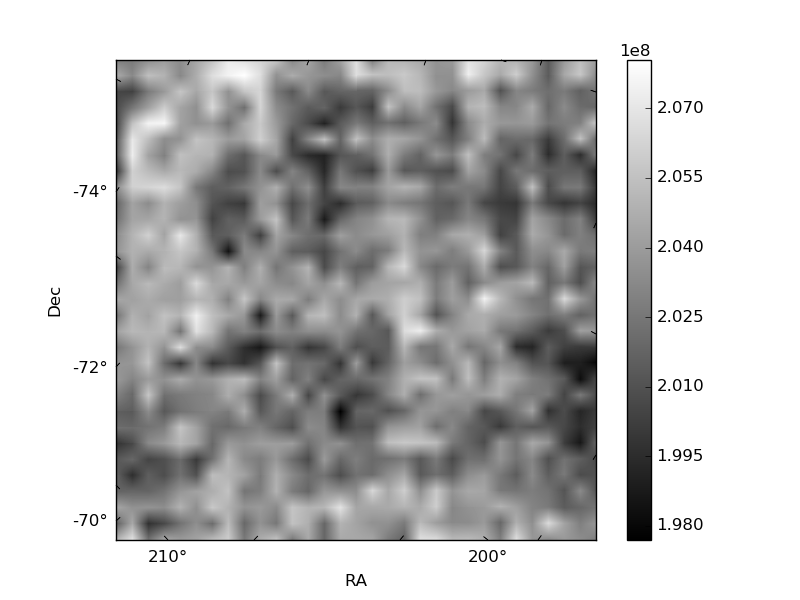
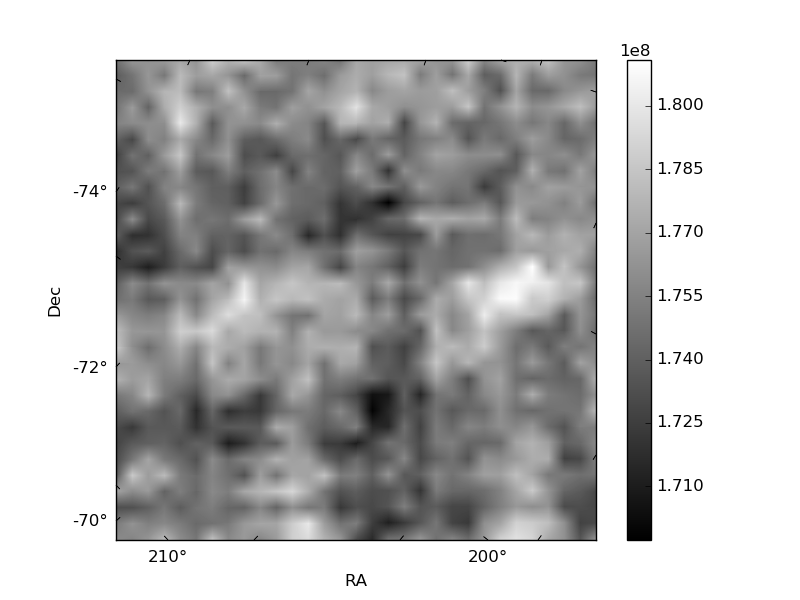
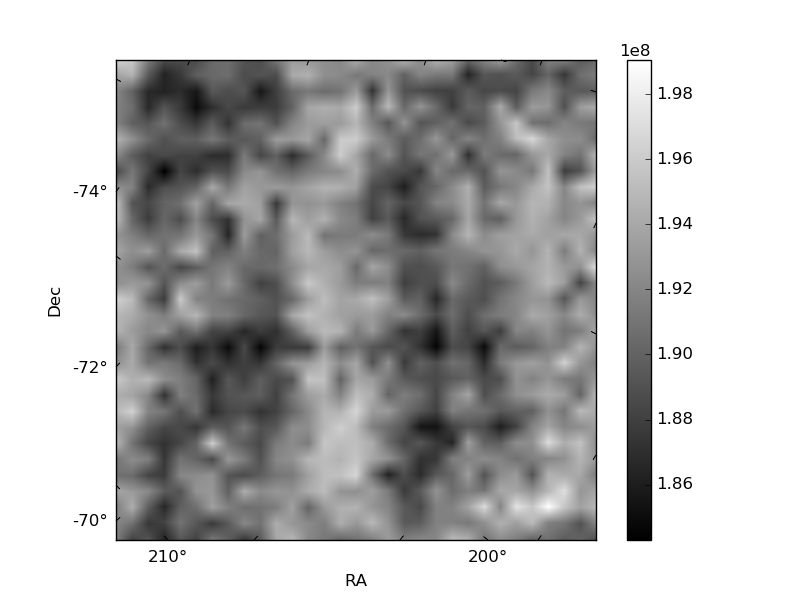
Histogram calculated using DETX and DETY for each event in the final _common_clean file
| Quadrant A | 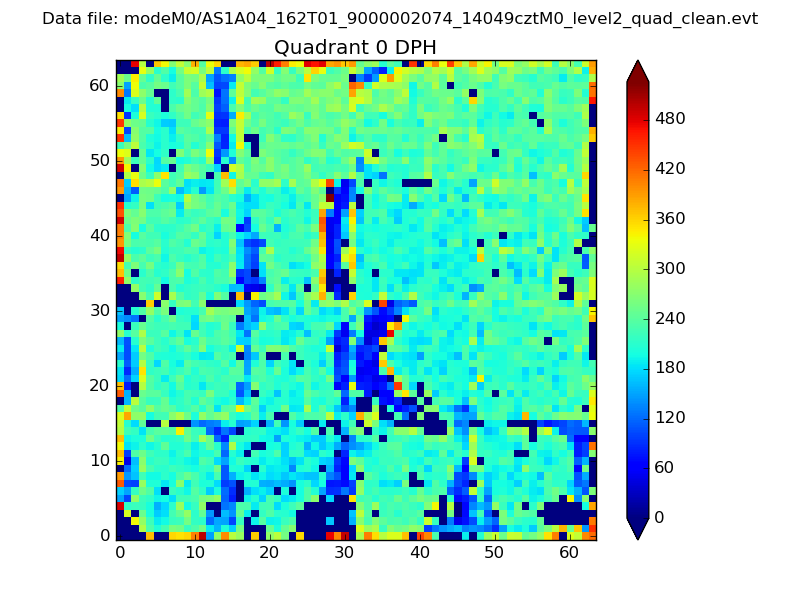 |
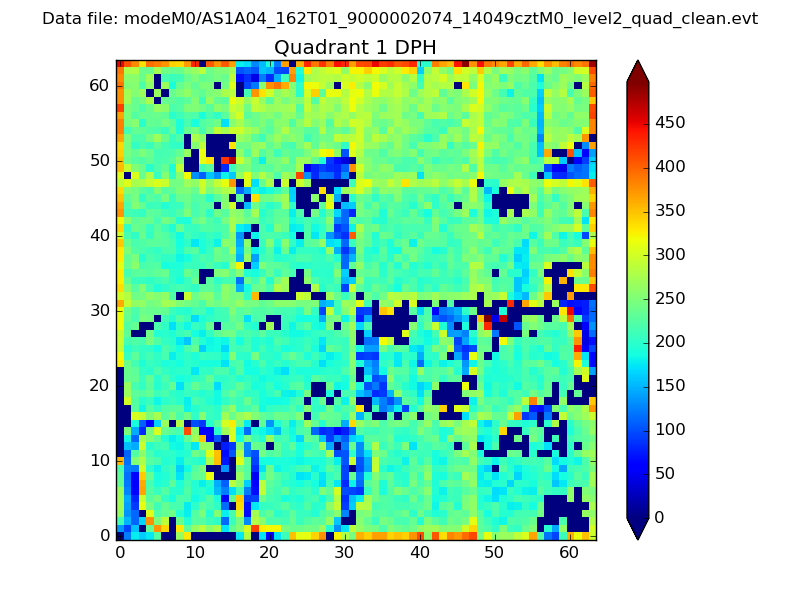 |
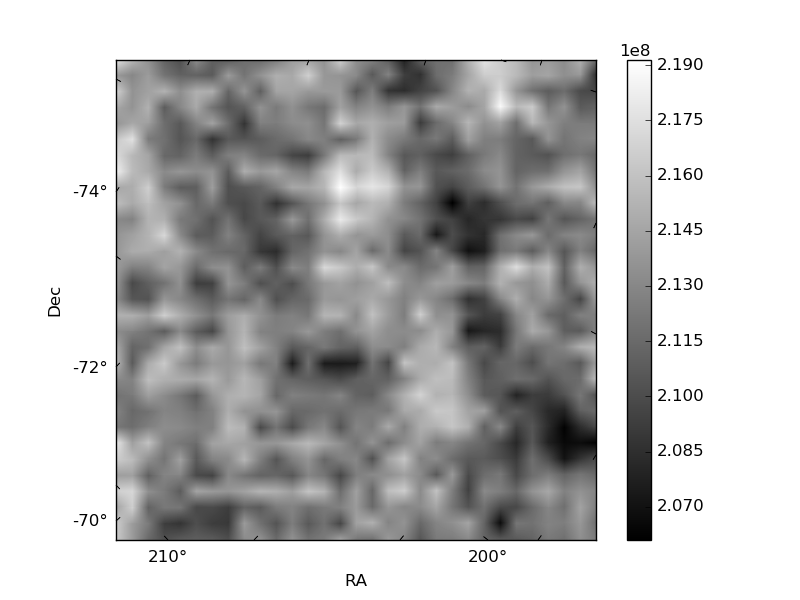
Quadrant B |
|---|---|---|---|
| Quadrant D | 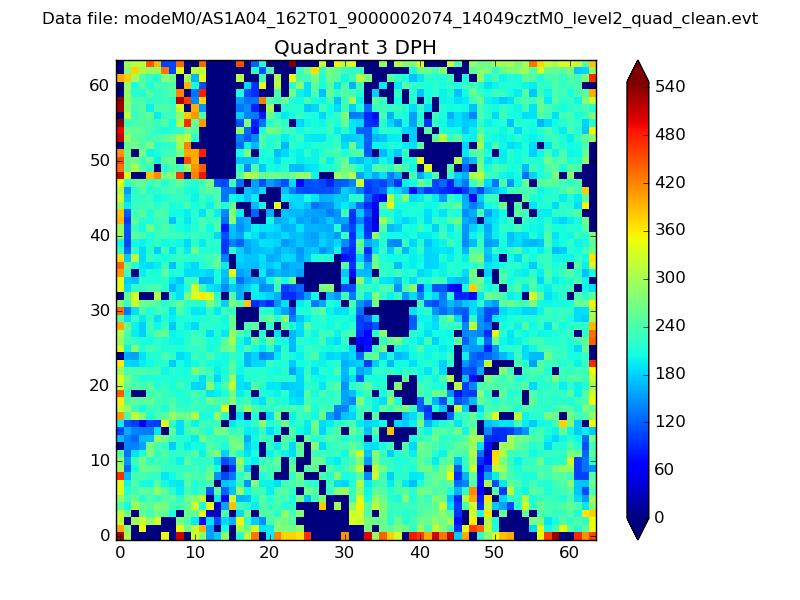 |
 |
Quadrant C |
| Plot type | Count rate plots | Images |
|---|---|---|
| Comparison with Poisson distribution Blue bars denote a histogram of data divided into 1 sec bins. Red curve is a Poisson curve with rate = median count rate of data. |
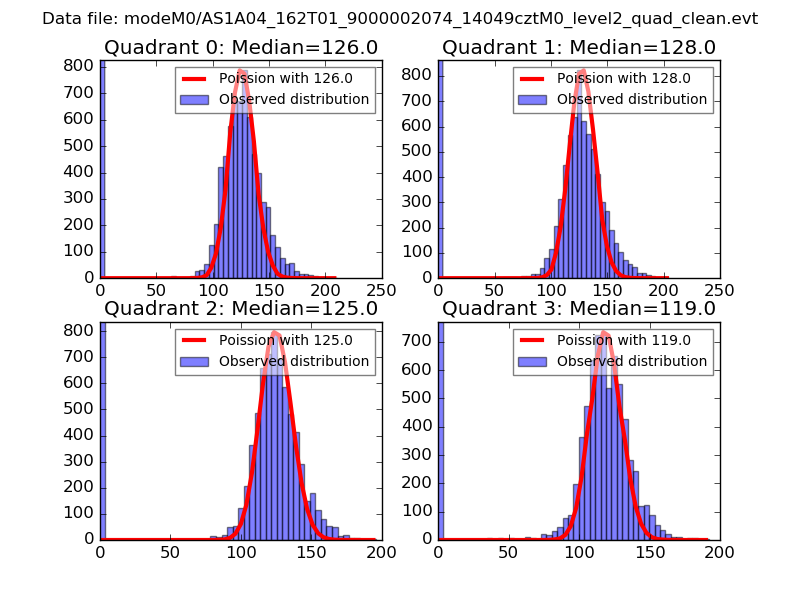 |
 |
| Quadrant-wise count rates Data is divided into 100 sec bins |
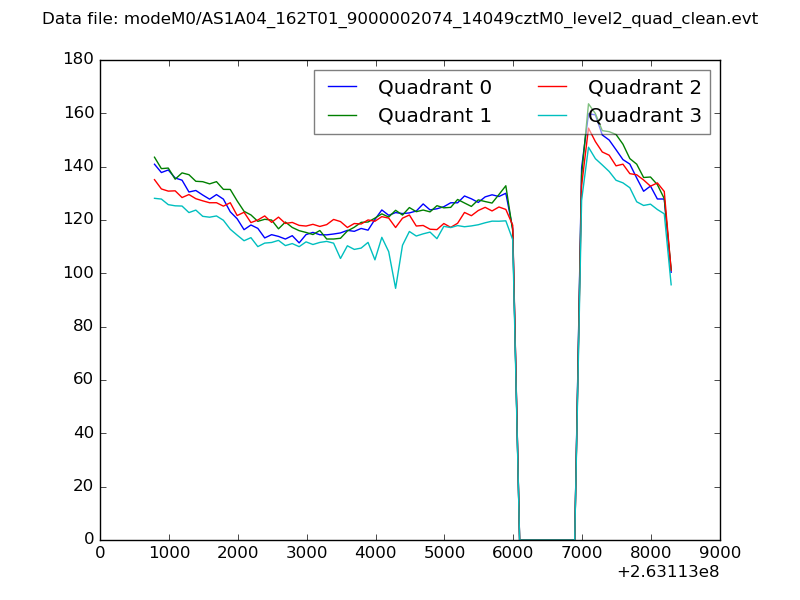 |
|
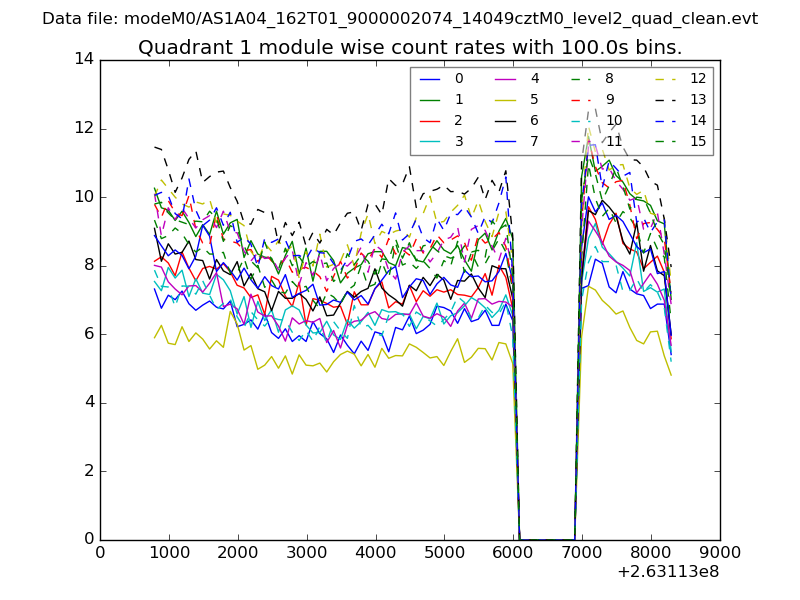
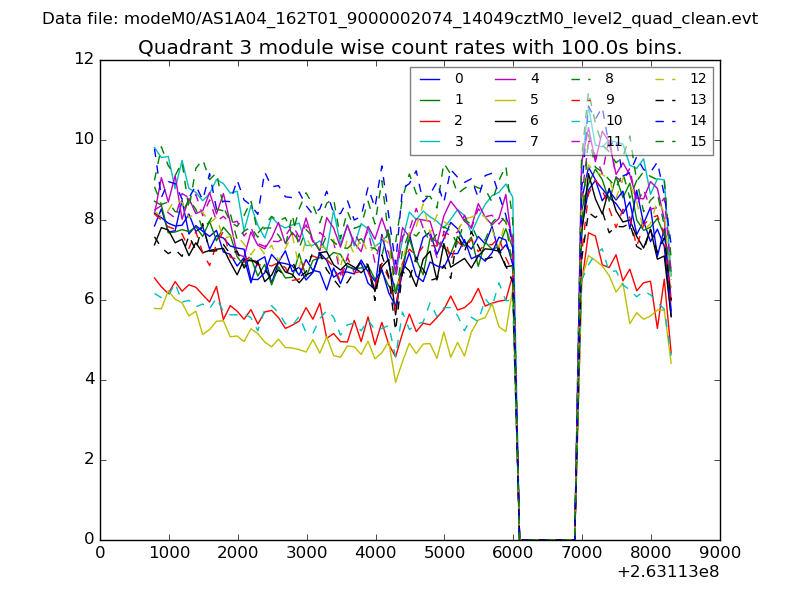
| Module-wise count rates for Quadrant A Data is divided into 100 sec bins |
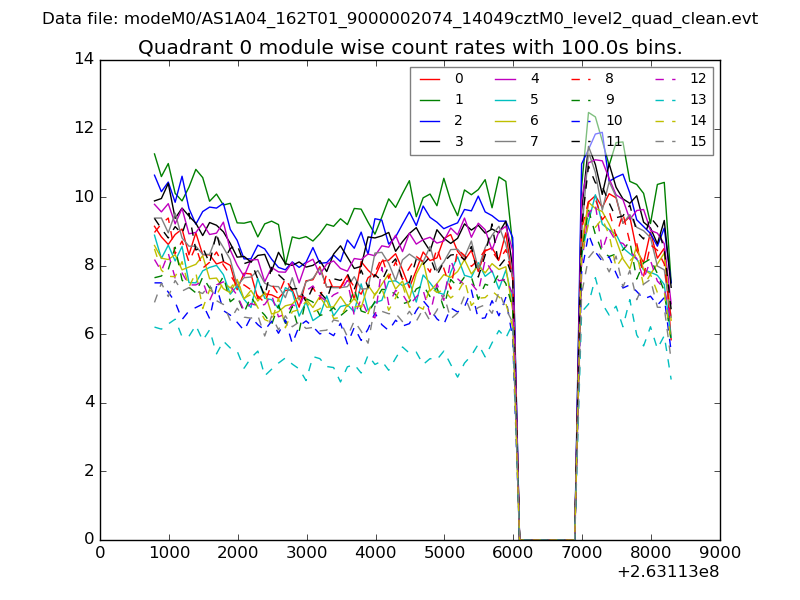 |
 |
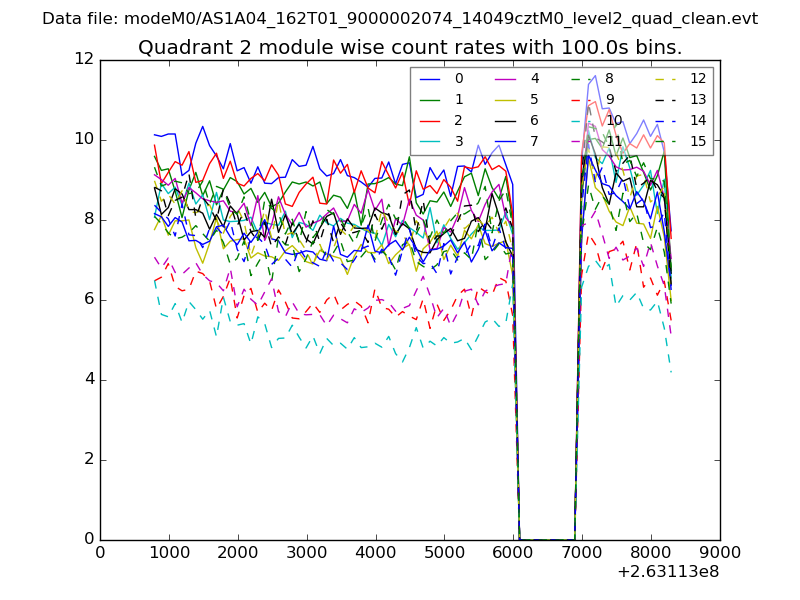
| Module-wise count rates for Quadrant B Data is divided into 100 sec bins |
 |
 |
| Module-wise count rates for Quadrant C Data is divided into 100 sec bins |
 |
 |
| Module-wise count rates for Quadrant D Data is divided into 100 sec bins |
 |
 |
| Parameter | Plot |
|---|---|
| CZT HV Monitor | 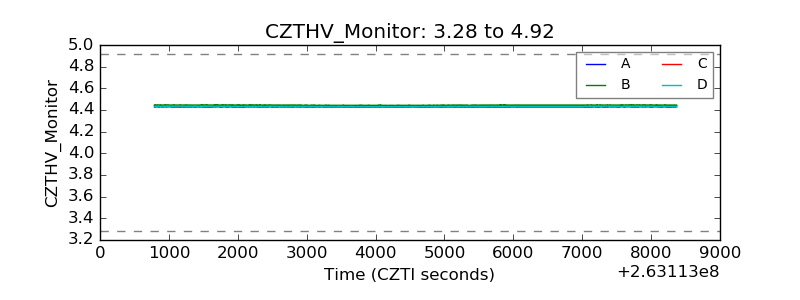 |
| D_VDD | 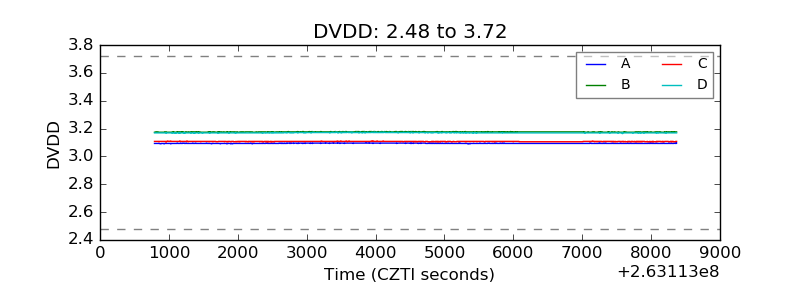 |
| Temperature 1 | 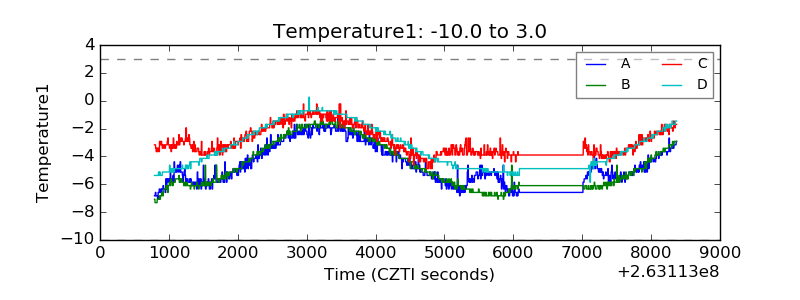 |
| Veto HV Monitor |  |
| Veto LLD | 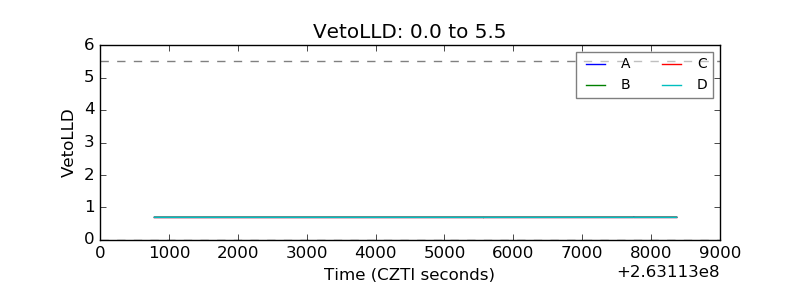 |
| Alpha Counter | 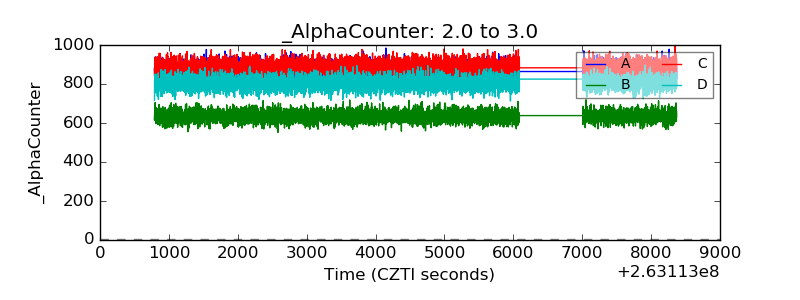 |
| _CPM_Rate | 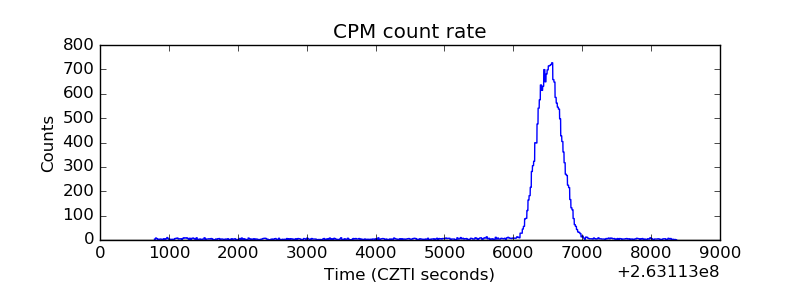 |
| CZT Counter | 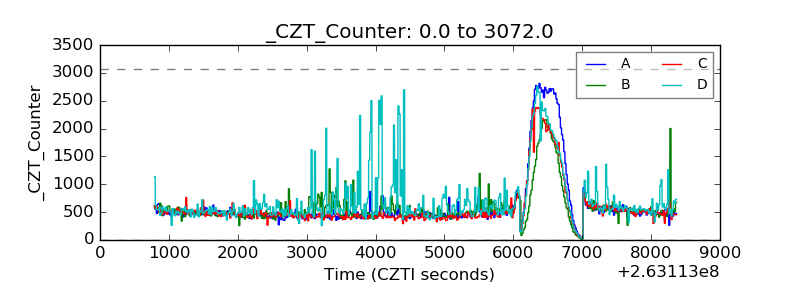 |
| +2.5 Volts monitor |  |
| +5 Volts monitor |  |
| _ROLL_ROT | 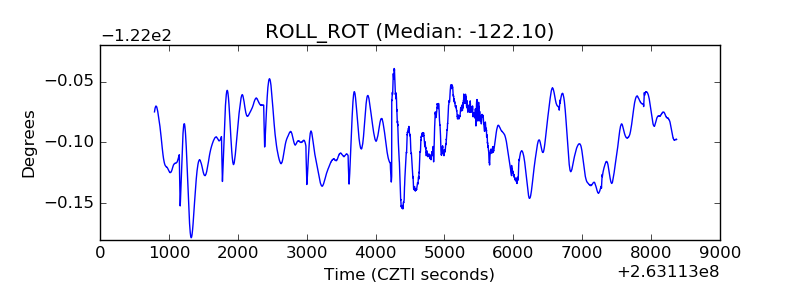 |
| _Roll_DEC | 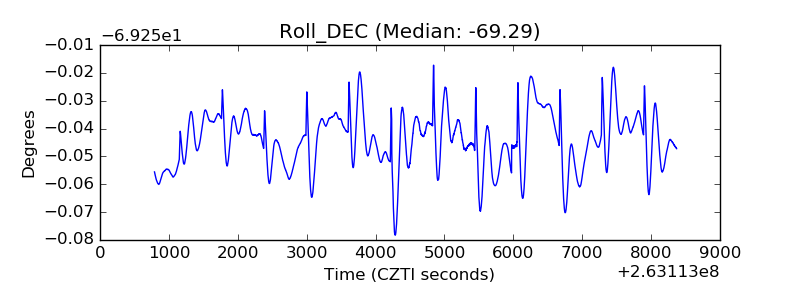 |
| _Roll_RA | 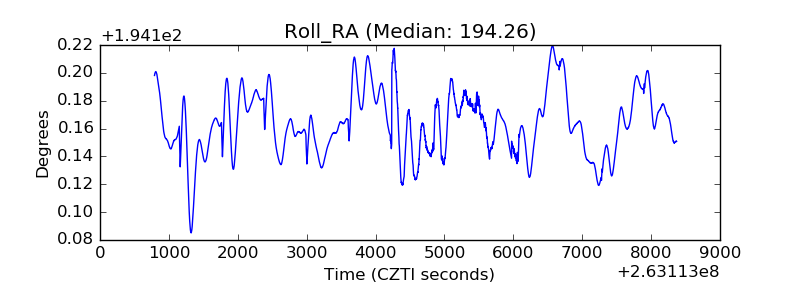 |
| Veto Counter | 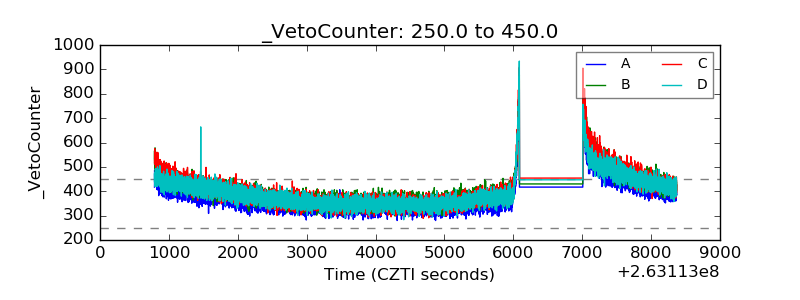 |