| Param | Original file | Final file |
|---|---|---|
| Filename | modeM0/AS1A04_162T01_9000002074_14053cztM0_level2.evt | modeM0/AS1A04_162T01_9000002074_14053cztM0_level2_quad_clean.evt |
| Size (bytes) | 430,989,120 | 119,796,480 |
| Size | 411.0 MB | 114.2 MB |
| Events in quadrant A | 2,828,208 | 833,225 |
| Events in quadrant B | 3,184,677 | 834,442 |
| Events in quadrant C | 2,868,580 | 800,848 |
| Events in quadrant D | 3,790,803 | 768,355 |
| Mode M0 | |||
|---|---|---|---|
| Quadrant | BADHDUFLAG | Total packets | Discarded packets |
| A | 0 | 11949 | 2 |
| B | 0 | 13128 | 1 |
| C | 0 | 12206 | 1 |
| D | 0 | 15036 | 1 |
| Mode M9 | |||
|---|---|---|---|
| Quadrant | BADHDUFLAG | Total packets | Discarded packets |
| A | 0 | 13 | 0 |
| B | 0 | 13 | 0 |
| C | 0 | 13 | 0 |
| D | 0 | 13 | 0 |
| Mode SS | |||
|---|---|---|---|
| Quadrant | BADHDUFLAG | Total packets | Discarded packets |
| A | 0 | 114 | 0 |
| B | 0 | 114 | 0 |
| C | 0 | 114 | 0 |
| D | 0 | 114 | 0 |
| Quadrant | Total seconds | Saturated seconds | Saturation percentage |
|---|---|---|---|
| A | 5595 | 71 | 1.268990% |
| B | 5595 | 137 | 2.448615% |
| C | 5595 | 64 | 1.143878% |
| D | 5595 | 183 | 3.270777% |
Noise dominated data is calculated using 1-second bins in cleaned event files. If a bin has >2000 counts, and if more than 50% of those come from <1% of pixels, then it is considered to be noise-dominated and hence unusable.
| Quadrant | # 1 sec bins | Bins with >0 counts | Bins with >2000 counts | High rate bins dominated by noise | Noise dominated (total time) | Noise dominated (detector-on time) | Marked lightcurve |
|---|---|---|---|---|---|---|---|
| A | 6901 | 5597 | 0 | 0 | 0.00% | 0.00% | 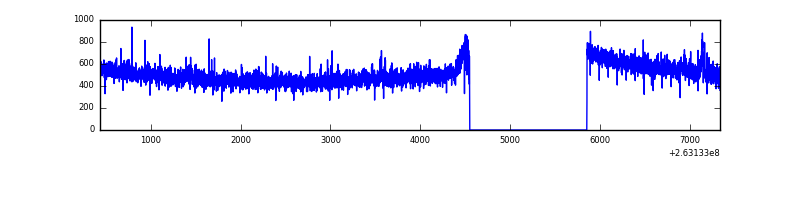 |
| B | 6901 | 5597 | 47 | 47 | 0.68% | 0.84% | 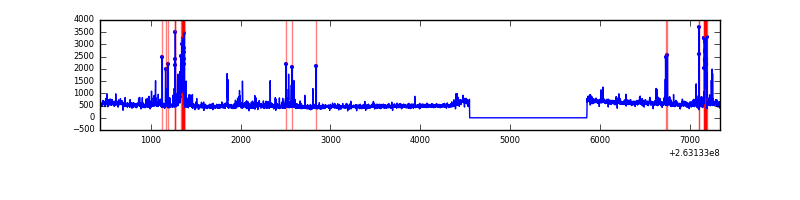 |
| C | 6901 | 5597 | 0 | 0 | 0.00% | 0.00% | 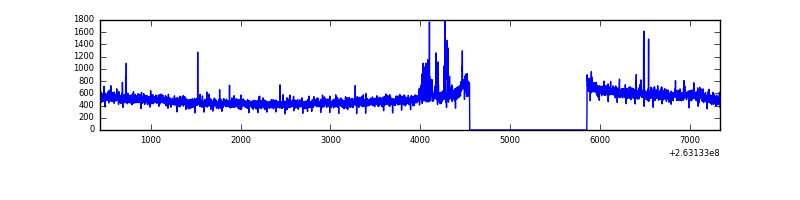 |
| D | 6901 | 5597 | 95 | 95 | 1.38% | 1.70% | 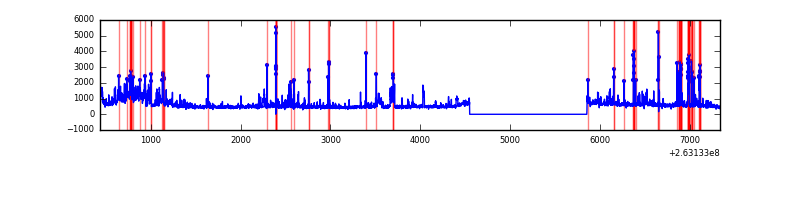 |
Top three noisy pixels from each quadrant. If the there are fewer than three noisy pixels in the level2.evt file, extra rows are filled as -1
| Pixel properties | Quadrant properties | ||||||
|---|---|---|---|---|---|---|---|
| Quadrant | DetID | PixID | Counts | Sigma | Mean | Median | Sigma |
| A | 8 | 15 | 45985 | 313.9 | 716 | 704 | 144.3 |
| A | 12 | 189 | 22113 | 148.41 | 716 | 704 | 144.3 |
| A | 2 | 79 | 7973 | 50.39 | 716 | 704 | 144.3 |
| B | 0 | 189 | 183858 | 1386.77 | 710 | 694 | 132.1 |
| B | 10 | 245 | 86005 | 645.91 | 710 | 694 | 132.1 |
| B | 3 | 209 | 50906 | 380.17 | 710 | 694 | 132.1 |
| C | 3 | 233 | 219256 | 1428.78 | 675 | 678 | 153.0 |
| C | 0 | 207 | 16487 | 103.34 | 675 | 678 | 153.0 |
| C | 13 | 61 | 4934 | 27.82 | 675 | 678 | 153.0 |
| D | 1 | 52 | 338826 | 1932.83 | 670 | 654 | 175.0 |
| D | 10 | 172 | 278241 | 1586.55 | 670 | 654 | 175.0 |
| D | 15 | 0 | 193427 | 1101.8 | 670 | 654 | 175.0 |
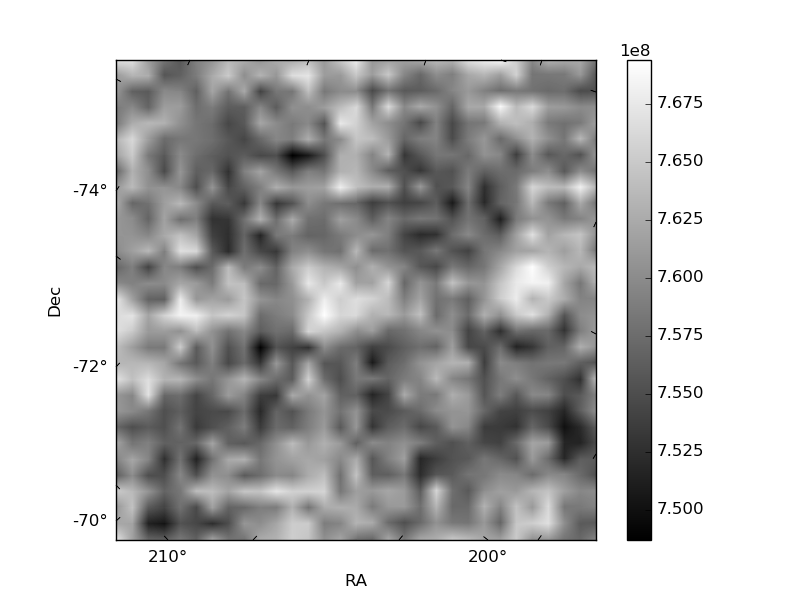
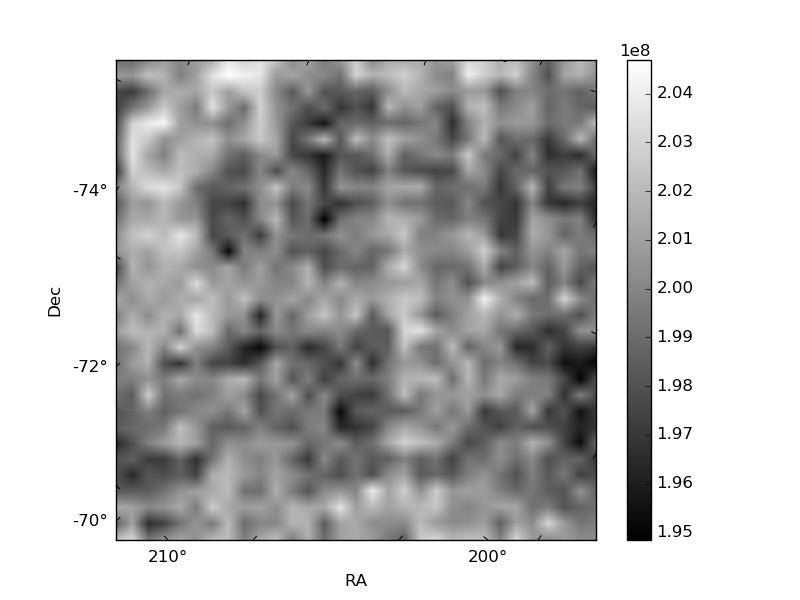
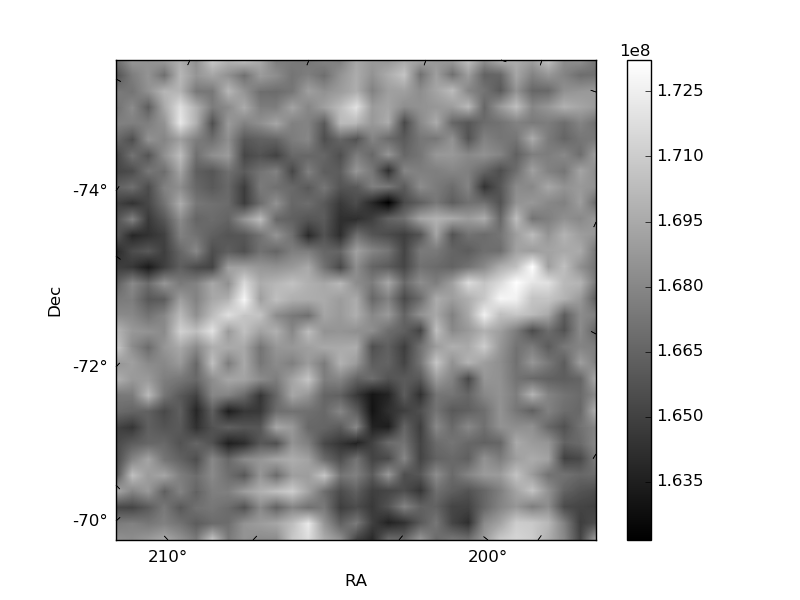
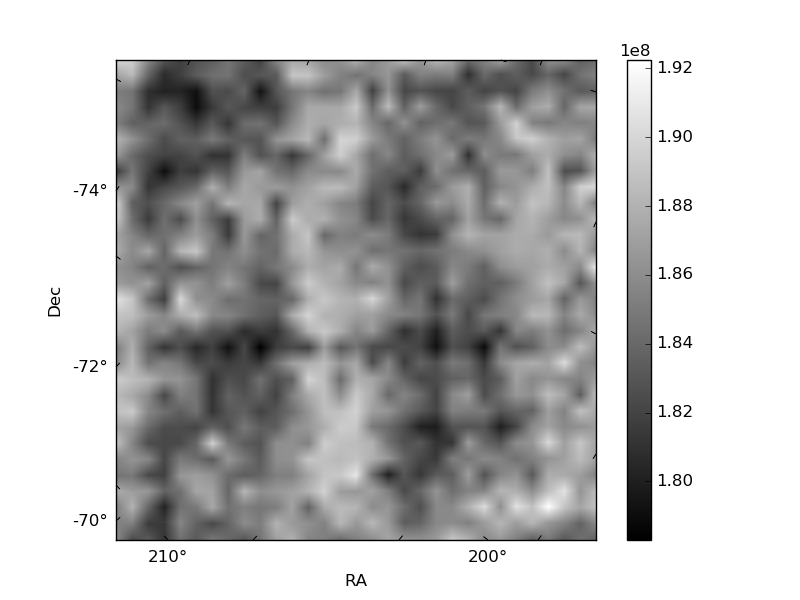
Histogram calculated using DETX and DETY for each event in the final _common_clean file
| Quadrant A | 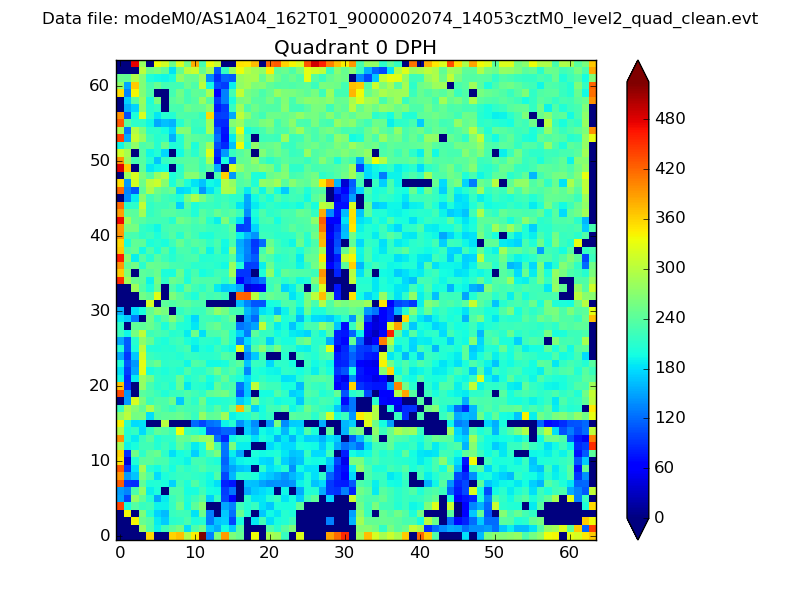 |
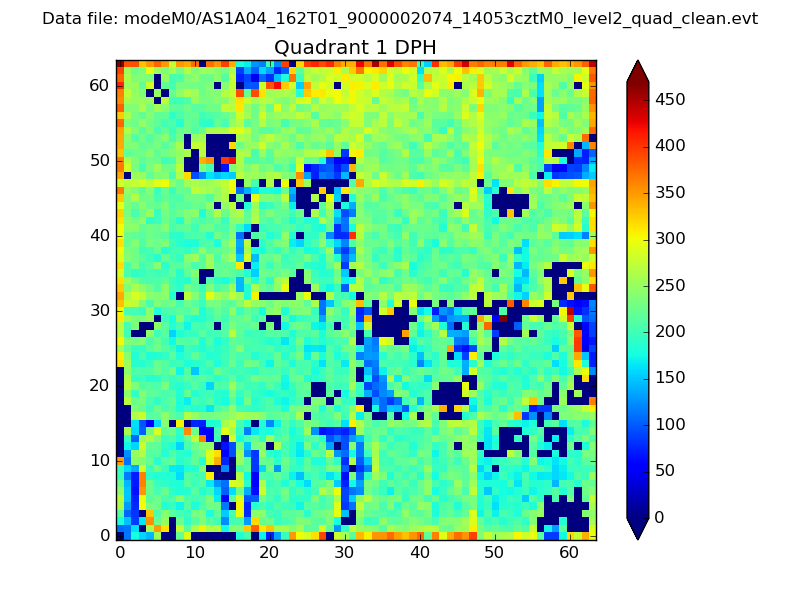 |
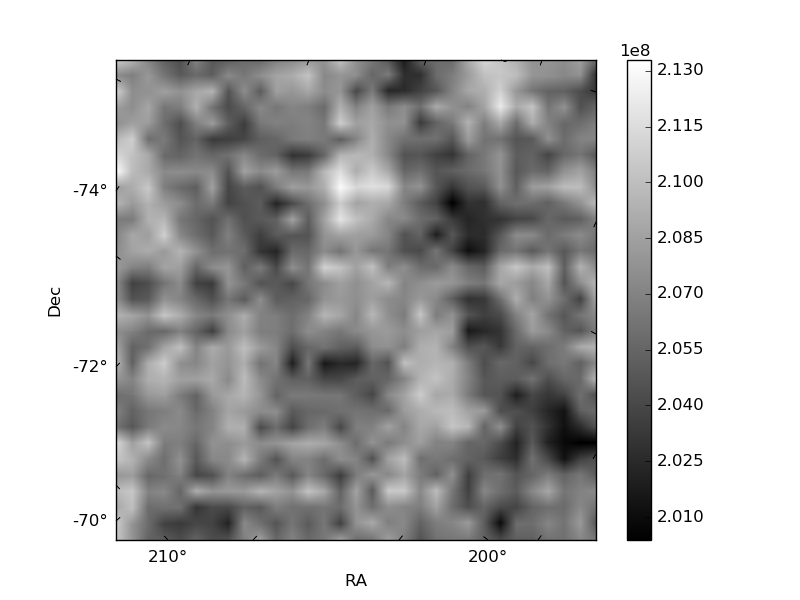
Quadrant B |
|---|---|---|---|
| Quadrant D | 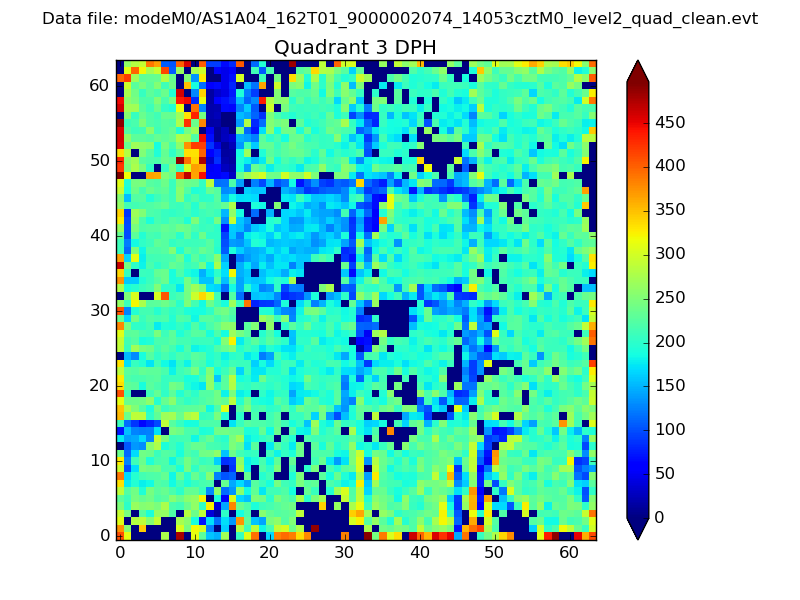 |
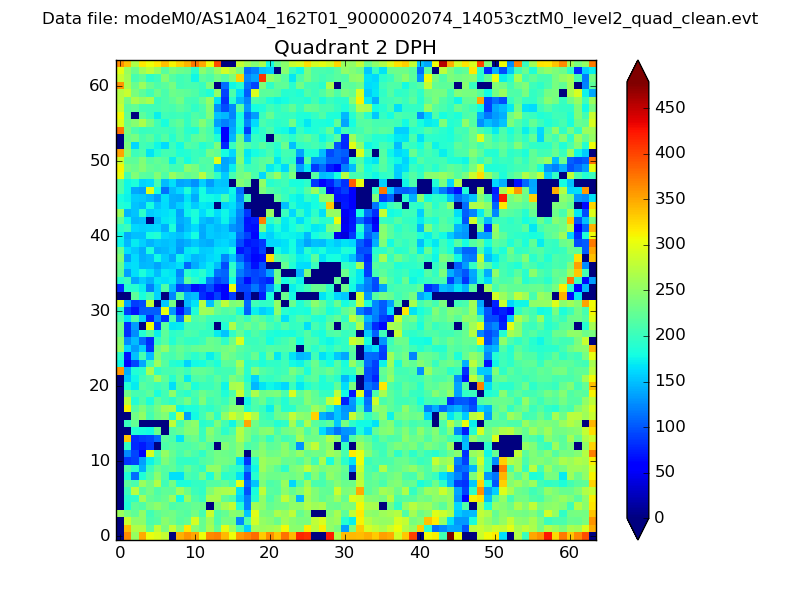 |
Quadrant C |
| Plot type | Count rate plots | Images |
|---|---|---|
| Comparison with Poisson distribution Blue bars denote a histogram of data divided into 1 sec bins. Red curve is a Poisson curve with rate = median count rate of data. |
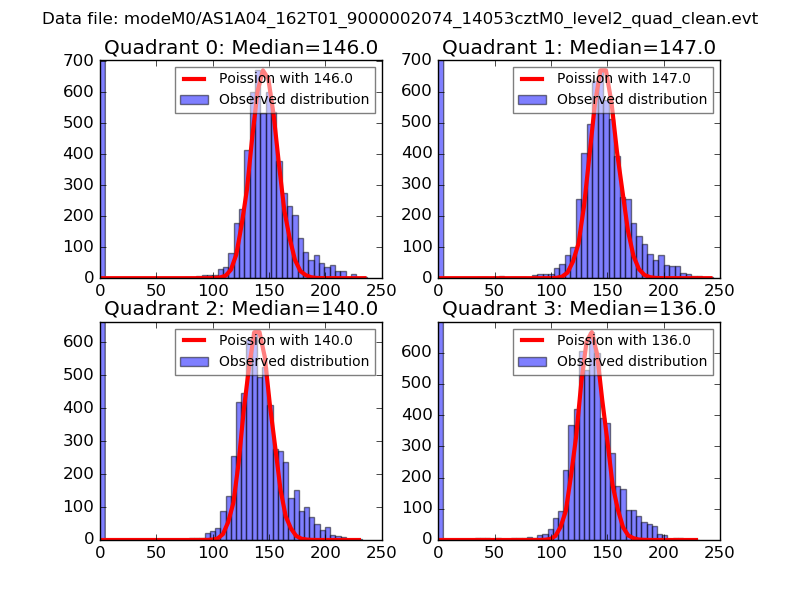 |
 |
| Quadrant-wise count rates Data is divided into 100 sec bins |
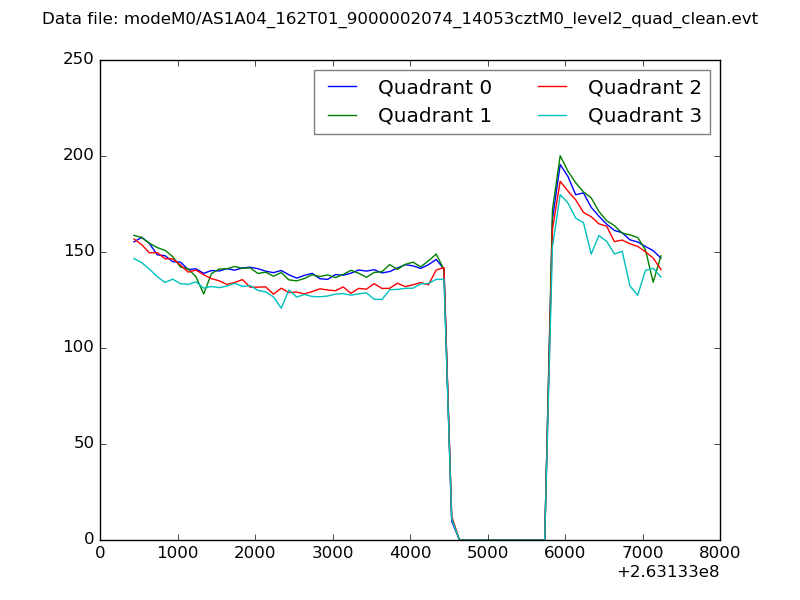 |
|
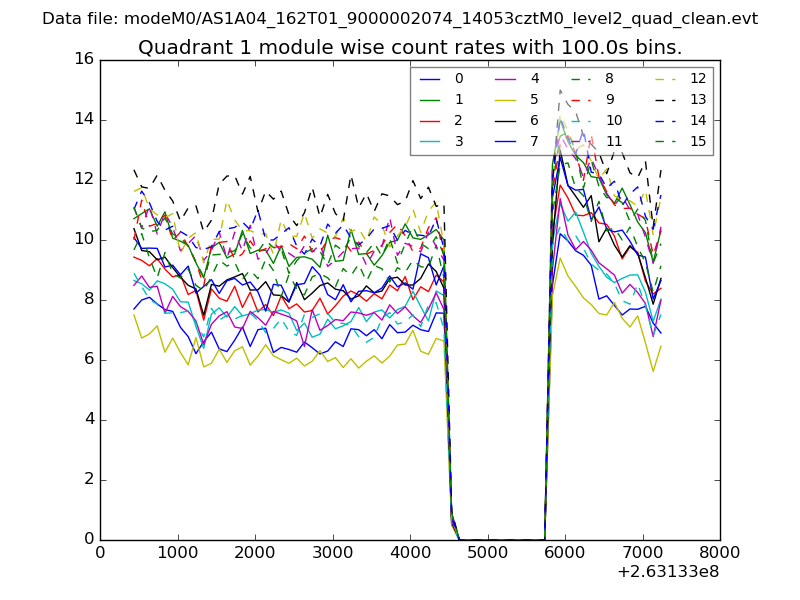
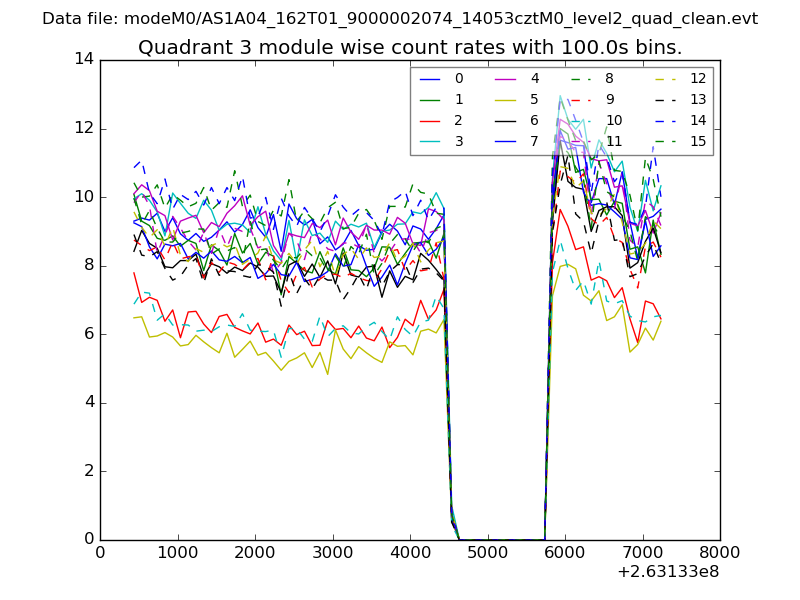
| Module-wise count rates for Quadrant A Data is divided into 100 sec bins |
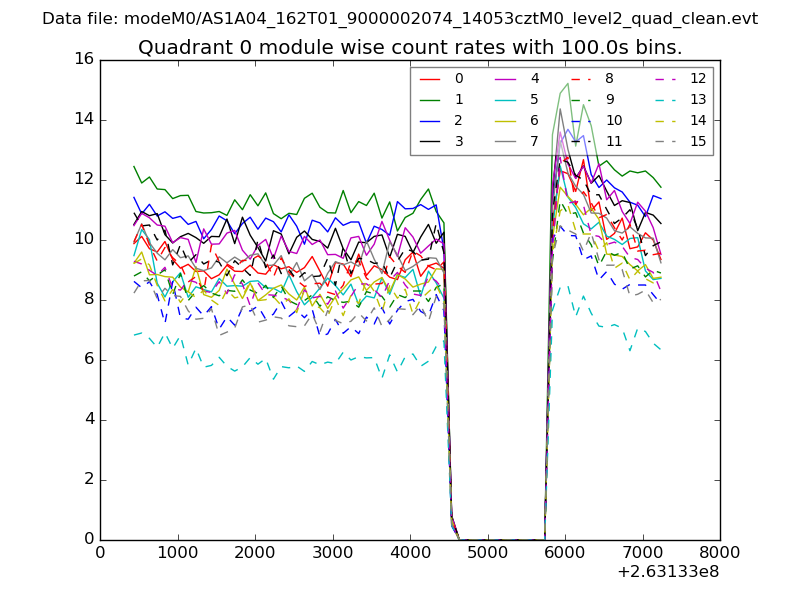 |
 |
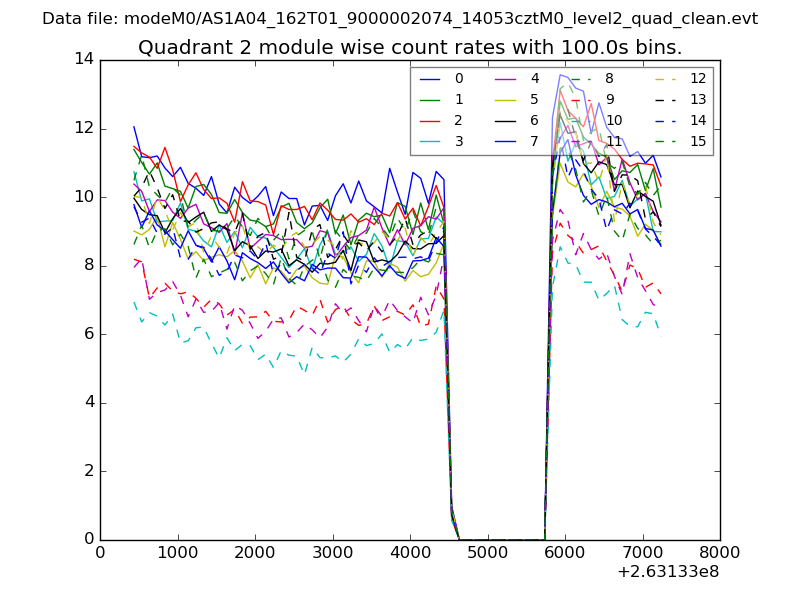
| Module-wise count rates for Quadrant B Data is divided into 100 sec bins |
 |
 |
| Module-wise count rates for Quadrant C Data is divided into 100 sec bins |
 |
 |
| Module-wise count rates for Quadrant D Data is divided into 100 sec bins |
 |
 |
| Parameter | Plot |
|---|---|
| CZT HV Monitor | 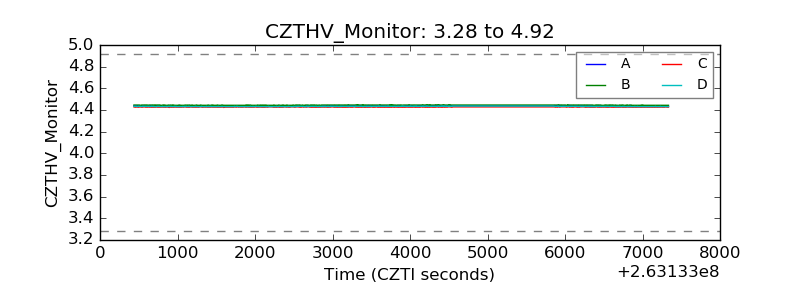 |
| D_VDD | 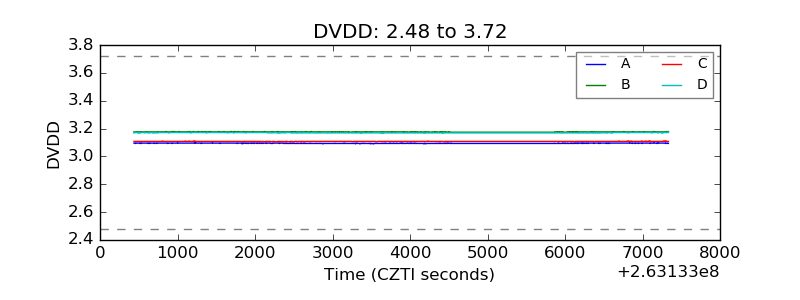 |
| Temperature 1 | 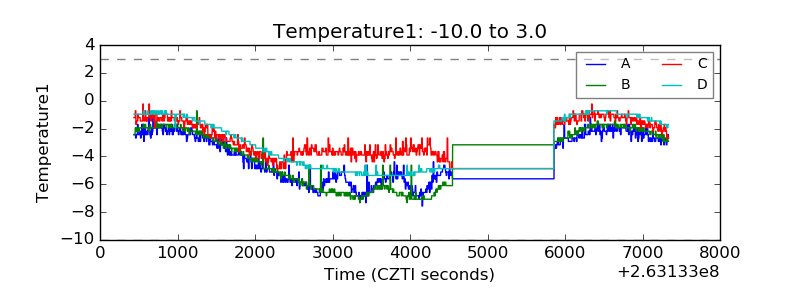 |
| Veto HV Monitor | 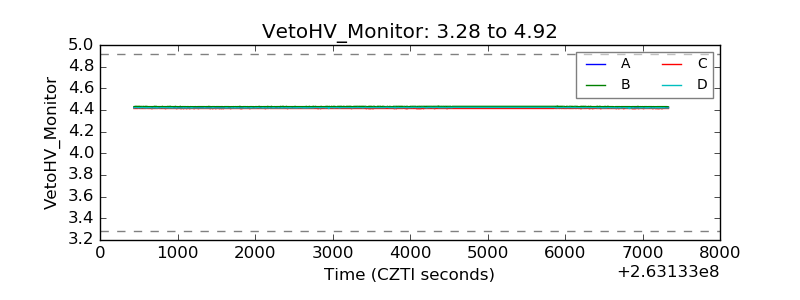 |
| Veto LLD | 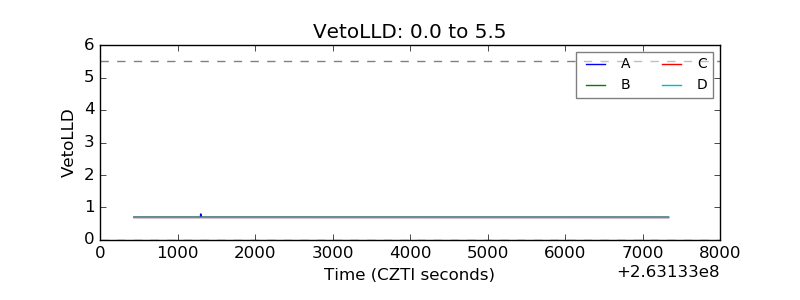 |
| Alpha Counter | 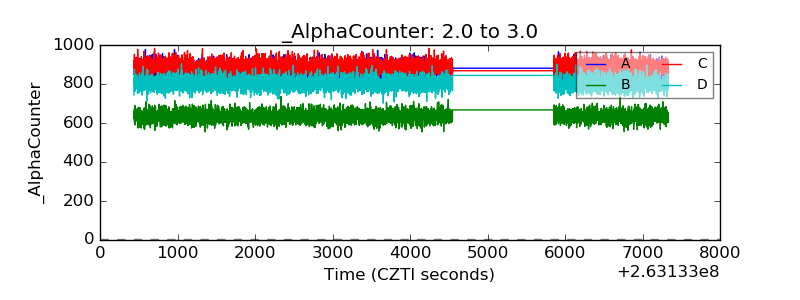 |
| _CPM_Rate | 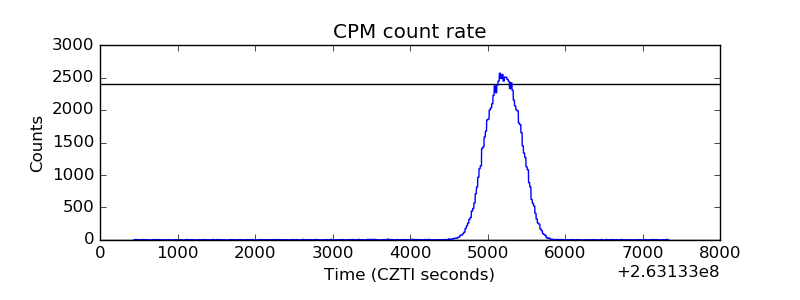 |
| CZT Counter | 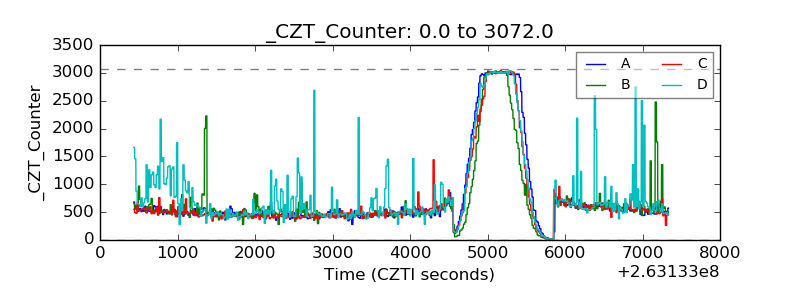 |
| +2.5 Volts monitor | 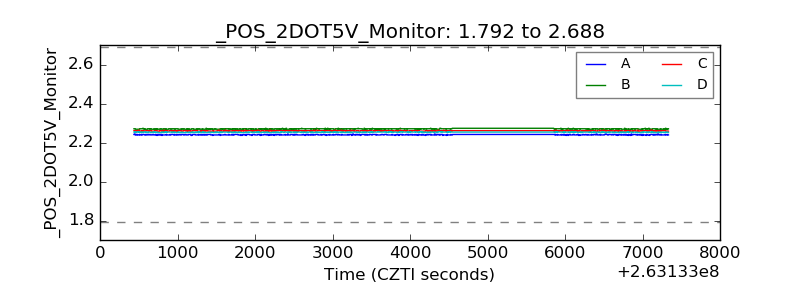 |
| +5 Volts monitor |  |
| _ROLL_ROT | 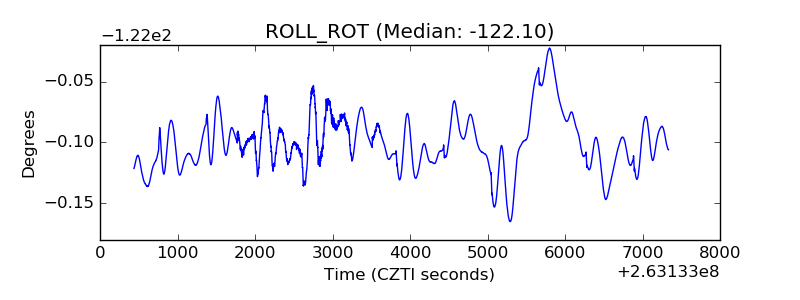 |
| _Roll_DEC | 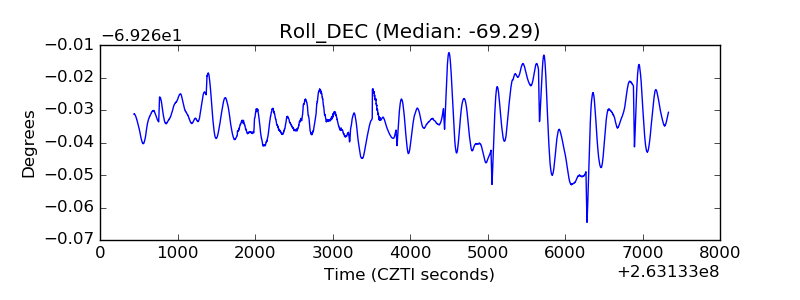 |
| _Roll_RA | 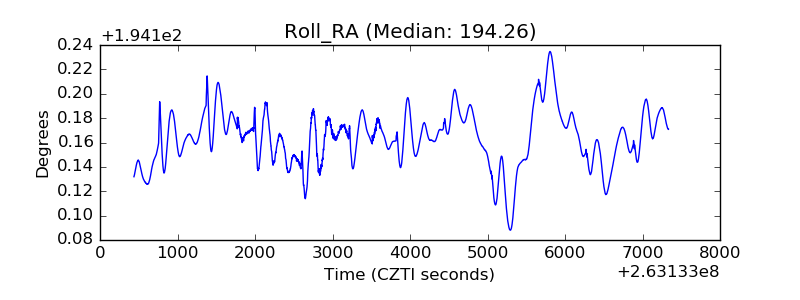 |
| Veto Counter | 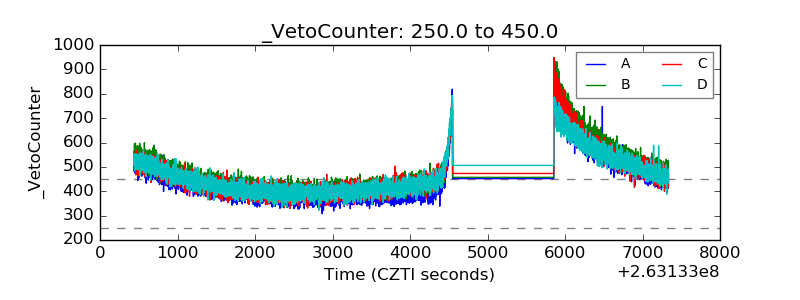 |