| Param | Original file | Final file |
|---|---|---|
| Filename | modeM0/AS1A04_162T01_9000002074_14054cztM0_level2.evt | modeM0/AS1A04_162T01_9000002074_14054cztM0_level2_quad_clean.evt |
| Size (bytes) | 457,032,960 | 134,519,040 |
| Size | 435.9 MB | 128.3 MB |
| Events in quadrant A | 3,213,257 | 939,916 |
| Events in quadrant B | 3,480,710 | 943,420 |
| Events in quadrant C | 3,199,987 | 897,751 |
| Events in quadrant D | 3,527,748 | 862,190 |
| Mode M0 | |||
|---|---|---|---|
| Quadrant | BADHDUFLAG | Total packets | Discarded packets |
| A | 0 | 13492 | 2 |
| B | 0 | 14372 | 1 |
| C | 0 | 13419 | 1 |
| D | 0 | 14716 | 1 |
| Mode M9 | |||
|---|---|---|---|
| Quadrant | BADHDUFLAG | Total packets | Discarded packets |
| A | 0 | 13 | 0 |
| B | 0 | 13 | 0 |
| C | 0 | 13 | 0 |
| D | 0 | 13 | 0 |
| Mode SS | |||
|---|---|---|---|
| Quadrant | BADHDUFLAG | Total packets | Discarded packets |
| A | 0 | 126 | 0 |
| B | 0 | 126 | 0 |
| C | 0 | 126 | 0 |
| D | 0 | 126 | 0 |
| Quadrant | Total seconds | Saturated seconds | Saturation percentage |
|---|---|---|---|
| A | 6174 | 98 | 1.587302% |
| B | 6174 | 144 | 2.332362% |
| C | 6174 | 69 | 1.117590% |
| D | 6174 | 170 | 2.753482% |
Noise dominated data is calculated using 1-second bins in cleaned event files. If a bin has >2000 counts, and if more than 50% of those come from <1% of pixels, then it is considered to be noise-dominated and hence unusable.
| Quadrant | # 1 sec bins | Bins with >0 counts | Bins with >2000 counts | High rate bins dominated by noise | Noise dominated (total time) | Noise dominated (detector-on time) | Marked lightcurve |
|---|---|---|---|---|---|---|---|
| A | 7505 | 6176 | 0 | 0 | 0.00% | 0.00% | 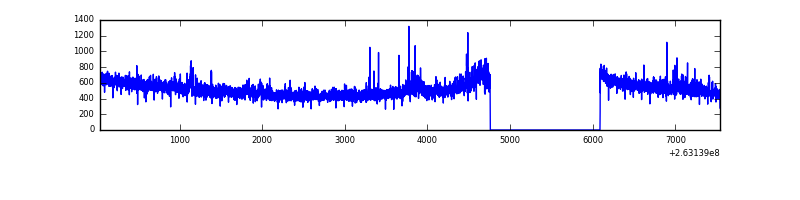 |
| B | 7505 | 6176 | 30 | 30 | 0.40% | 0.49% | 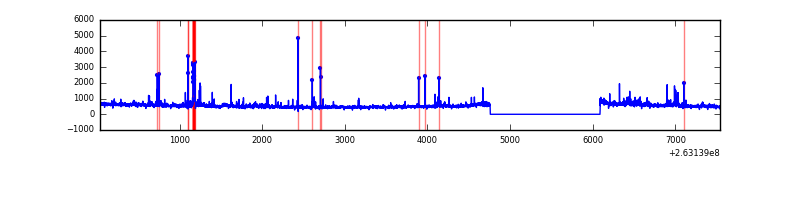 |
| C | 7505 | 6176 | 2 | 2 | 0.03% | 0.03% | 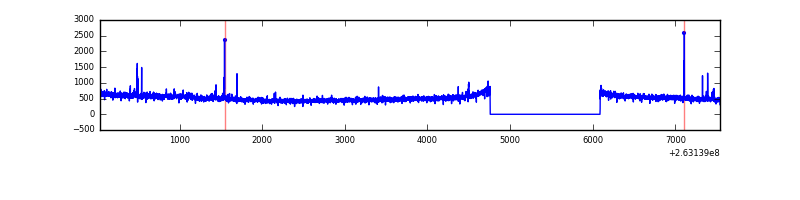 |
| D | 7505 | 6176 | 71 | 71 | 0.95% | 1.15% | 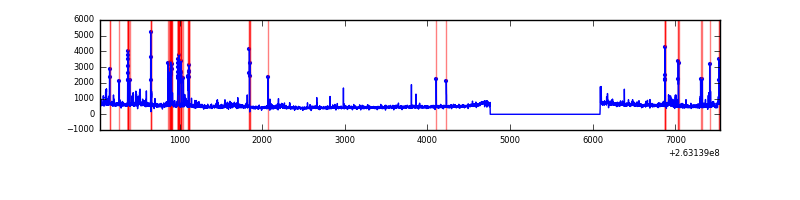 |
Top three noisy pixels from each quadrant. If the there are fewer than three noisy pixels in the level2.evt file, extra rows are filled as -1
| Pixel properties | Quadrant properties | ||||||
|---|---|---|---|---|---|---|---|
| Quadrant | DetID | PixID | Counts | Sigma | Mean | Median | Sigma |
| A | 12 | 189 | 103805 | 632.85 | 806 | 793 | 162.8 |
| A | 8 | 15 | 10530 | 59.82 | 806 | 793 | 162.8 |
| A | 0 | 226 | 7323 | 40.12 | 806 | 793 | 162.8 |
| B | 0 | 189 | 108892 | 732.35 | 798 | 782 | 147.6 |
| B | 10 | 245 | 88746 | 595.88 | 798 | 782 | 147.6 |
| B | 0 | 190 | 31812 | 210.2 | 798 | 782 | 147.6 |
| C | 3 | 233 | 223627 | 1302.51 | 756 | 760 | 171.1 |
| C | 0 | 207 | 27721 | 157.57 | 756 | 760 | 171.1 |
| C | 13 | 61 | 5663 | 28.65 | 756 | 760 | 171.1 |
| D | 10 | 157 | 167674 | 832.83 | 751 | 733 | 200.5 |
| D | 1 | 52 | 154091 | 765.07 | 751 | 733 | 200.5 |
| D | 15 | 0 | 101576 | 503.08 | 751 | 733 | 200.5 |
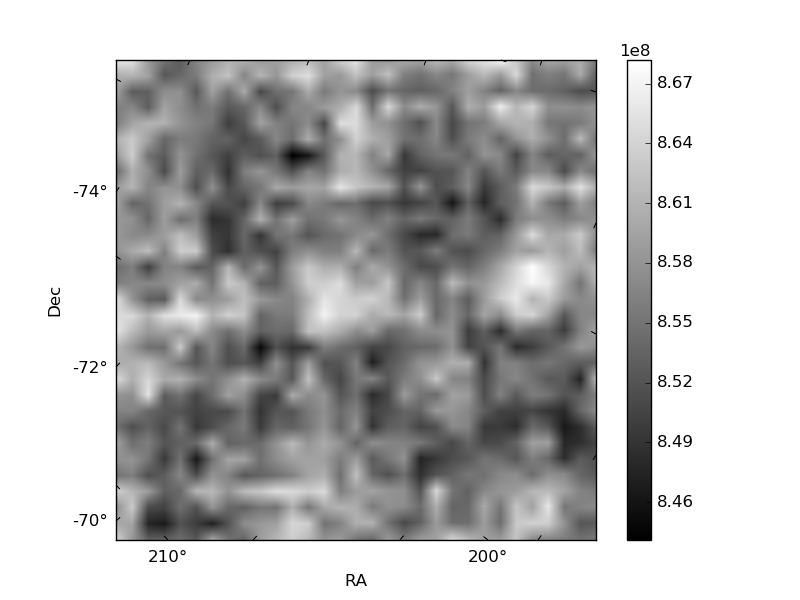
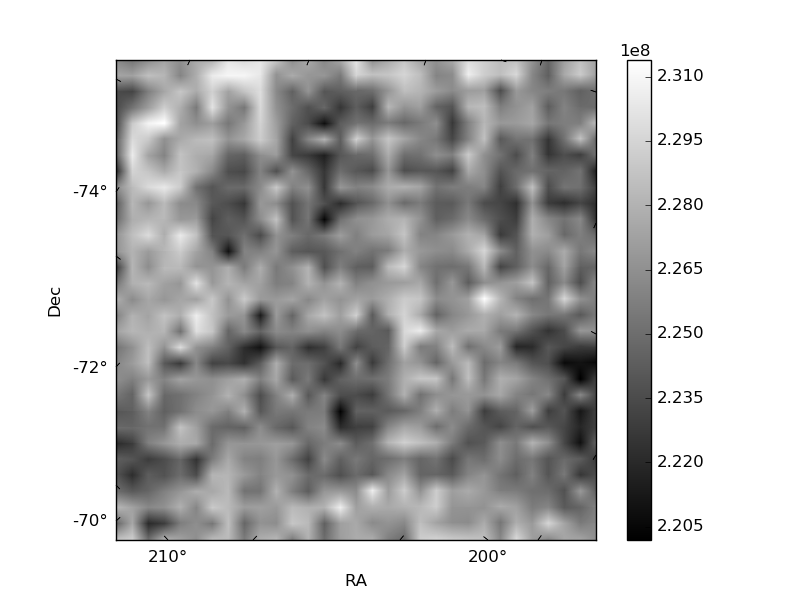
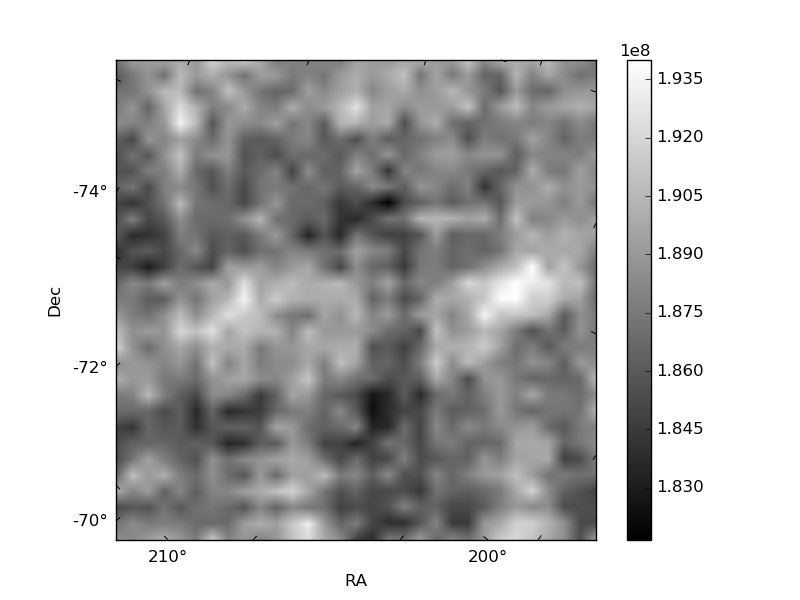
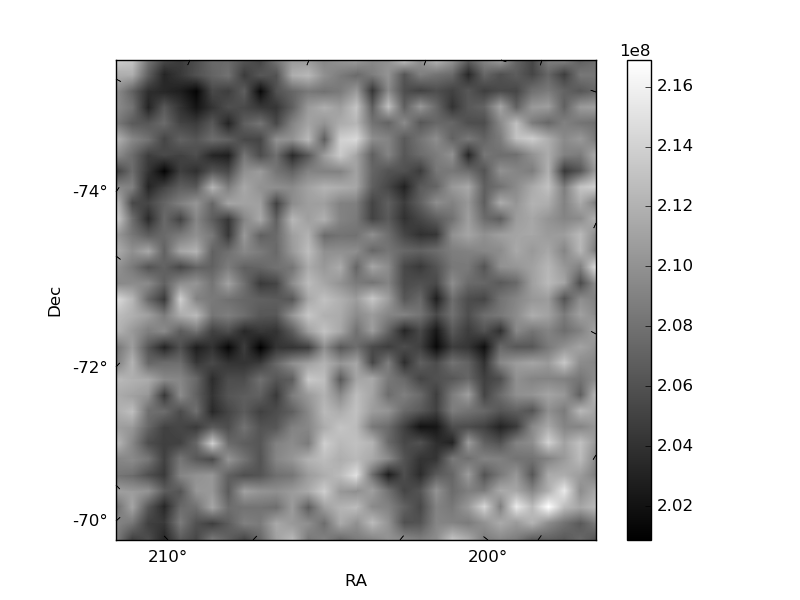
Histogram calculated using DETX and DETY for each event in the final _common_clean file
| Quadrant A | 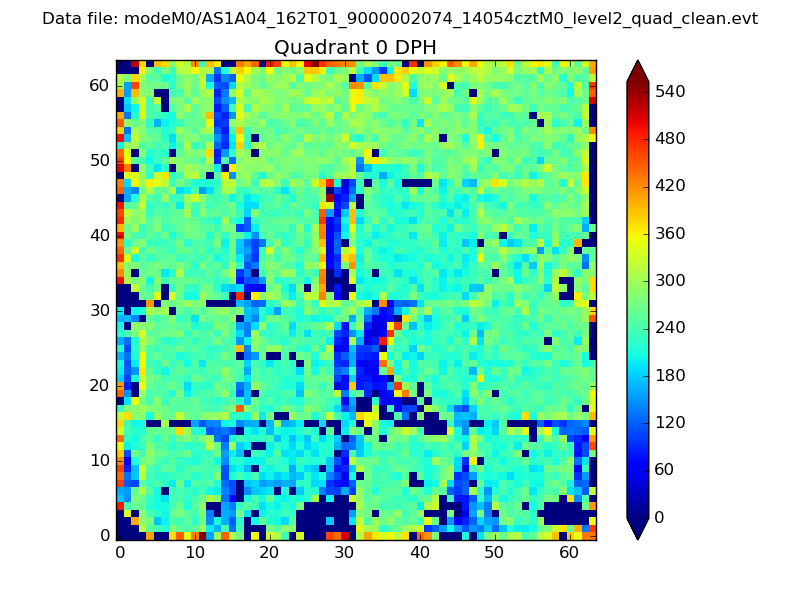 |
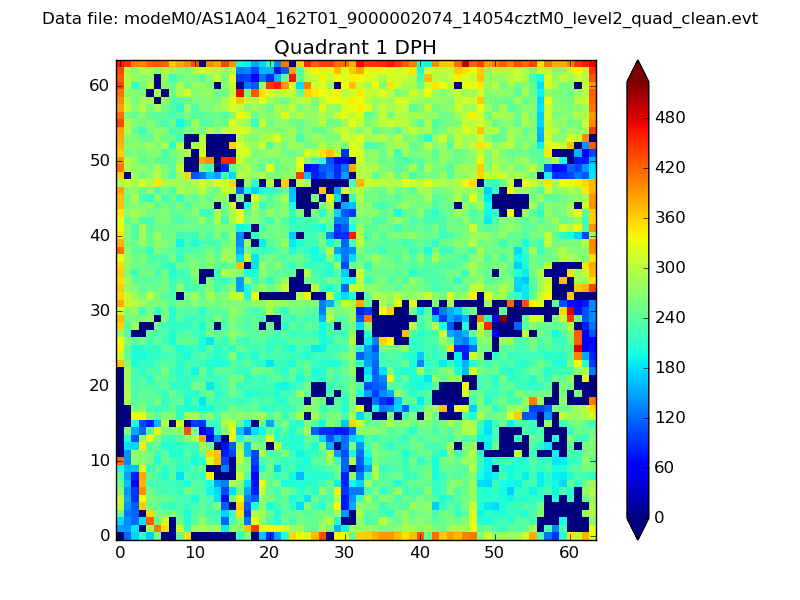 |
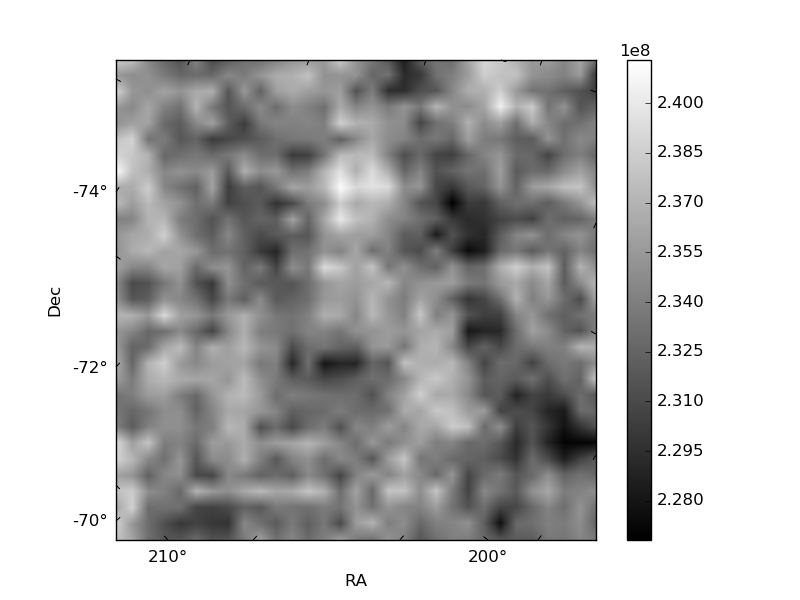
Quadrant B |
|---|---|---|---|
| Quadrant D | 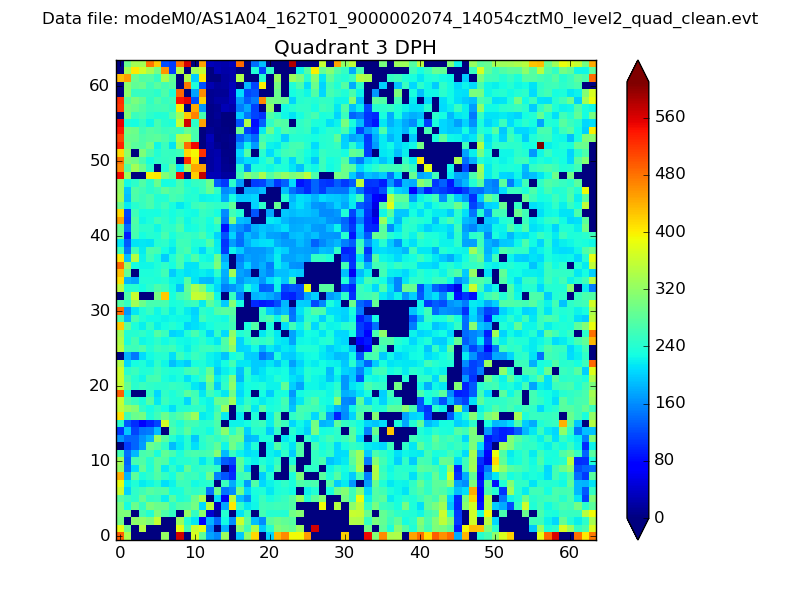 |
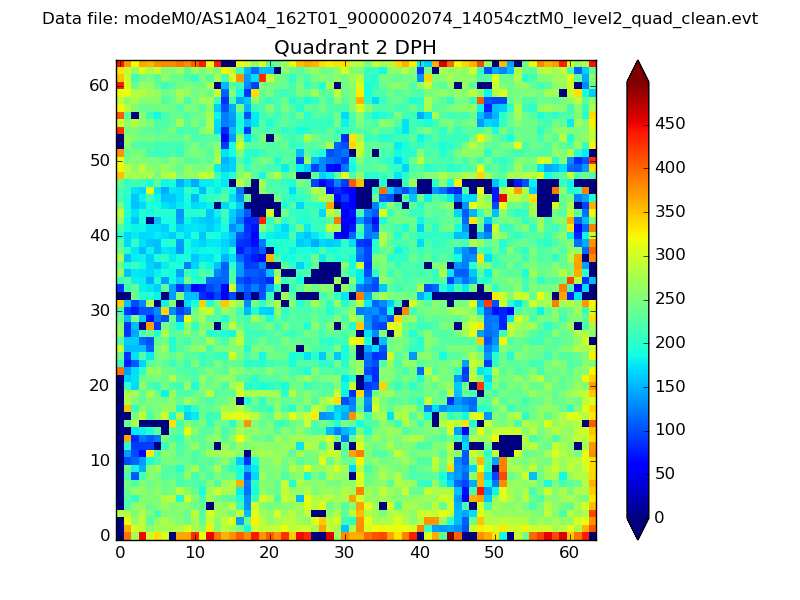 |
Quadrant C |
| Plot type | Count rate plots | Images |
|---|---|---|
| Comparison with Poisson distribution Blue bars denote a histogram of data divided into 1 sec bins. Red curve is a Poisson curve with rate = median count rate of data. |
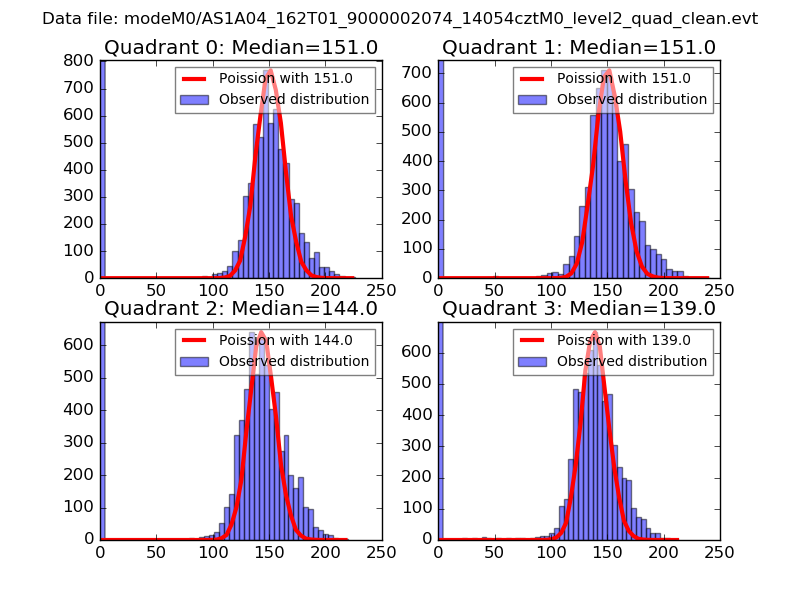 |
 |
| Quadrant-wise count rates Data is divided into 100 sec bins |
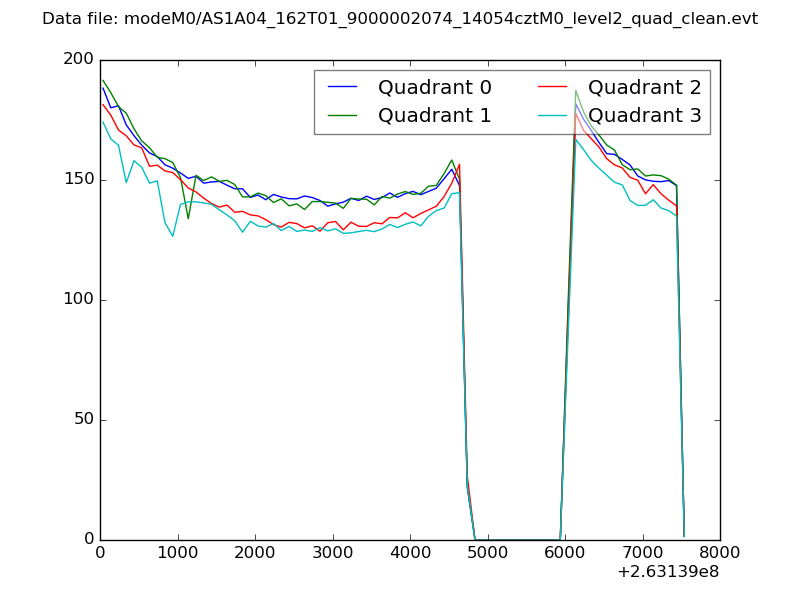 |
|
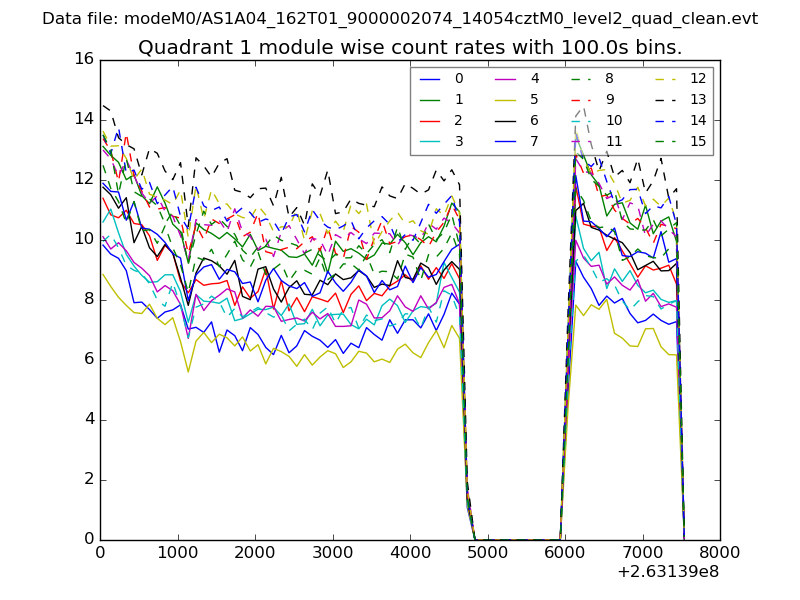
| Module-wise count rates for Quadrant A Data is divided into 100 sec bins |
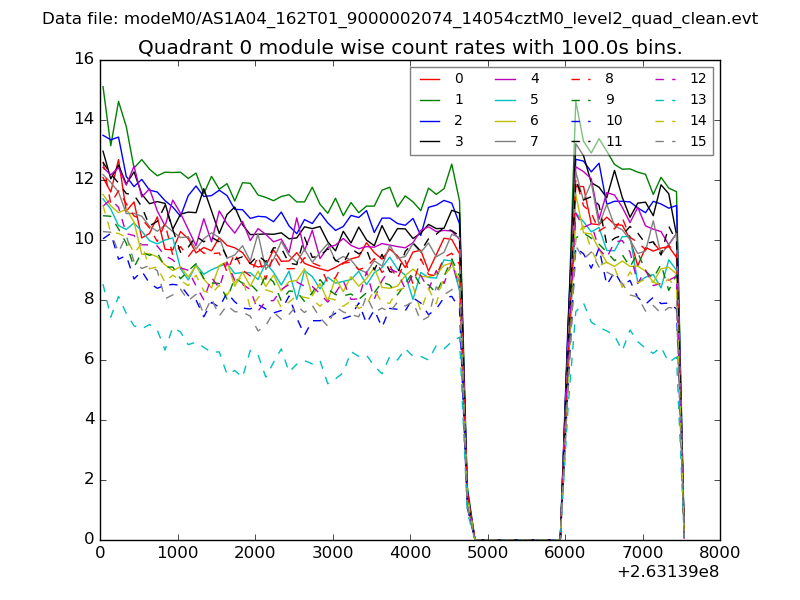 |
 |
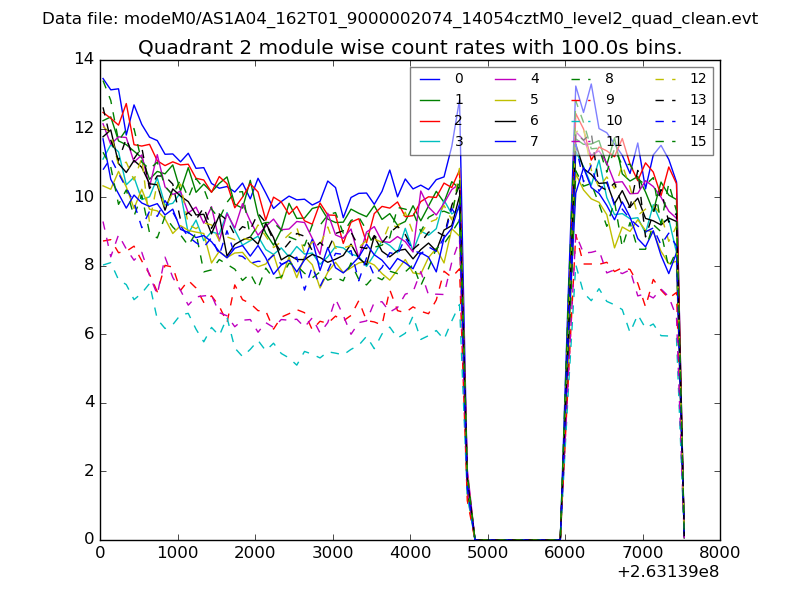
| Module-wise count rates for Quadrant B Data is divided into 100 sec bins |
 |
 |
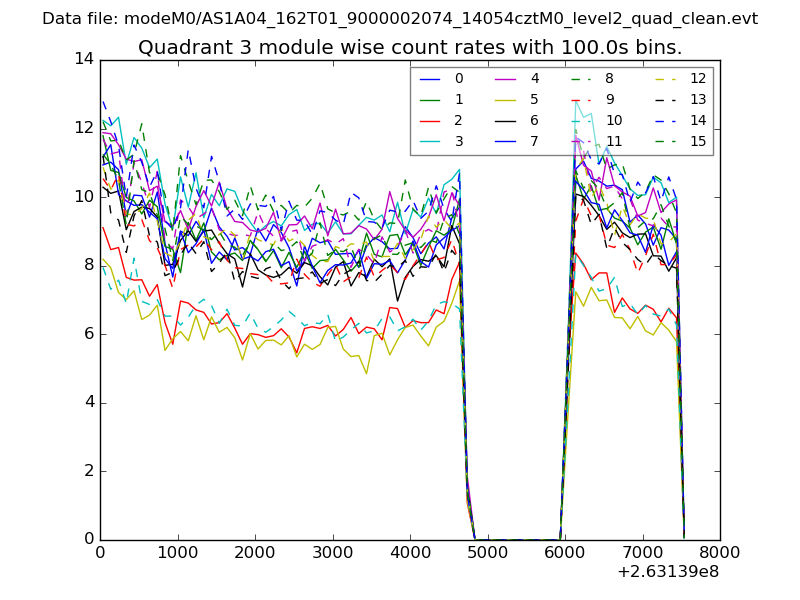
| Module-wise count rates for Quadrant C Data is divided into 100 sec bins |
 |
 |
| Module-wise count rates for Quadrant D Data is divided into 100 sec bins |
 |
 |
| Parameter | Plot |
|---|---|
| CZT HV Monitor | 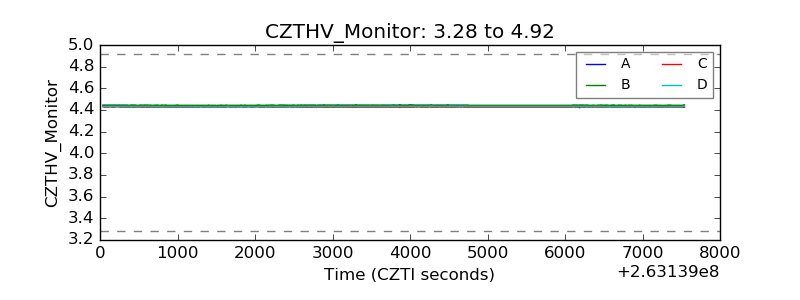 |
| D_VDD | 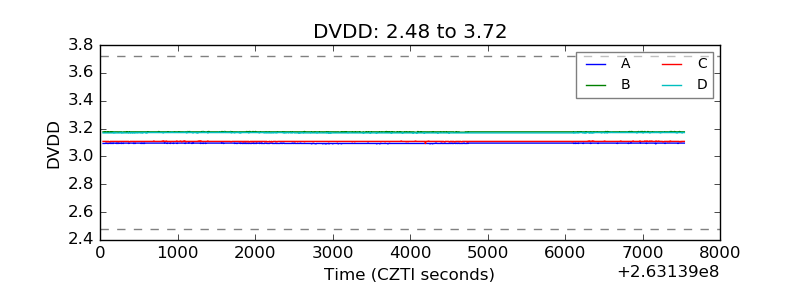 |
| Temperature 1 | 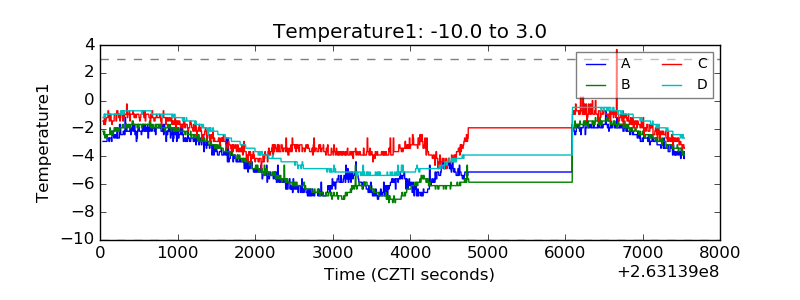 |
| Veto HV Monitor | 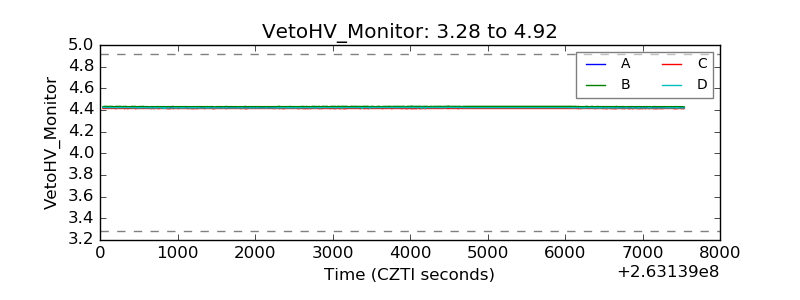 |
| Veto LLD | 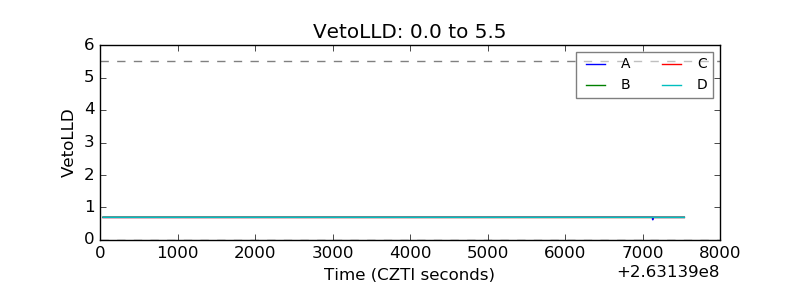 |
| Alpha Counter | 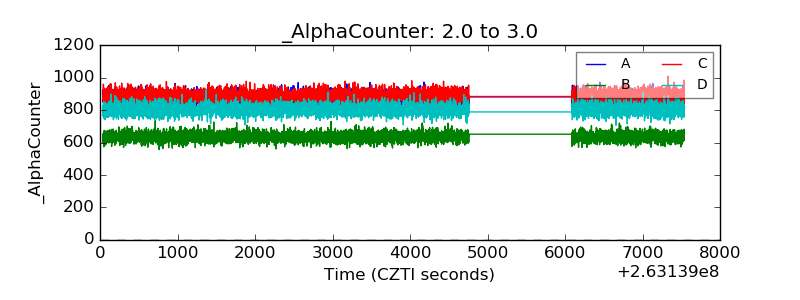 |
| _CPM_Rate | 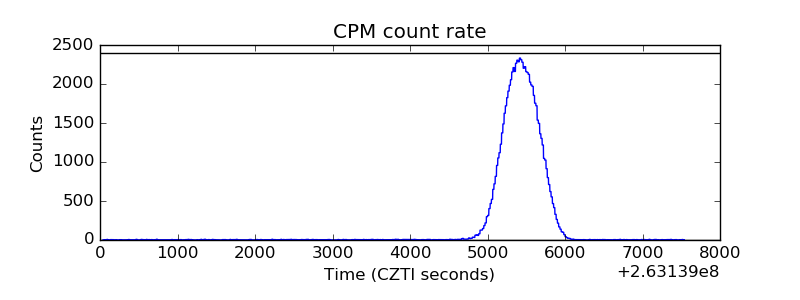 |
| CZT Counter | 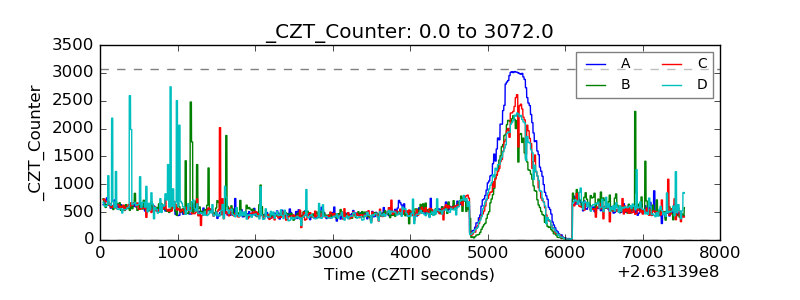 |
| +2.5 Volts monitor |  |
| +5 Volts monitor |  |
| _ROLL_ROT | 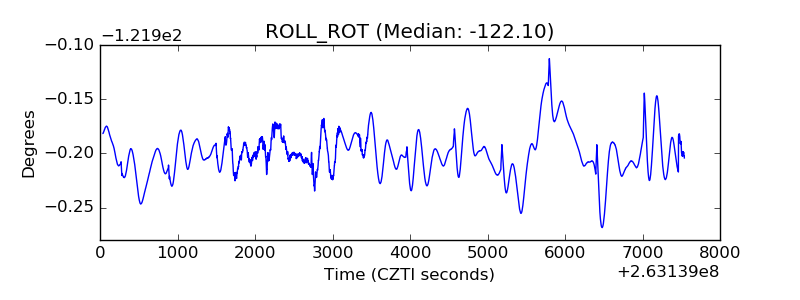 |
| _Roll_DEC | 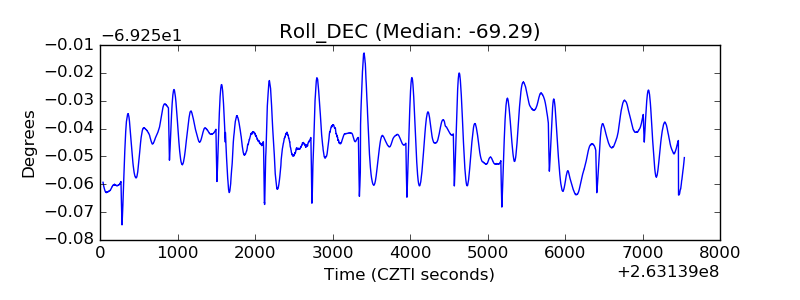 |
| _Roll_RA | 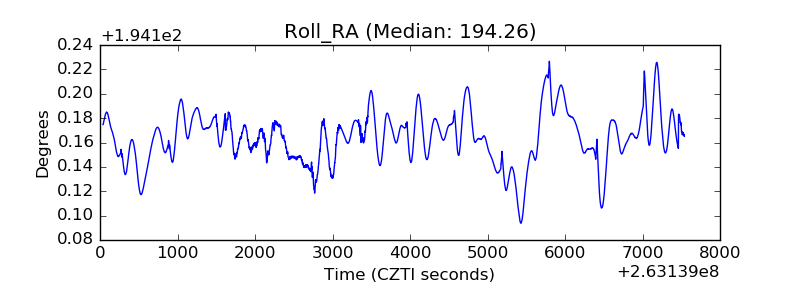 |
| Veto Counter | 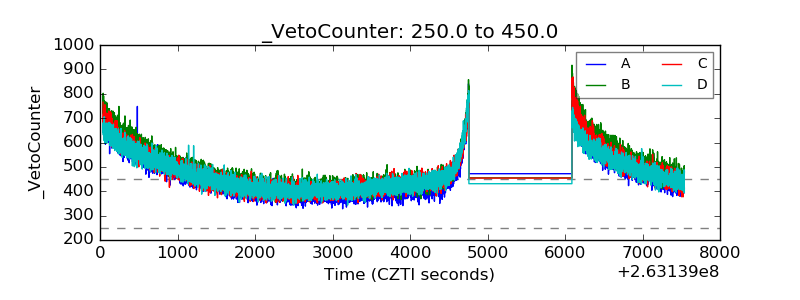 |