| Param | Original file | Final file |
|---|---|---|
| Filename | modeM0/AS1A04_162T01_9000002074_14055cztM0_level2.evt | modeM0/AS1A04_162T01_9000002074_14055cztM0_level2_quad_clean.evt |
| Size (bytes) | 454,930,560 | 122,587,200 |
| Size | 433.9 MB | 116.9 MB |
| Events in quadrant A | 2,880,750 | 854,396 |
| Events in quadrant B | 3,399,827 | 848,742 |
| Events in quadrant C | 2,904,213 | 817,245 |
| Events in quadrant D | 4,193,364 | 781,485 |
| Mode M0 | |||
|---|---|---|---|
| Quadrant | BADHDUFLAG | Total packets | Discarded packets |
| A | 0 | 12298 | 2 |
| B | 0 | 13842 | 1 |
| C | 0 | 12281 | 1 |
| D | 0 | 16394 | 1 |
| Mode M9 | |||
|---|---|---|---|
| Quadrant | BADHDUFLAG | Total packets | Discarded packets |
| A | 0 | 13 | 0 |
| B | 0 | 13 | 0 |
| C | 0 | 13 | 0 |
| D | 0 | 13 | 0 |
| Mode SS | |||
|---|---|---|---|
| Quadrant | BADHDUFLAG | Total packets | Discarded packets |
| A | 0 | 120 | 0 |
| B | 0 | 120 | 0 |
| C | 0 | 120 | 0 |
| D | 0 | 120 | 0 |
| Quadrant | Total seconds | Saturated seconds | Saturation percentage |
|---|---|---|---|
| A | 5881 | 58 | 0.986227% |
| B | 5881 | 213 | 3.621833% |
| C | 5881 | 25 | 0.425098% |
| D | 5881 | 156 | 2.652610% |
Noise dominated data is calculated using 1-second bins in cleaned event files. If a bin has >2000 counts, and if more than 50% of those come from <1% of pixels, then it is considered to be noise-dominated and hence unusable.
| Quadrant | # 1 sec bins | Bins with >0 counts | Bins with >2000 counts | High rate bins dominated by noise | Noise dominated (total time) | Noise dominated (detector-on time) | Marked lightcurve |
|---|---|---|---|---|---|---|---|
| A | 7212 | 5883 | 0 | 0 | 0.00% | 0.00% | 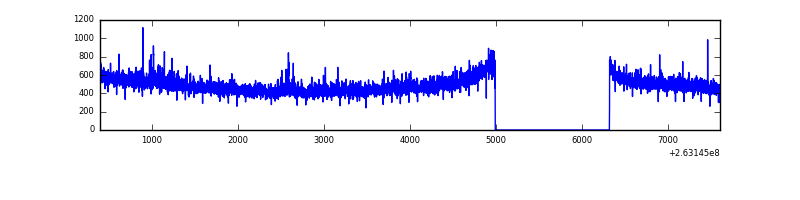 |
| B | 7212 | 5883 | 106 | 106 | 1.47% | 1.80% | 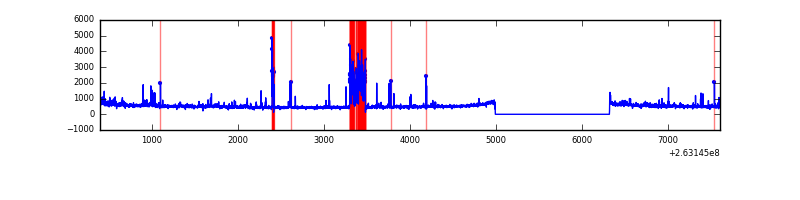 |
| C | 7212 | 5883 | 3 | 3 | 0.04% | 0.05% | 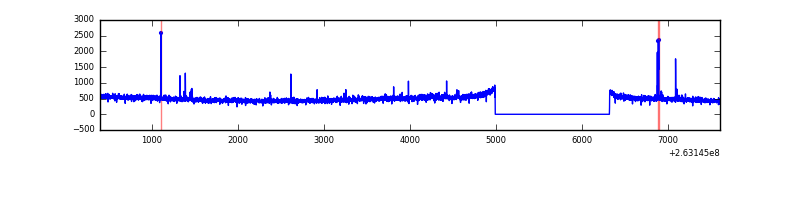 |
| D | 7212 | 5883 | 113 | 113 | 1.57% | 1.92% | 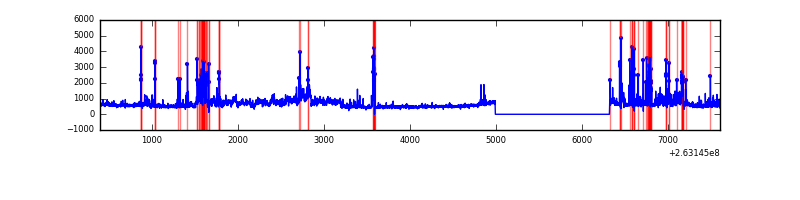 |
Top three noisy pixels from each quadrant. If the there are fewer than three noisy pixels in the level2.evt file, extra rows are filled as -1
| Pixel properties | Quadrant properties | ||||||
|---|---|---|---|---|---|---|---|
| Quadrant | DetID | PixID | Counts | Sigma | Mean | Median | Sigma |
| A | 12 | 189 | 48872 | 326.38 | 736 | 723 | 147.5 |
| A | 0 | 226 | 6734 | 40.75 | 736 | 723 | 147.5 |
| A | 12 | 194 | 5677 | 33.58 | 736 | 723 | 147.5 |
| B | 10 | 252 | 284283 | 2099.05 | 725 | 709 | 135.1 |
| B | 3 | 64 | 57164 | 417.89 | 725 | 709 | 135.1 |
| B | 0 | 189 | 48711 | 355.32 | 725 | 709 | 135.1 |
| C | 3 | 233 | 168386 | 1062.05 | 694 | 698 | 157.9 |
| C | 0 | 207 | 29197 | 180.5 | 694 | 698 | 157.9 |
| C | 13 | 61 | 5044 | 27.53 | 694 | 698 | 157.9 |
| D | 12 | 110 | 677512 | 3974.93 | 685 | 668 | 170.3 |
| D | 1 | 52 | 343744 | 2014.8 | 685 | 668 | 170.3 |
| D | 8 | 195 | 172232 | 1007.55 | 685 | 668 | 170.3 |
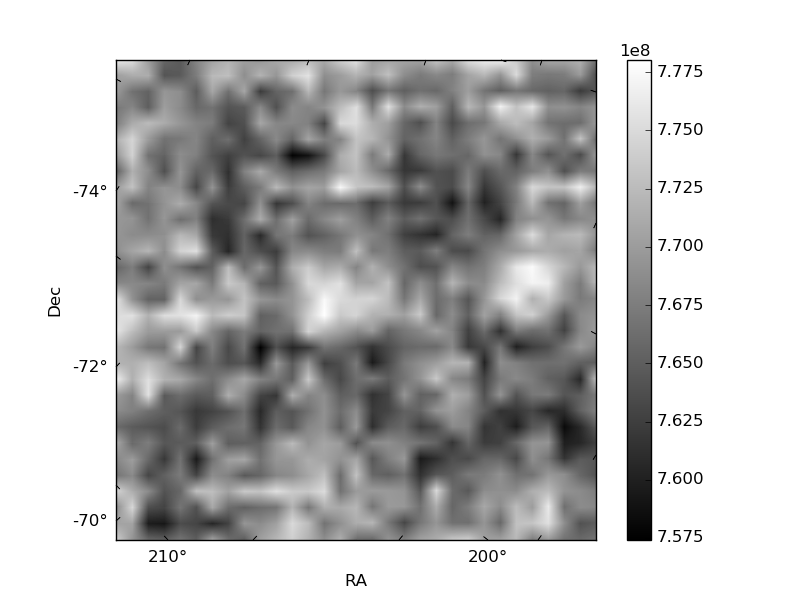
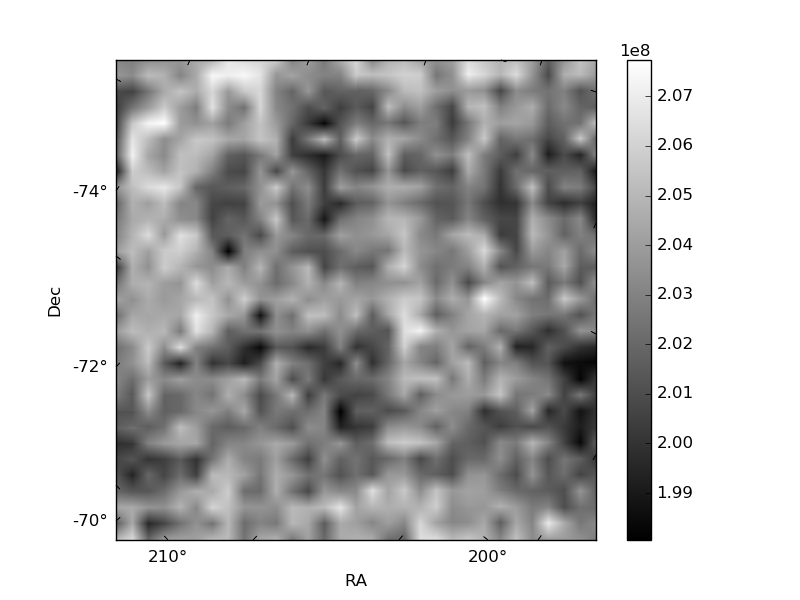
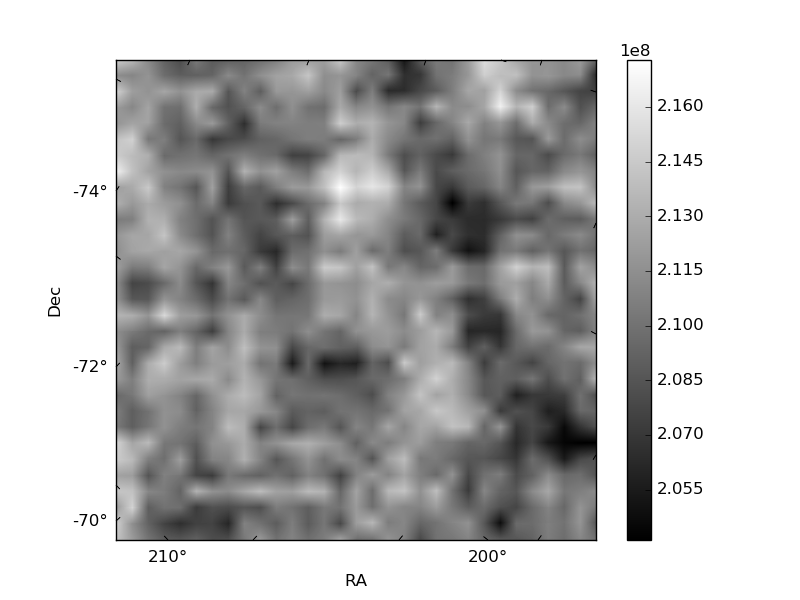
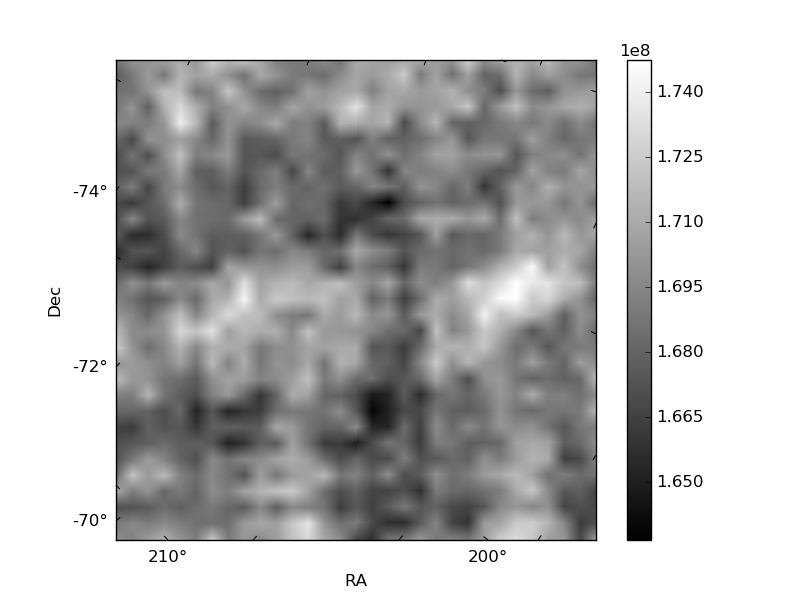
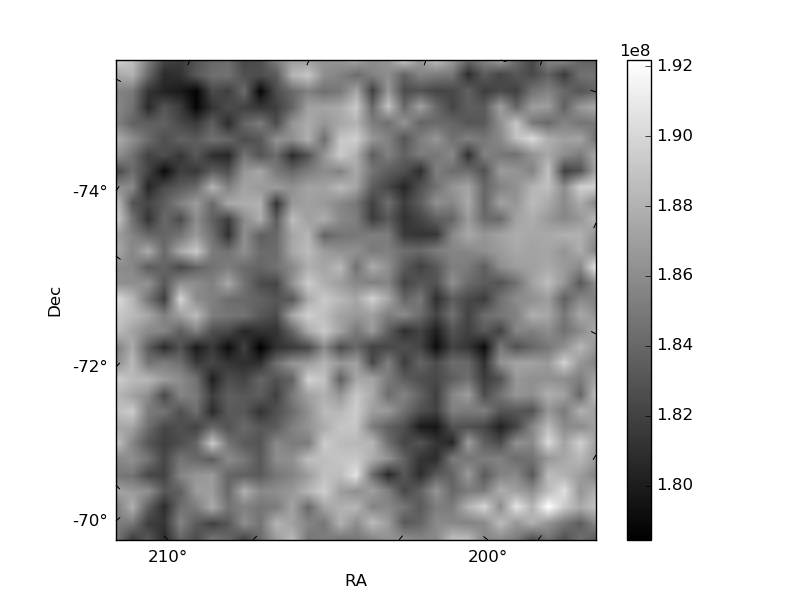
Histogram calculated using DETX and DETY for each event in the final _common_clean file
| Quadrant A | 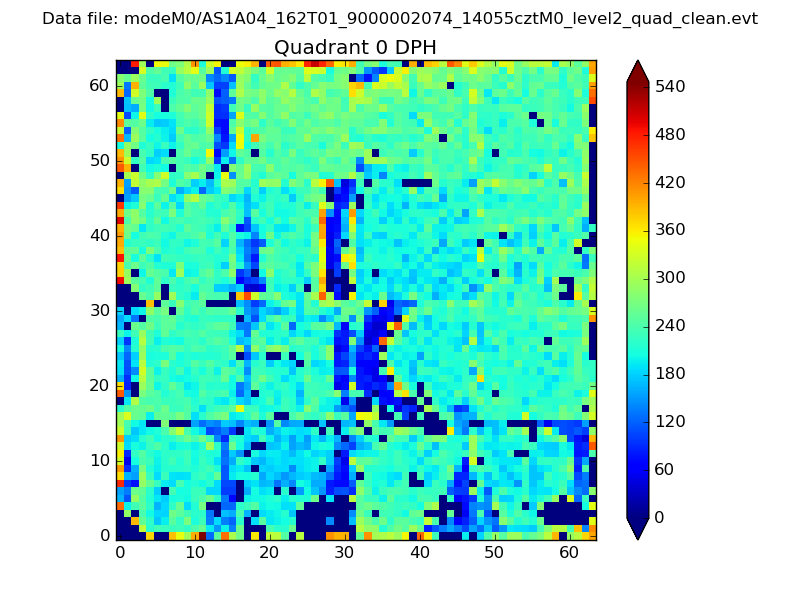 |
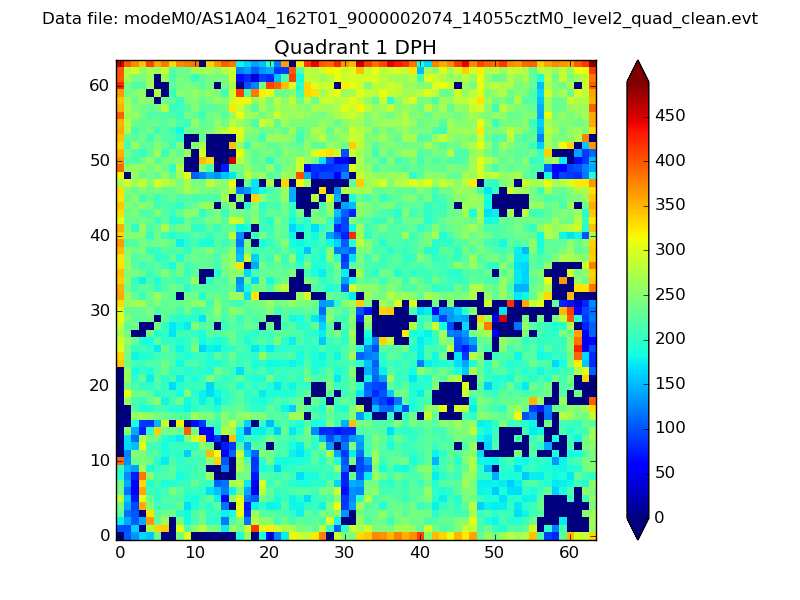 |
Quadrant B |
|---|---|---|---|
| Quadrant D | 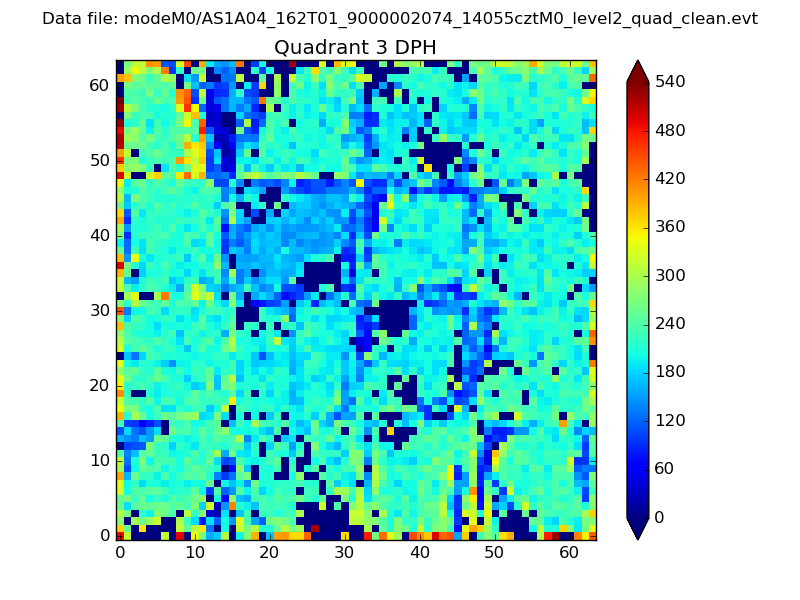 |
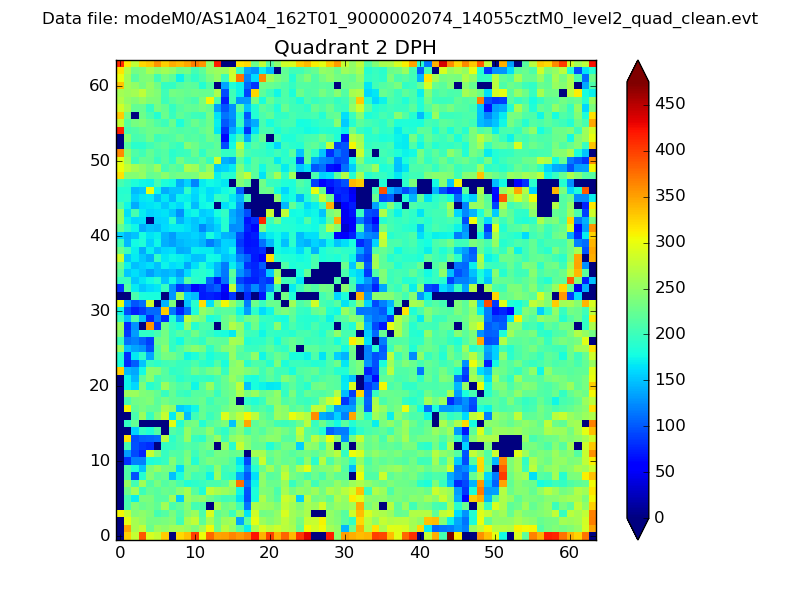 |
Quadrant C |
| Plot type | Count rate plots | Images |
|---|---|---|
| Comparison with Poisson distribution Blue bars denote a histogram of data divided into 1 sec bins. Red curve is a Poisson curve with rate = median count rate of data. |
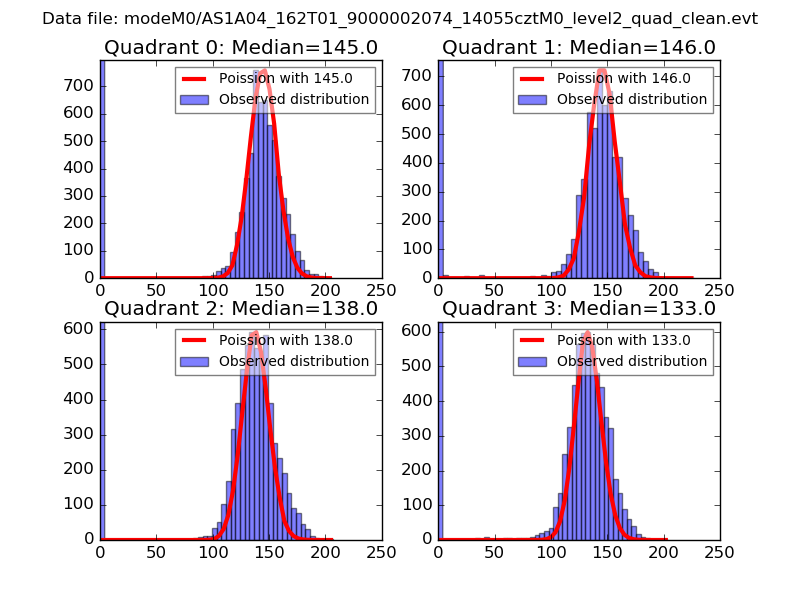 |
 |
| Quadrant-wise count rates Data is divided into 100 sec bins |
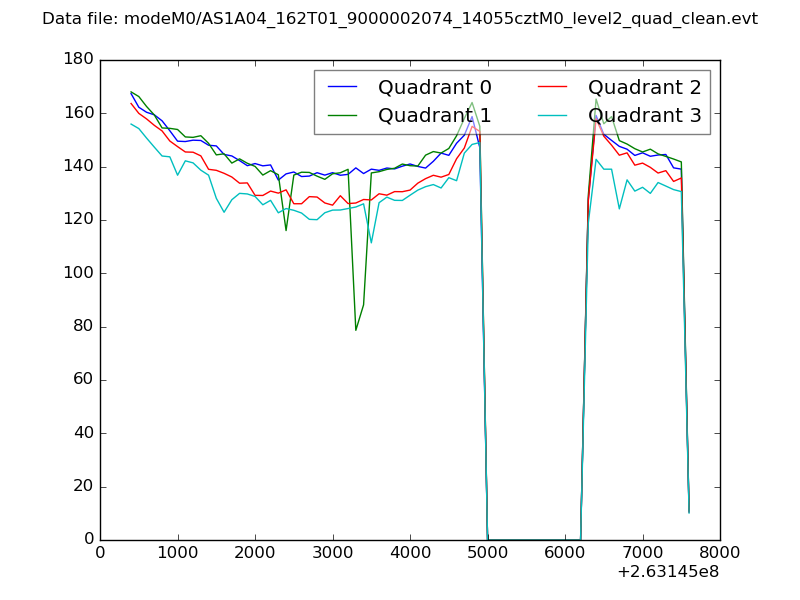 |
|
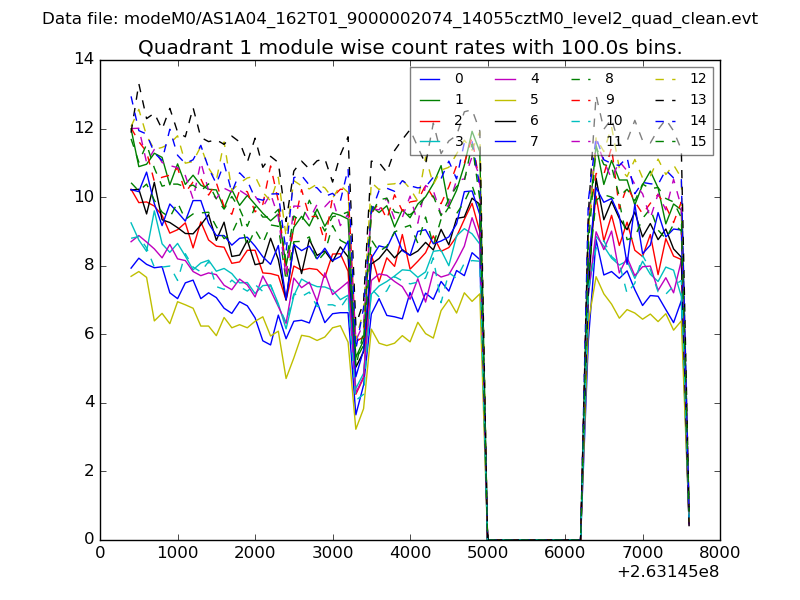
| Module-wise count rates for Quadrant A Data is divided into 100 sec bins |
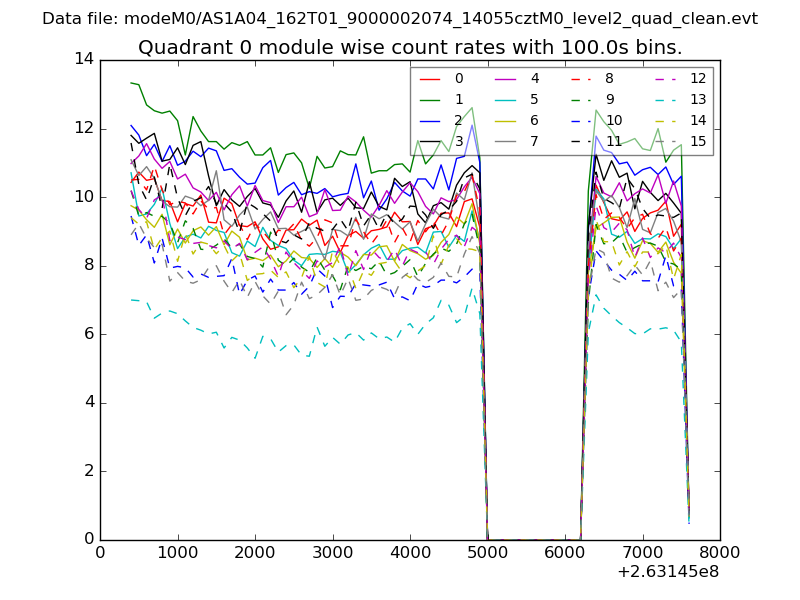 |
 |
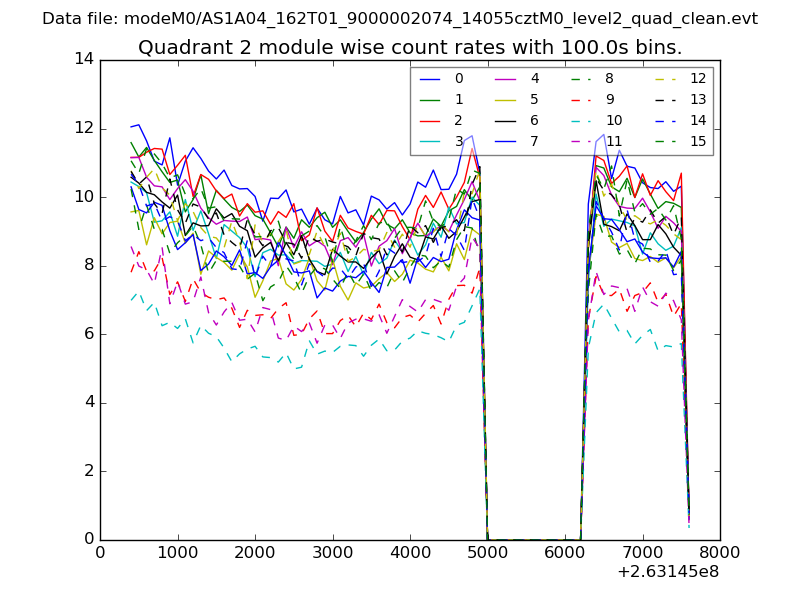
| Module-wise count rates for Quadrant B Data is divided into 100 sec bins |
 |
 |
| Module-wise count rates for Quadrant C Data is divided into 100 sec bins |
 |
 |
| Module-wise count rates for Quadrant D Data is divided into 100 sec bins |
 |
 |
| Parameter | Plot |
|---|---|
| CZT HV Monitor | 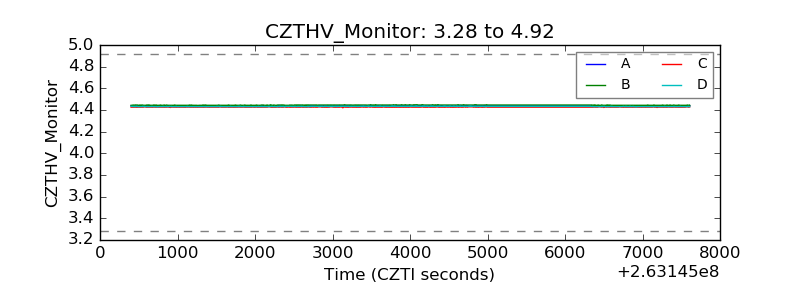 |
| D_VDD |  |
| Temperature 1 | 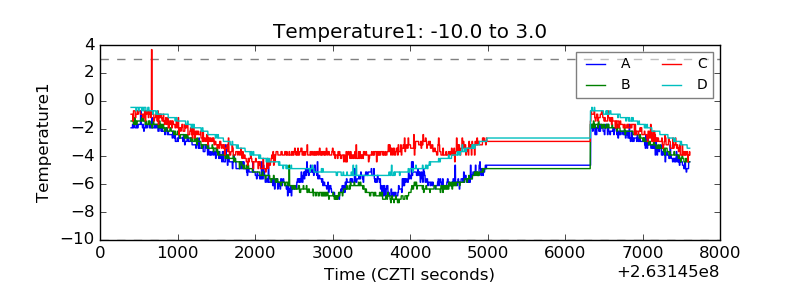 |
| Veto HV Monitor | 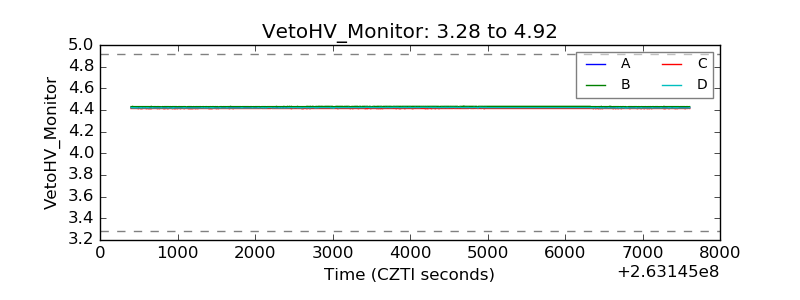 |
| Veto LLD | 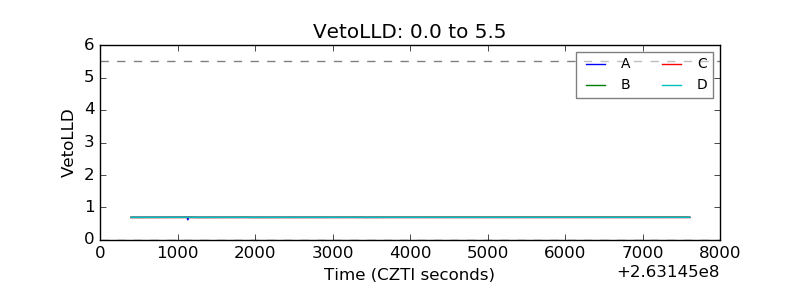 |
| Alpha Counter | 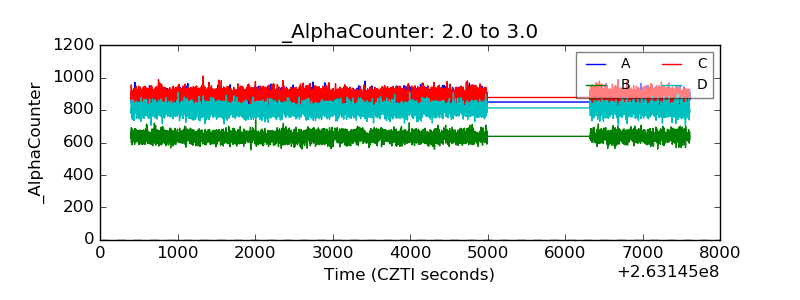 |
| _CPM_Rate | 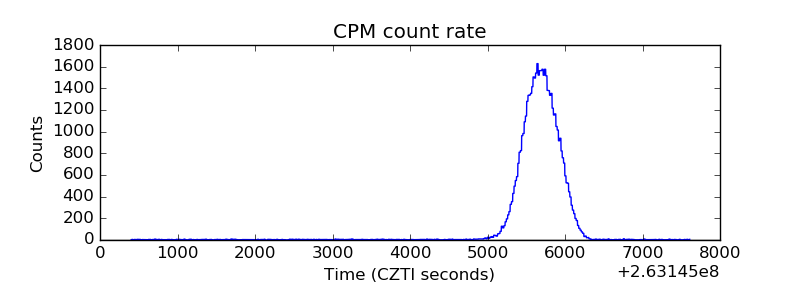 |
| CZT Counter | 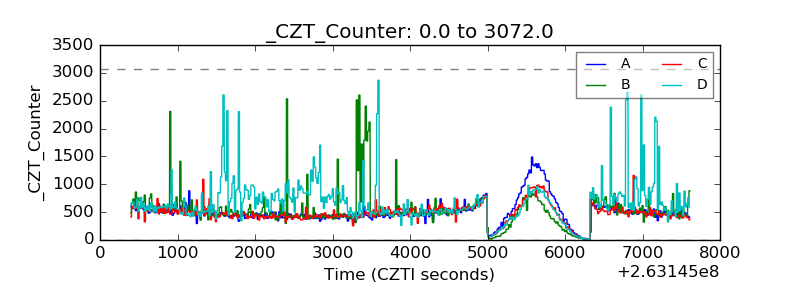 |
| +2.5 Volts monitor |  |
| +5 Volts monitor |  |
| _ROLL_ROT | 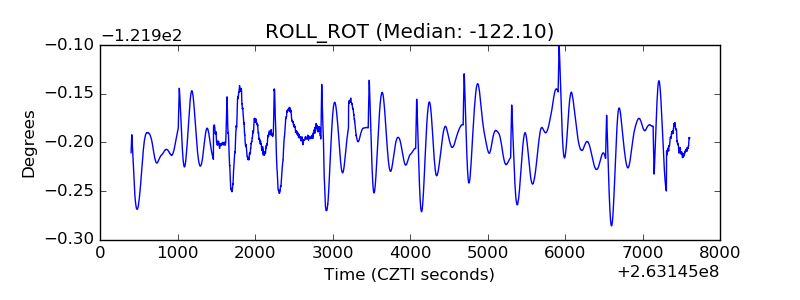 |
| _Roll_DEC | 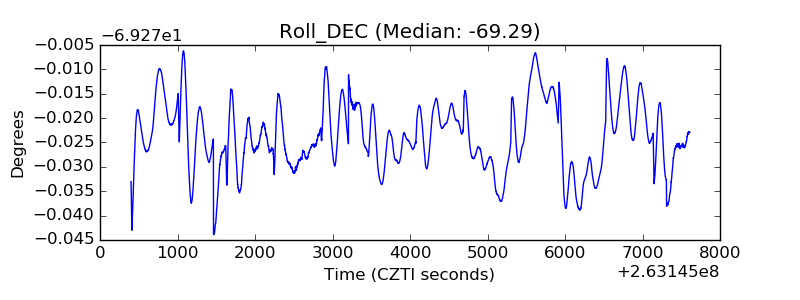 |
| _Roll_RA | 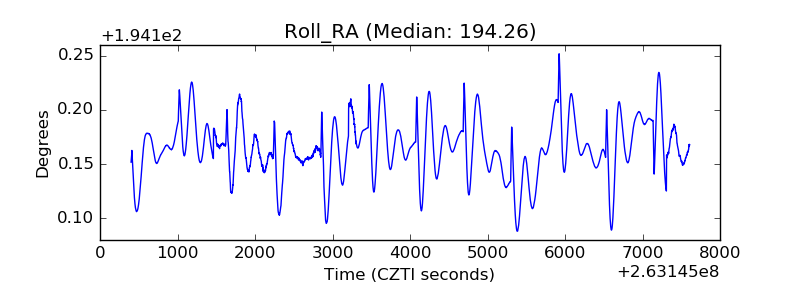 |
| Veto Counter | 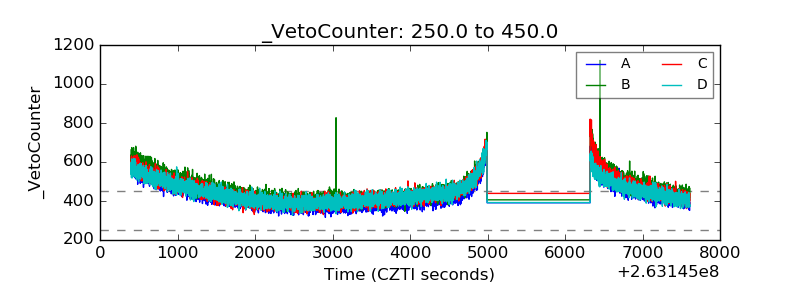 |