| Param | Original file | Final file |
|---|---|---|
| Filename | modeM0/AS1A04_162T01_9000002074_14056cztM0_level2.evt | modeM0/AS1A04_162T01_9000002074_14056cztM0_level2_quad_clean.evt |
| Size (bytes) | 468,809,280 | 127,056,960 |
| Size | 447.1 MB | 121.2 MB |
| Events in quadrant A | 3,098,067 | 874,343 |
| Events in quadrant B | 3,416,087 | 885,054 |
| Events in quadrant C | 3,030,334 | 841,186 |
| Events in quadrant D | 4,221,932 | 804,390 |
| Mode M0 | |||
|---|---|---|---|
| Quadrant | BADHDUFLAG | Total packets | Discarded packets |
| A | 0 | 13309 | 3 |
| B | 0 | 14320 | 2 |
| C | 0 | 13238 | 2 |
| D | 0 | 16777 | 2 |
| Mode M9 | |||
|---|---|---|---|
| Quadrant | BADHDUFLAG | Total packets | Discarded packets |
| A | 0 | 16 | 0 |
| B | 0 | 16 | 0 |
| C | 0 | 16 | 0 |
| D | 0 | 17 | 0 |
| Mode SS | |||
|---|---|---|---|
| Quadrant | BADHDUFLAG | Total packets | Discarded packets |
| A | 0 | 128 | 0 |
| B | 0 | 128 | 0 |
| C | 0 | 128 | 0 |
| D | 0 | 128 | 0 |
| Quadrant | Total seconds | Saturated seconds | Saturation percentage |
|---|---|---|---|
| A | 6358 | 32 | 0.503303% |
| B | 6358 | 92 | 1.446996% |
| C | 6358 | 16 | 0.251651% |
| D | 6358 | 129 | 2.028940% |
Noise dominated data is calculated using 1-second bins in cleaned event files. If a bin has >2000 counts, and if more than 50% of those come from <1% of pixels, then it is considered to be noise-dominated and hence unusable.
| Quadrant | # 1 sec bins | Bins with >0 counts | Bins with >2000 counts | High rate bins dominated by noise | Noise dominated (total time) | Noise dominated (detector-on time) | Marked lightcurve |
|---|---|---|---|---|---|---|---|
| A | 7544 | 6360 | 1 | 1 | 0.01% | 0.02% | 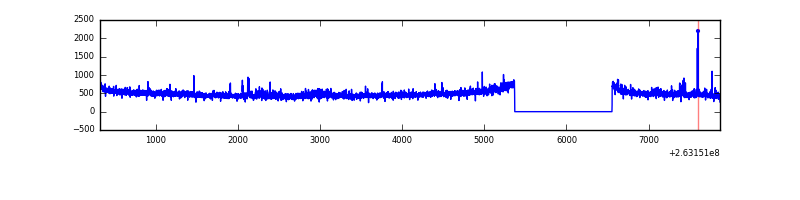 |
| B | 7544 | 6360 | 33 | 33 | 0.44% | 0.52% | 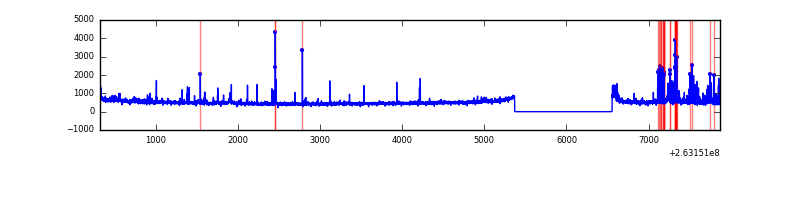 |
| C | 7544 | 6360 | 3 | 3 | 0.04% | 0.05% | 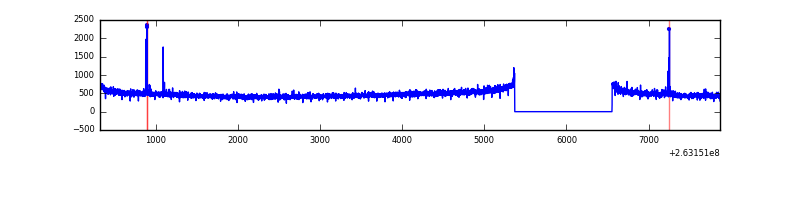 |
| D | 7544 | 6360 | 98 | 98 | 1.30% | 1.54% | 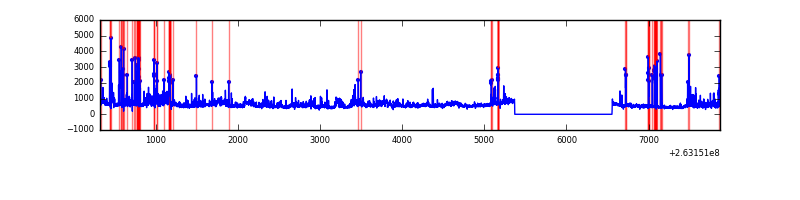 |
Top three noisy pixels from each quadrant. If the there are fewer than three noisy pixels in the level2.evt file, extra rows are filled as -1
| Pixel properties | Quadrant properties | ||||||
|---|---|---|---|---|---|---|---|
| Quadrant | DetID | PixID | Counts | Sigma | Mean | Median | Sigma |
| A | 12 | 189 | 90130 | 573.89 | 770 | 755 | 155.7 |
| A | 8 | 15 | 17327 | 106.41 | 770 | 755 | 155.7 |
| A | 15 | 222 | 9253 | 54.57 | 770 | 755 | 155.7 |
| B | 0 | 85 | 161456 | 1117.79 | 772 | 755 | 143.8 |
| B | 0 | 189 | 64833 | 445.71 | 772 | 755 | 143.8 |
| B | 0 | 190 | 38431 | 262.06 | 772 | 755 | 143.8 |
| C | 3 | 233 | 119481 | 702.02 | 733 | 735 | 169.1 |
| C | 0 | 207 | 28778 | 165.79 | 733 | 735 | 169.1 |
| C | 9 | 15 | 26178 | 150.42 | 733 | 735 | 169.1 |
| D | 12 | 110 | 438028 | 2391.68 | 722 | 702 | 182.9 |
| D | 1 | 52 | 425390 | 2322.57 | 722 | 702 | 182.9 |
| D | 8 | 195 | 301765 | 1646.48 | 722 | 702 | 182.9 |
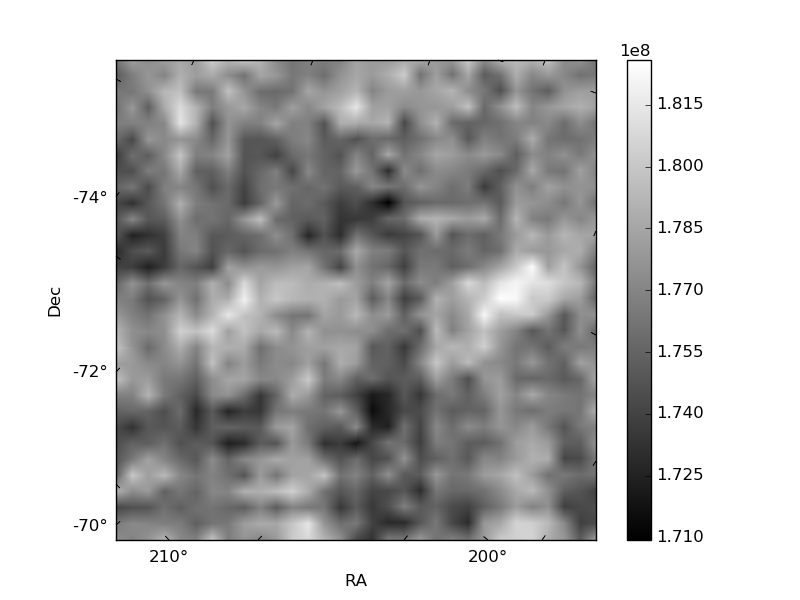
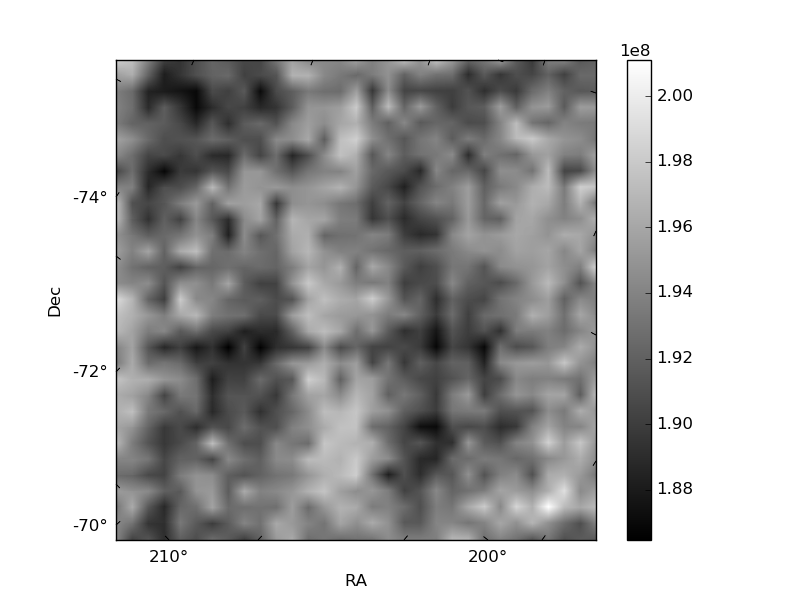
Histogram calculated using DETX and DETY for each event in the final _common_clean file
| Quadrant A |  |
 |
Quadrant B |
|---|---|---|---|
| Quadrant D | 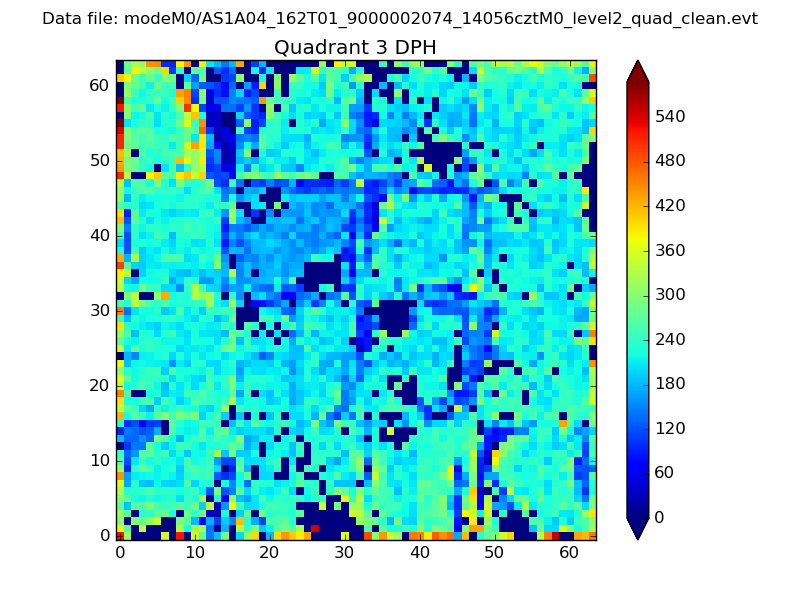 |
 |
Quadrant C |
| Plot type | Count rate plots | Images |
|---|---|---|
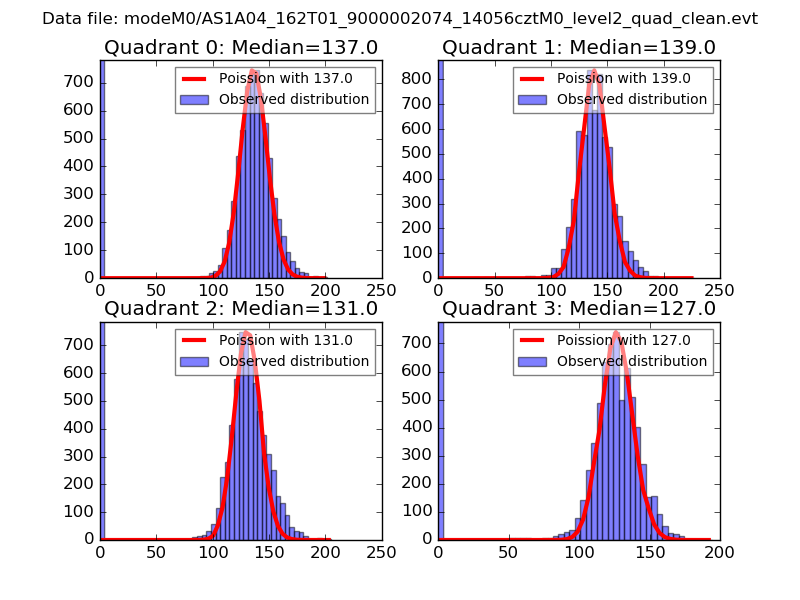
| Comparison with Poisson distribution Blue bars denote a histogram of data divided into 1 sec bins. Red curve is a Poisson curve with rate = median count rate of data. |
 |
 |
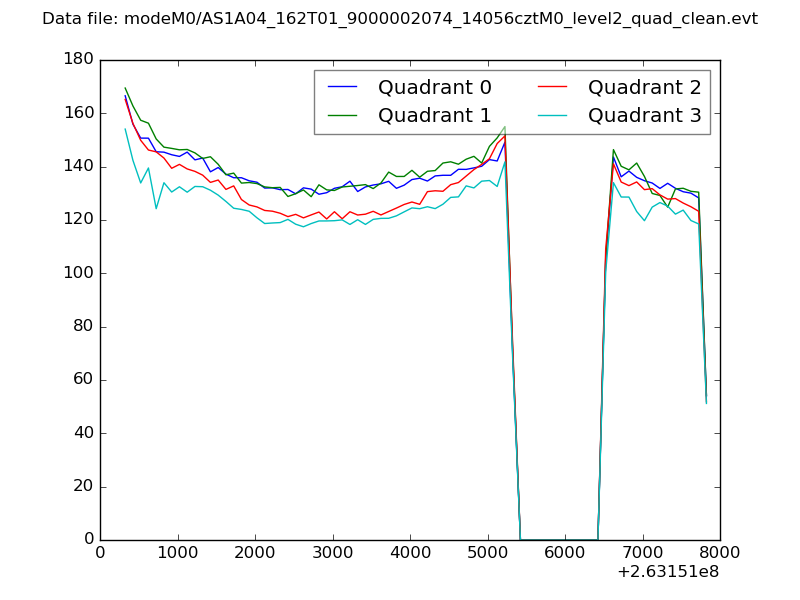
| Quadrant-wise count rates Data is divided into 100 sec bins |
 |
|
| Module-wise count rates for Quadrant A Data is divided into 100 sec bins |
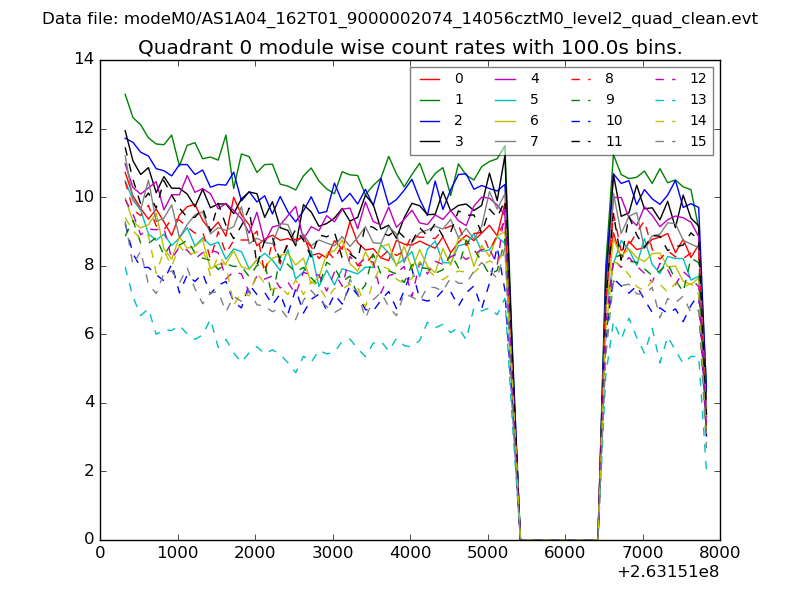 |
 |
| Module-wise count rates for Quadrant B Data is divided into 100 sec bins |
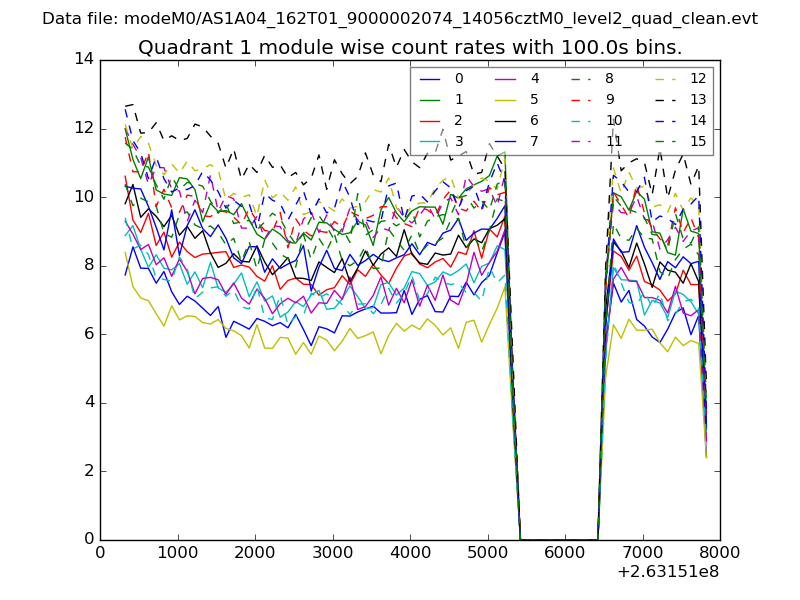 |
 |
| Module-wise count rates for Quadrant C Data is divided into 100 sec bins |
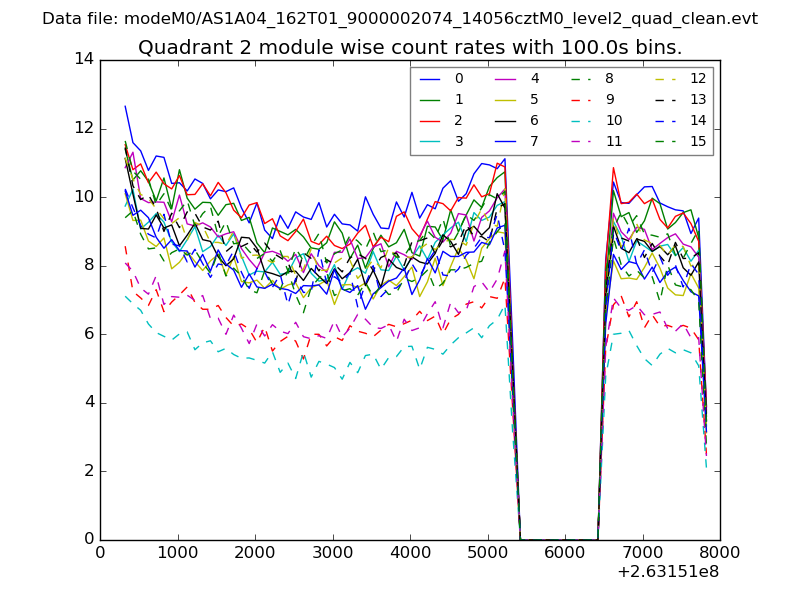 |
 |
| Module-wise count rates for Quadrant D Data is divided into 100 sec bins |
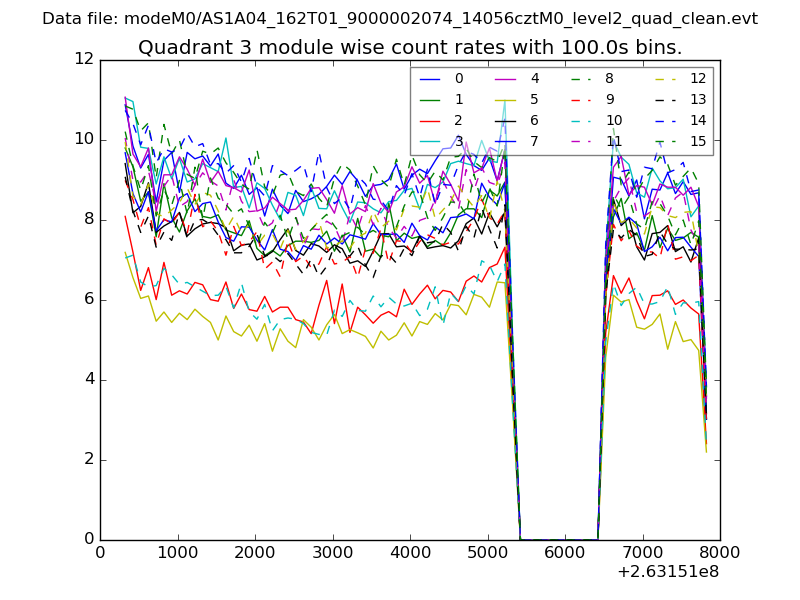 |
 |
| Parameter | Plot |
|---|---|
| CZT HV Monitor | 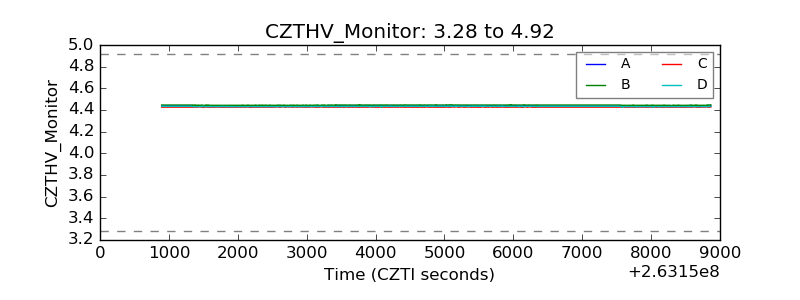 |
| D_VDD | 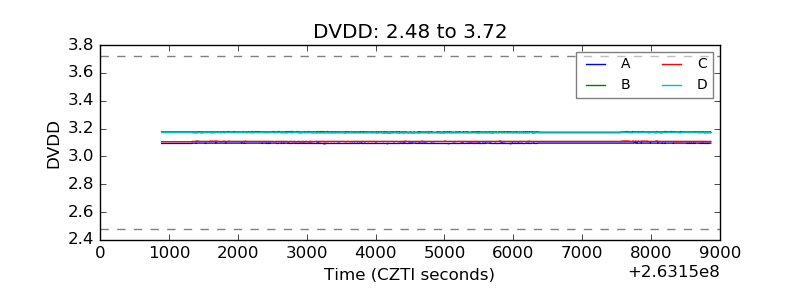 |
| Temperature 1 | 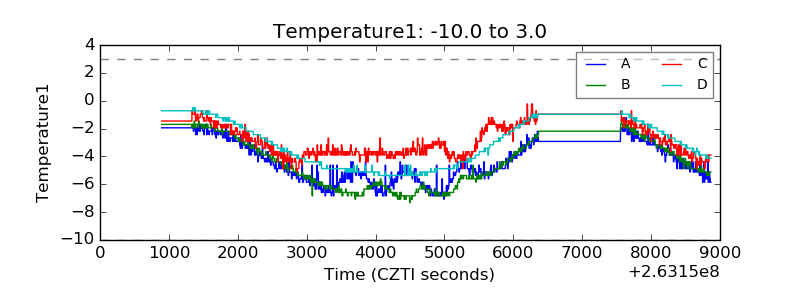 |
| Veto HV Monitor | 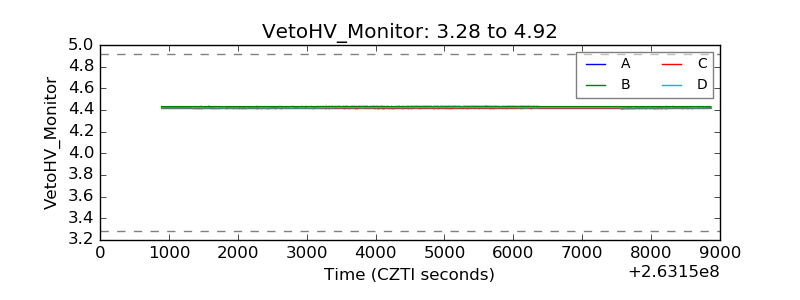 |
| Veto LLD | 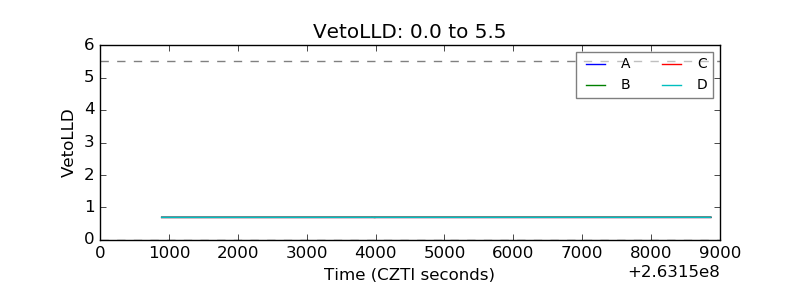 |
| Alpha Counter | 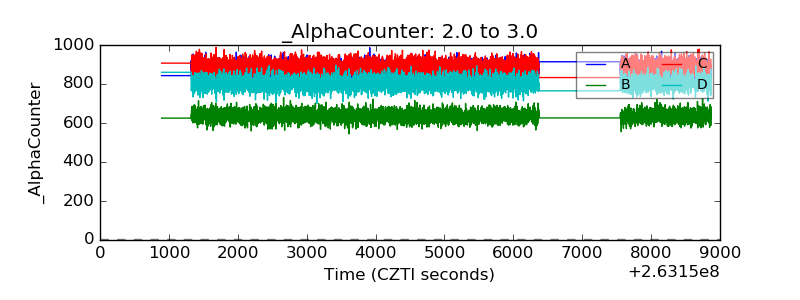 |
| _CPM_Rate | 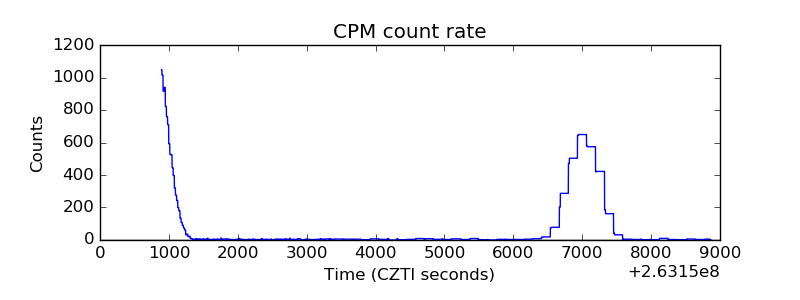 |
| CZT Counter |  |
| +2.5 Volts monitor |  |
| +5 Volts monitor | 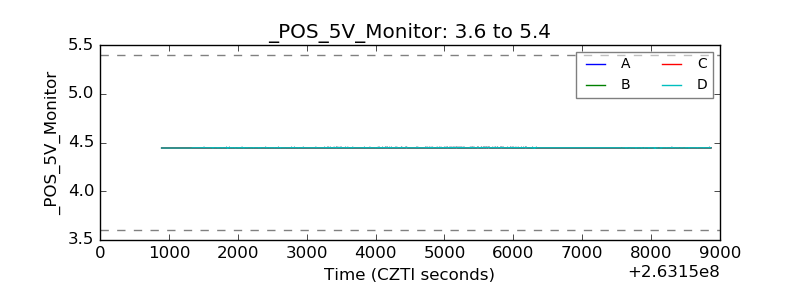 |
| _ROLL_ROT | 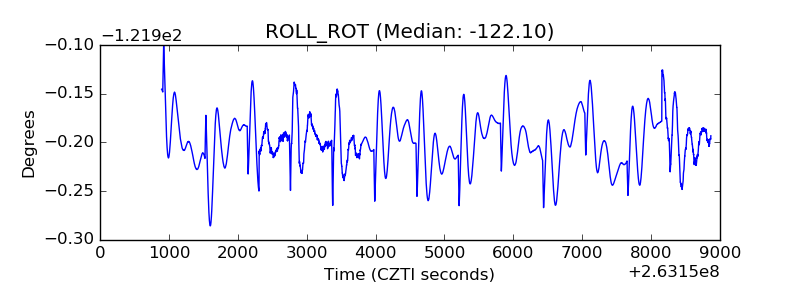 |
| _Roll_DEC | 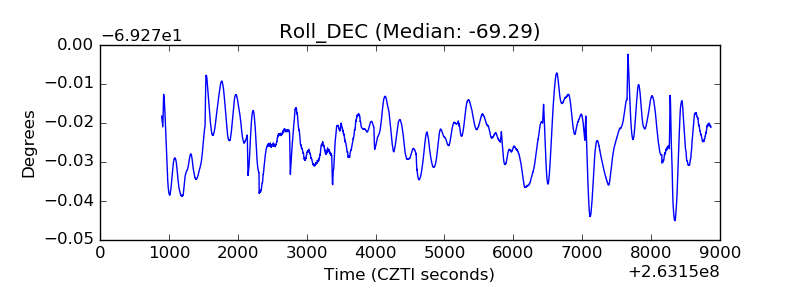 |
| _Roll_RA | 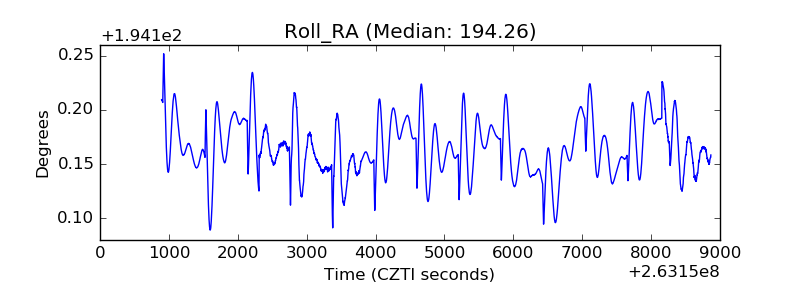 |
| Veto Counter | 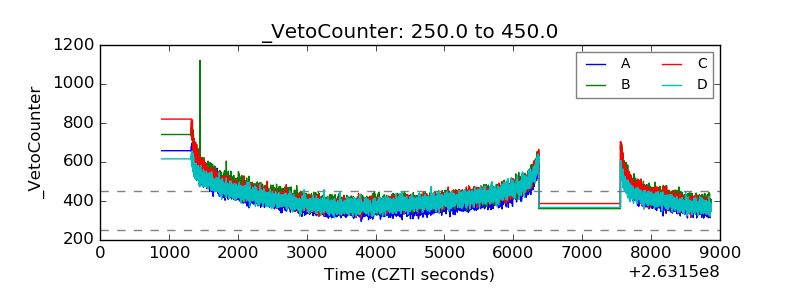 |