| Param | Original file | Final file |
|---|---|---|
| Filename | modeM0/AS1A04_162T01_9000002074_14057cztM0_level2.evt | modeM0/AS1A04_162T01_9000002074_14057cztM0_level2_quad_clean.evt |
| Size (bytes) | 494,879,040 | 129,637,440 |
| Size | 472.0 MB | 123.6 MB |
| Events in quadrant A | 3,253,416 | 885,680 |
| Events in quadrant B | 3,675,523 | 892,849 |
| Events in quadrant C | 3,159,451 | 854,860 |
| Events in quadrant D | 4,437,364 | 819,078 |
| Mode M0 | |||
|---|---|---|---|
| Quadrant | BADHDUFLAG | Total packets | Discarded packets |
| A | 0 | 14143 | 3 |
| B | 0 | 15432 | 2 |
| C | 0 | 13983 | 2 |
| D | 0 | 17732 | 2 |
| Mode M9 | |||
|---|---|---|---|
| Quadrant | BADHDUFLAG | Total packets | Discarded packets |
| A | 0 | 10 | 0 |
| B | 0 | 10 | 0 |
| C | 0 | 10 | 0 |
| D | 0 | 11 | 0 |
| Mode SS | |||
|---|---|---|---|
| Quadrant | BADHDUFLAG | Total packets | Discarded packets |
| A | 0 | 138 | 0 |
| B | 0 | 138 | 0 |
| C | 0 | 138 | 0 |
| D | 0 | 138 | 0 |
| Quadrant | Total seconds | Saturated seconds | Saturation percentage |
|---|---|---|---|
| A | 6802 | 17 | 0.249926% |
| B | 6802 | 125 | 1.837695% |
| C | 6802 | 15 | 0.220523% |
| D | 6802 | 110 | 1.617171% |
Noise dominated data is calculated using 1-second bins in cleaned event files. If a bin has >2000 counts, and if more than 50% of those come from <1% of pixels, then it is considered to be noise-dominated and hence unusable.
| Quadrant | # 1 sec bins | Bins with >0 counts | Bins with >2000 counts | High rate bins dominated by noise | Noise dominated (total time) | Noise dominated (detector-on time) | Marked lightcurve |
|---|---|---|---|---|---|---|---|
| A | 7623 | 6804 | 1 | 1 | 0.01% | 0.01% | 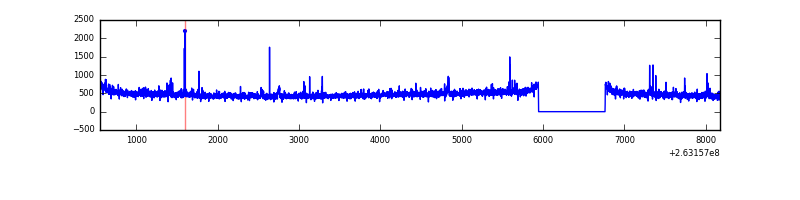 |
| B | 7623 | 6804 | 39 | 39 | 0.51% | 0.57% | 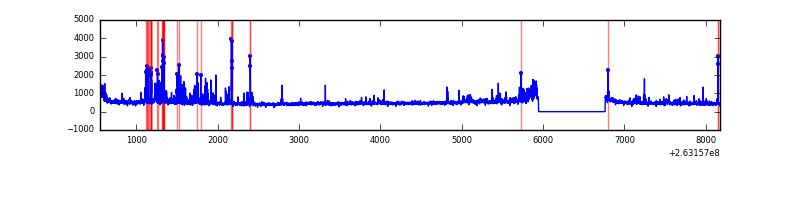 |
| C | 7623 | 6804 | 2 | 2 | 0.03% | 0.03% | 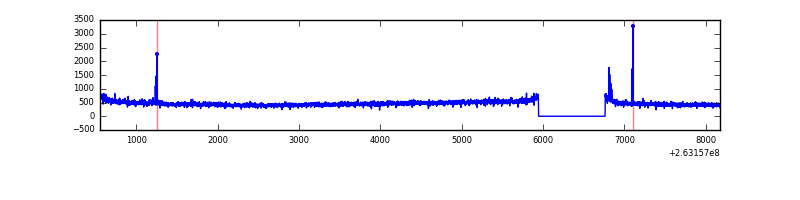 |
| D | 7623 | 6804 | 92 | 92 | 1.21% | 1.35% | 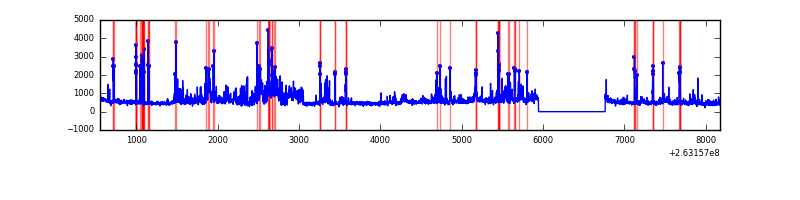 |
Top three noisy pixels from each quadrant. If the there are fewer than three noisy pixels in the level2.evt file, extra rows are filled as -1
| Pixel properties | Quadrant properties | ||||||
|---|---|---|---|---|---|---|---|
| Quadrant | DetID | PixID | Counts | Sigma | Mean | Median | Sigma |
| A | 12 | 189 | 80948 | 494.98 | 798 | 782 | 162.0 |
| A | 15 | 222 | 43935 | 266.45 | 798 | 782 | 162.0 |
| A | 9 | 143 | 33764 | 203.65 | 798 | 782 | 162.0 |
| B | 0 | 85 | 186679 | 1236.46 | 798 | 778 | 150.3 |
| B | 0 | 189 | 135831 | 898.26 | 798 | 778 | 150.3 |
| B | 0 | 219 | 62074 | 407.69 | 798 | 778 | 150.3 |
| C | 3 | 233 | 129870 | 736.77 | 761 | 764 | 175.2 |
| C | 9 | 15 | 32963 | 183.75 | 761 | 764 | 175.2 |
| C | 0 | 207 | 27046 | 149.98 | 761 | 764 | 175.2 |
| D | 12 | 110 | 458436 | 2459.64 | 757 | 733 | 186.1 |
| D | 1 | 52 | 356553 | 1912.14 | 757 | 733 | 186.1 |
| D | 15 | 0 | 247012 | 1323.47 | 757 | 733 | 186.1 |
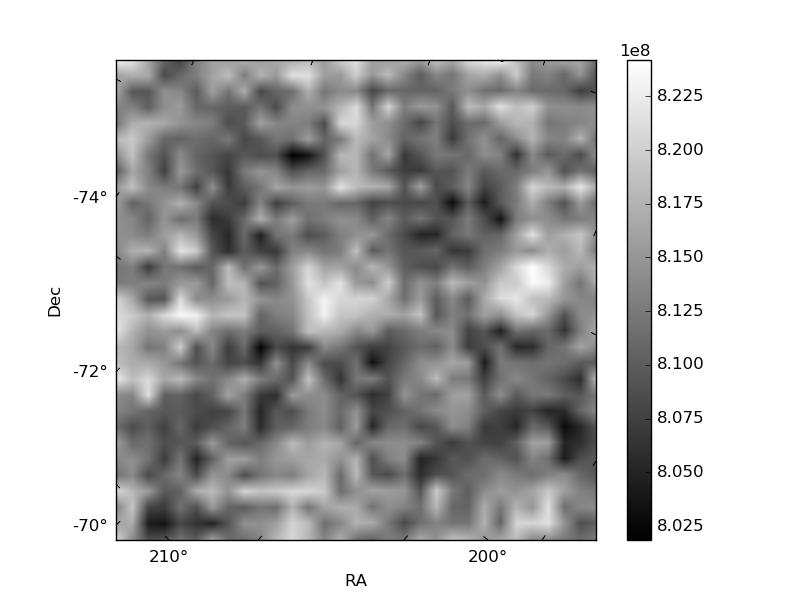
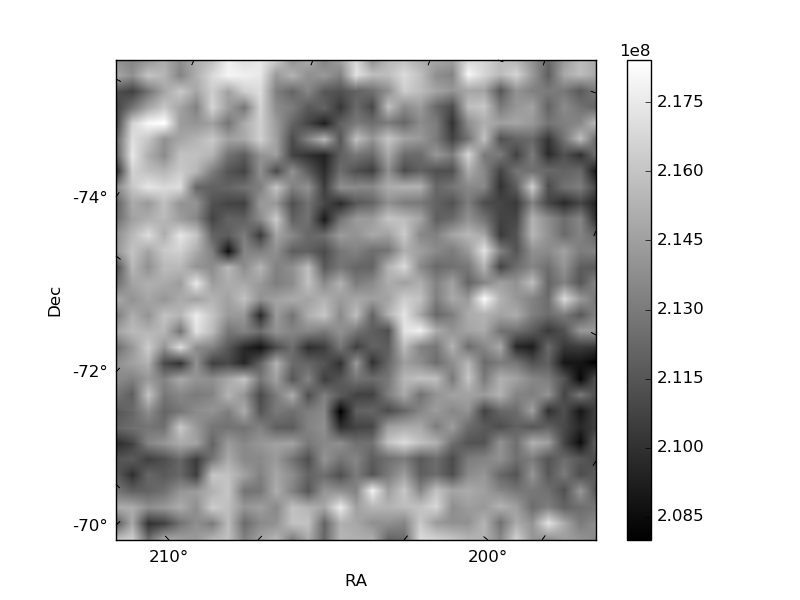
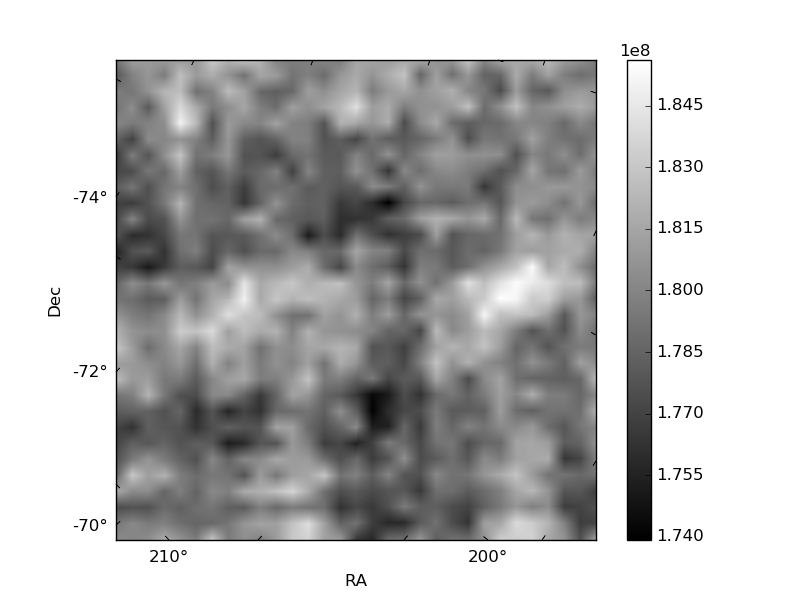
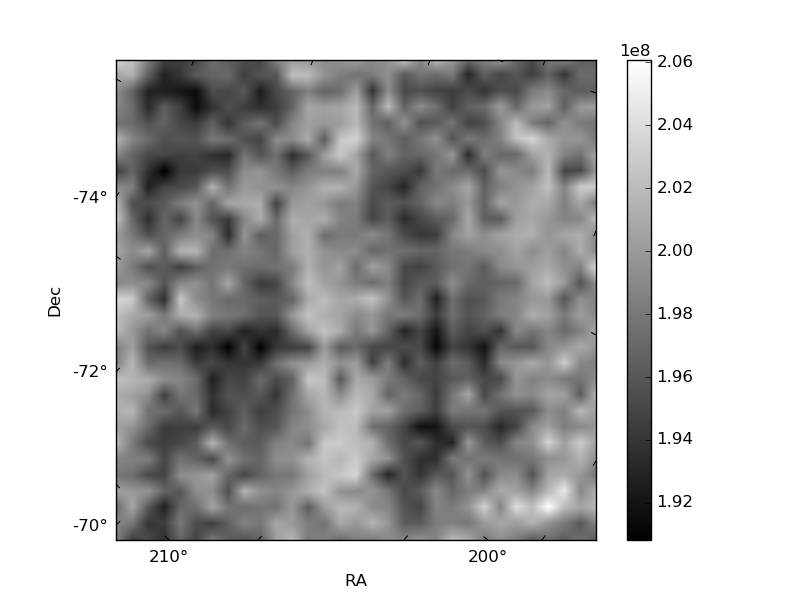
Histogram calculated using DETX and DETY for each event in the final _common_clean file
| Quadrant A | 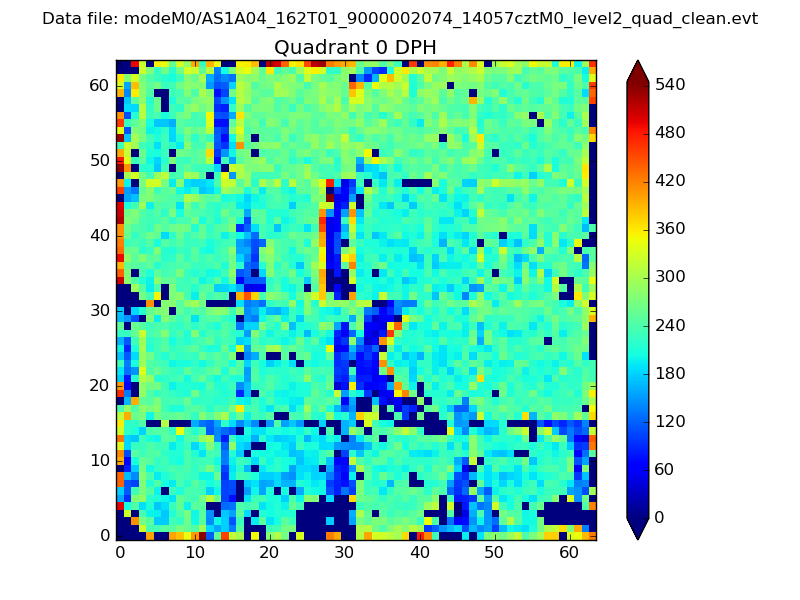 |
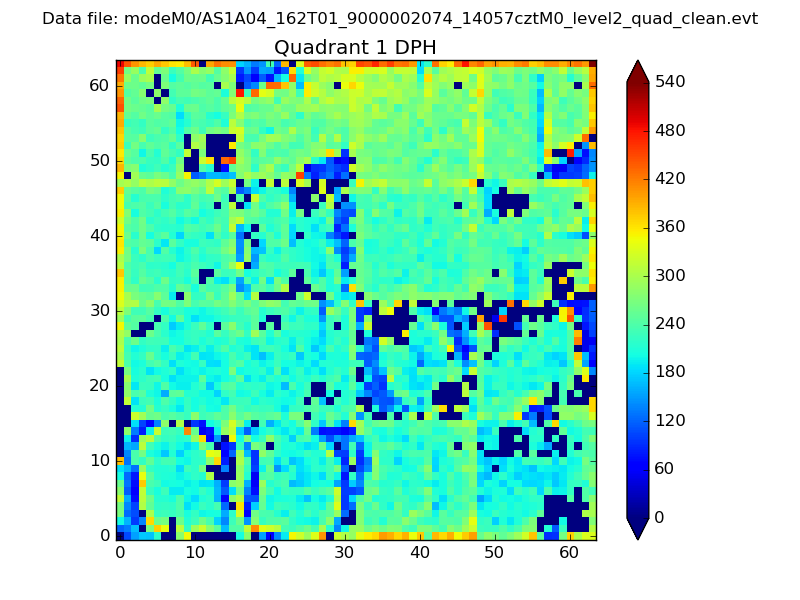 |
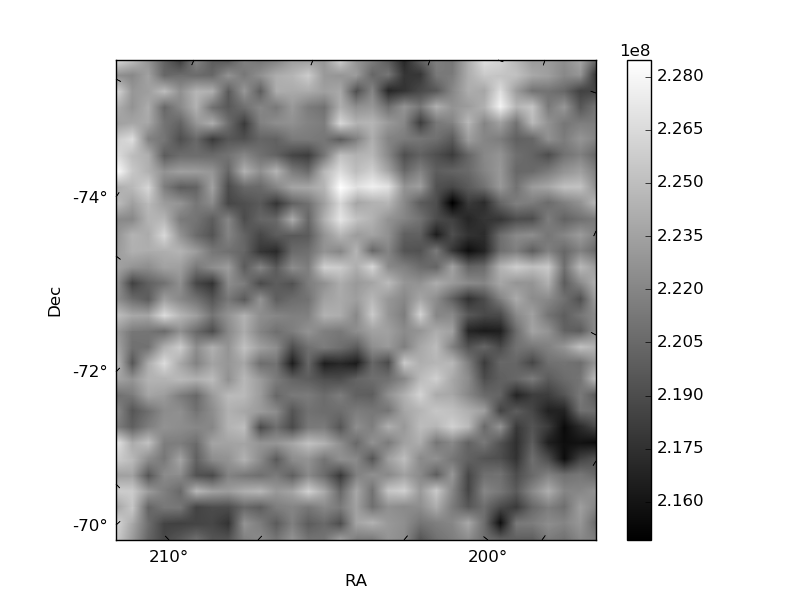
Quadrant B |
|---|---|---|---|
| Quadrant D | 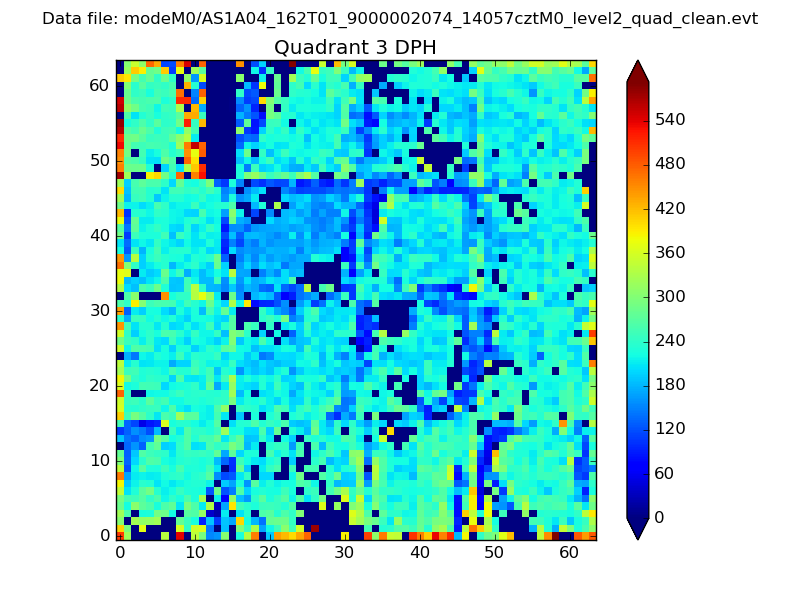 |
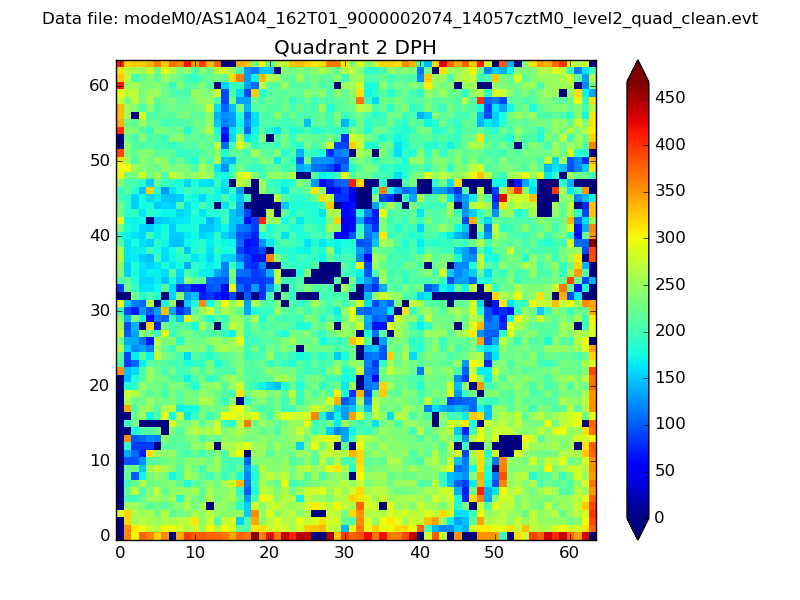 |
Quadrant C |
| Plot type | Count rate plots | Images |
|---|---|---|
| Comparison with Poisson distribution Blue bars denote a histogram of data divided into 1 sec bins. Red curve is a Poisson curve with rate = median count rate of data. |
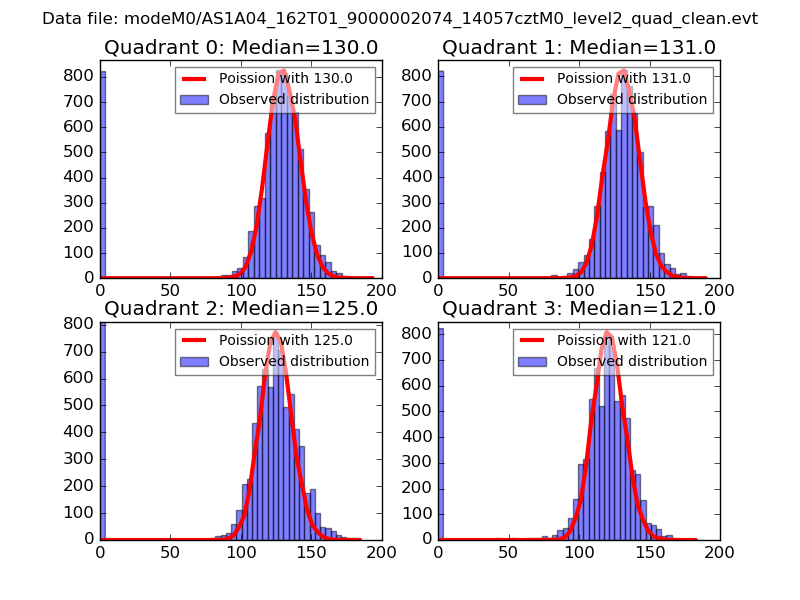 |
 |
| Quadrant-wise count rates Data is divided into 100 sec bins |
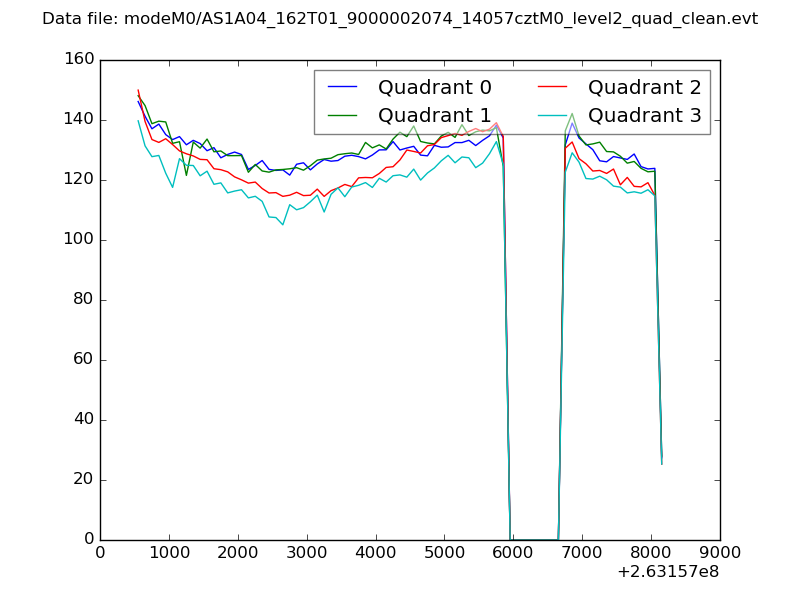 |
|
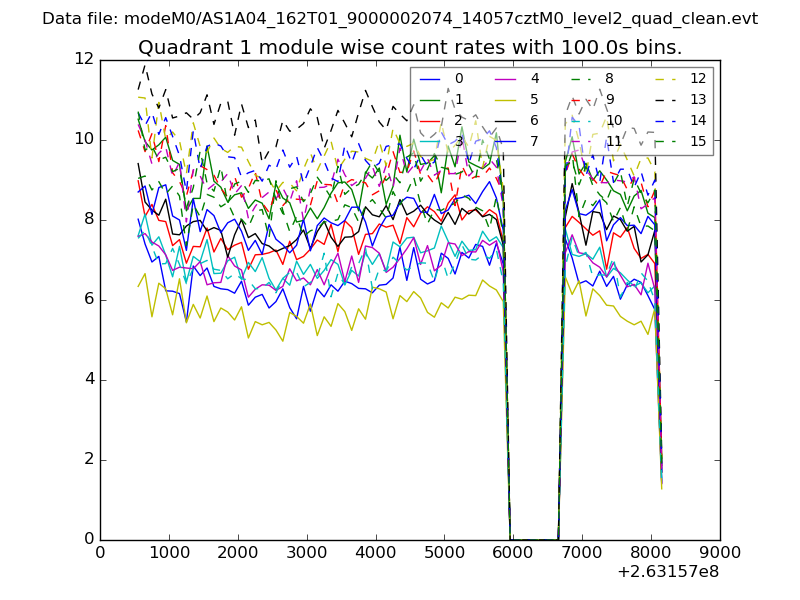
| Module-wise count rates for Quadrant A Data is divided into 100 sec bins |
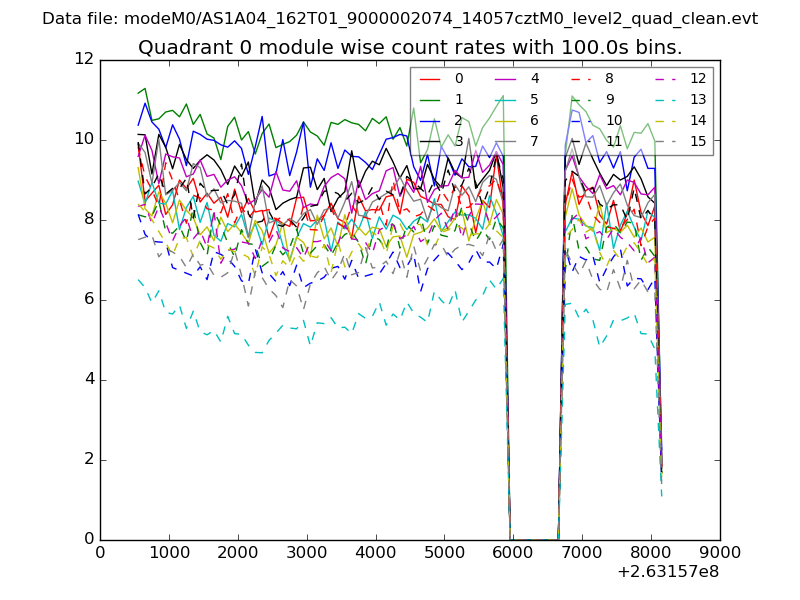 |
 |
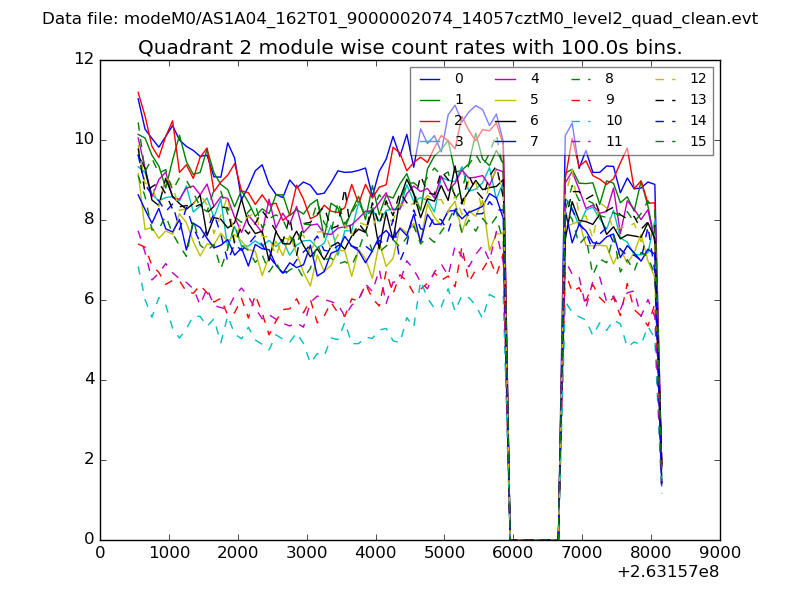
| Module-wise count rates for Quadrant B Data is divided into 100 sec bins |
 |
 |
| Module-wise count rates for Quadrant C Data is divided into 100 sec bins |
 |
 |
| Module-wise count rates for Quadrant D Data is divided into 100 sec bins |
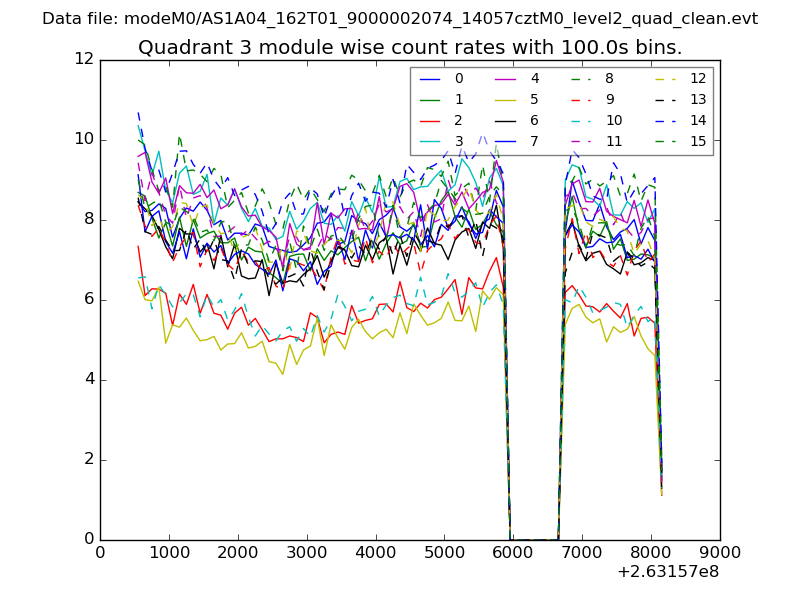 |
 |
| Parameter | Plot |
|---|---|
| CZT HV Monitor | 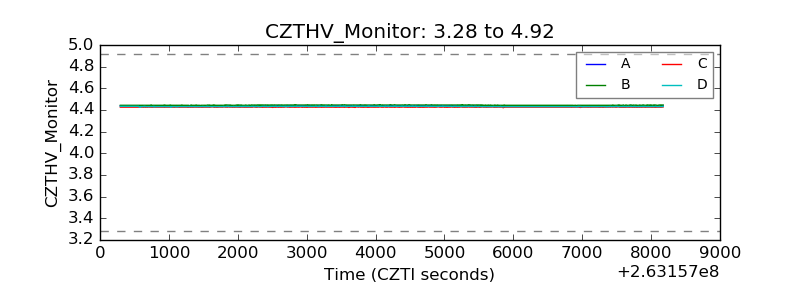 |
| D_VDD | 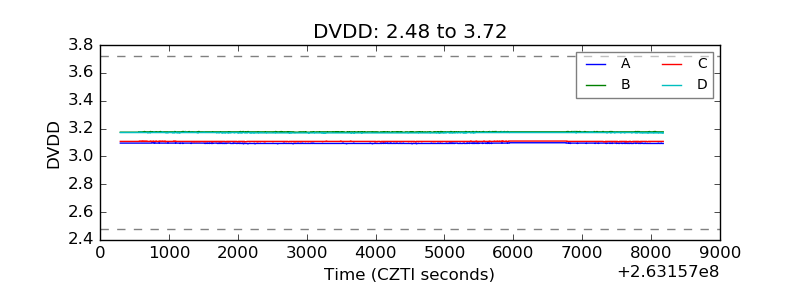 |
| Temperature 1 | 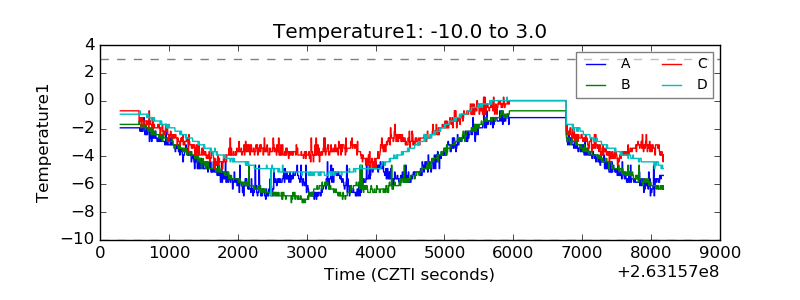 |
| Veto HV Monitor | 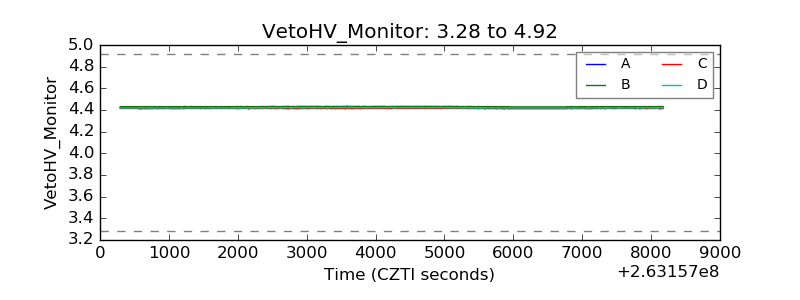 |
| Veto LLD | 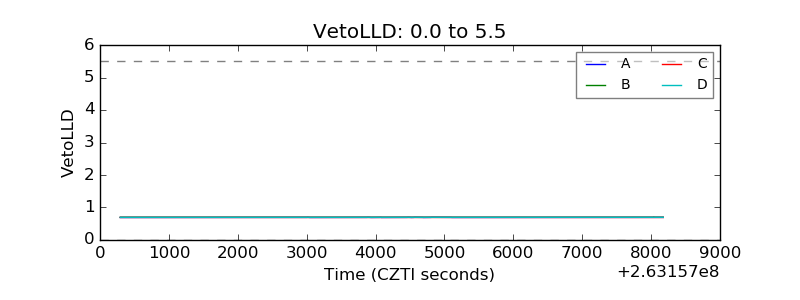 |
| Alpha Counter | 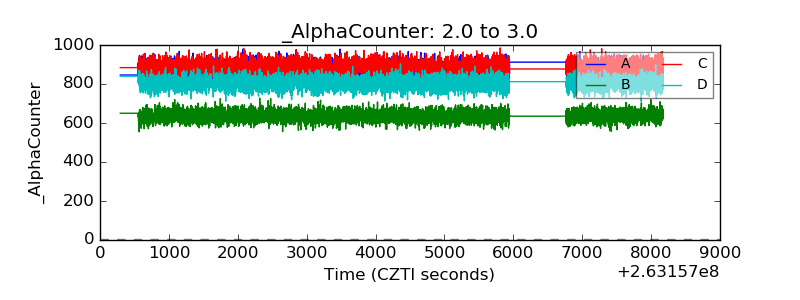 |
| _CPM_Rate | 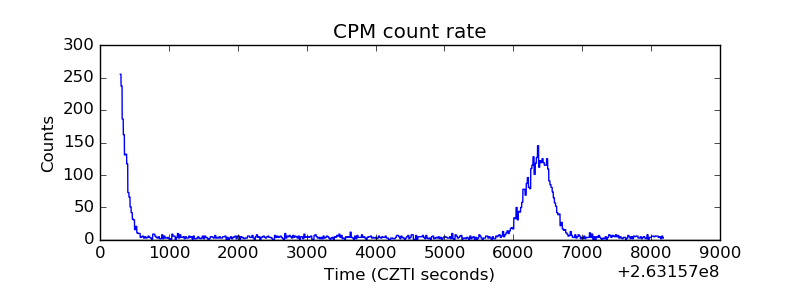 |
| CZT Counter | 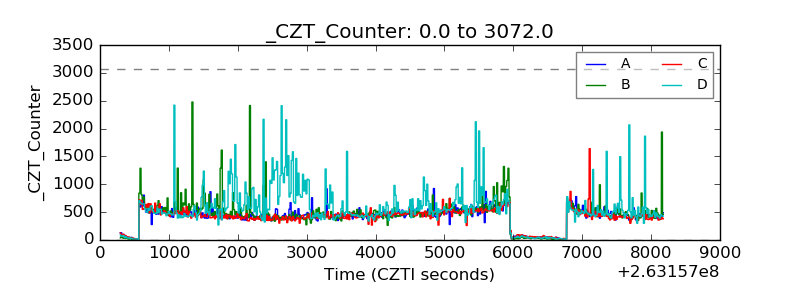 |
| +2.5 Volts monitor |  |
| +5 Volts monitor |  |
| _ROLL_ROT | 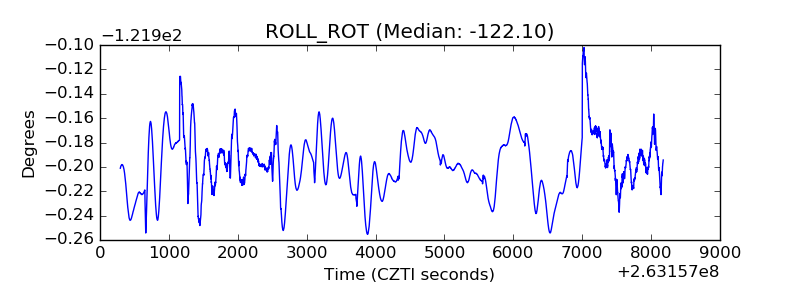 |
| _Roll_DEC | 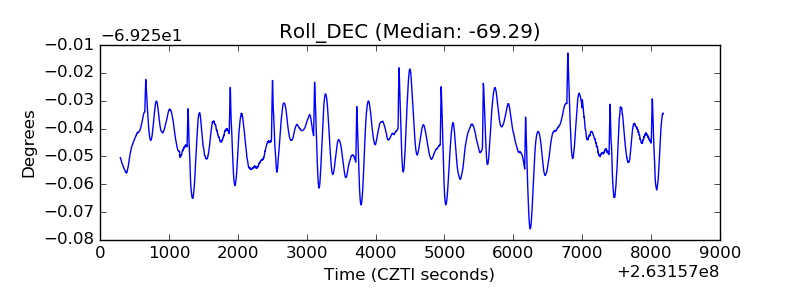 |
| _Roll_RA | 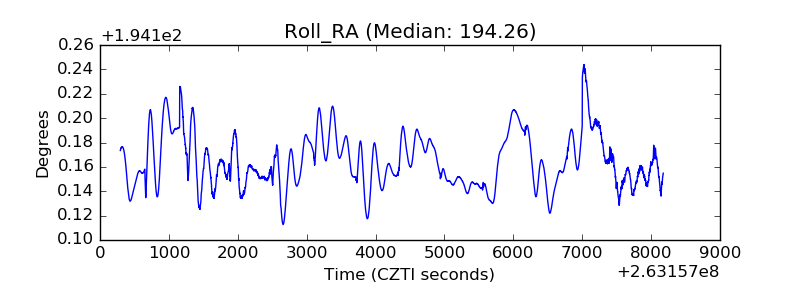 |
| Veto Counter |  |