| Param | Original file | Final file |
|---|---|---|
| Filename | modeM0/AS1A04_162T01_9000002074_14059cztM0_level2.evt | modeM0/AS1A04_162T01_9000002074_14059cztM0_level2_quad_clean.evt |
| Size (bytes) | 876,234,240 | 140,287,680 |
| Size | 835.6 MB | 133.8 MB |
| Events in quadrant A | 4,141,359 | 1,004,288 |
| Events in quadrant B | 4,114,121 | 1,017,907 |
| Events in quadrant C | 3,707,196 | 978,016 |
| Events in quadrant D | 14,026,420 | 684,170 |
| Mode M0 | |||
|---|---|---|---|
| Quadrant | BADHDUFLAG | Total packets | Discarded packets |
| A | 0 | 17960 | 4 |
| B | 0 | 17725 | 2 |
| C | 0 | 16616 | 2 |
| D | 0 | 47308 | 2 |
| Mode M9 | |||
|---|---|---|---|
| Quadrant | BADHDUFLAG | Total packets | Discarded packets |
| A | 0 | 7 | 0 |
| B | 0 | 7 | 0 |
| C | 0 | 7 | 0 |
| D | 0 | 7 | 0 |
| Mode SS | |||
|---|---|---|---|
| Quadrant | BADHDUFLAG | Total packets | Discarded packets |
| A | 0 | 166 | 0 |
| B | 0 | 166 | 0 |
| C | 0 | 166 | 0 |
| D | 0 | 166 | 0 |
| Quadrant | Total seconds | Saturated seconds | Saturation percentage |
|---|---|---|---|
| A | 8101 | 186 | 2.296013% |
| B | 8101 | 169 | 2.086162% |
| C | 8101 | 99 | 1.222071% |
| D | 8101 | 4320 | 53.326750% |
Noise dominated data is calculated using 1-second bins in cleaned event files. If a bin has >2000 counts, and if more than 50% of those come from <1% of pixels, then it is considered to be noise-dominated and hence unusable.
| Quadrant | # 1 sec bins | Bins with >0 counts | Bins with >2000 counts | High rate bins dominated by noise | Noise dominated (total time) | Noise dominated (detector-on time) | Marked lightcurve |
|---|---|---|---|---|---|---|---|
| A | 8703 | 8106 | 51 | 51 | 0.59% | 0.63% |  |
| B | 8703 | 8106 | 11 | 11 | 0.13% | 0.14% | 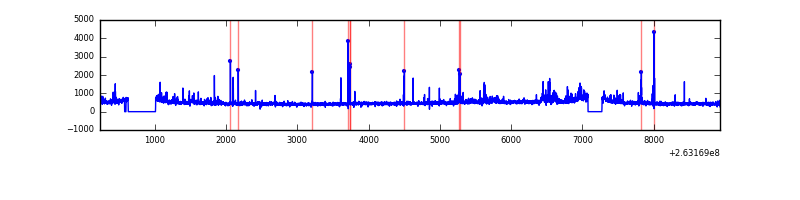 |
| C | 8703 | 8106 | 5 | 5 | 0.06% | 0.06% | 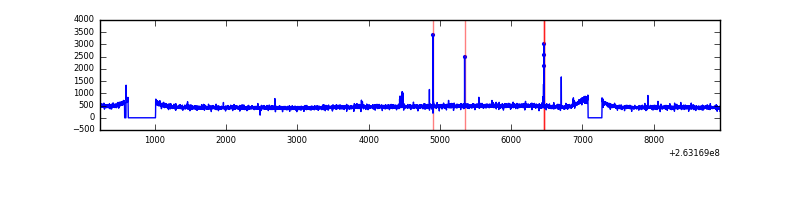 |
| D | 8703 | 8106 | 3890 | 3890 | 44.70% | 47.99% | 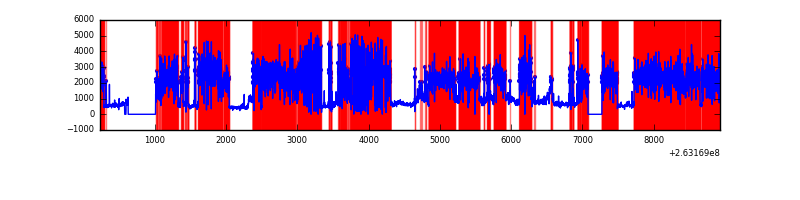 |
Top three noisy pixels from each quadrant. If the there are fewer than three noisy pixels in the level2.evt file, extra rows are filled as -1
| Pixel properties | Quadrant properties | ||||||
|---|---|---|---|---|---|---|---|
| Quadrant | DetID | PixID | Counts | Sigma | Mean | Median | Sigma |
| A | 9 | 143 | 339990 | 1776.43 | 939 | 919 | 190.9 |
| A | 12 | 189 | 94644 | 491.04 | 939 | 919 | 190.9 |
| A | 15 | 69 | 33753 | 172.02 | 939 | 919 | 190.9 |
| B | 0 | 189 | 118072 | 655.26 | 945 | 919 | 178.8 |
| B | 0 | 219 | 71156 | 392.85 | 945 | 919 | 178.8 |
| B | 4 | 80 | 62305 | 343.34 | 945 | 919 | 178.8 |
| C | 3 | 233 | 129010 | 613.26 | 907 | 910 | 208.9 |
| C | 0 | 207 | 24183 | 111.42 | 907 | 910 | 208.9 |
| C | 12 | 4 | 10744 | 47.08 | 907 | 910 | 208.9 |
| D | 1 | 52 | 9622625 | 50907.61 | 692 | 675 | 189.0 |
| D | 8 | 195 | 711469 | 3760.65 | 692 | 675 | 189.0 |
| D | 12 | 110 | 544846 | 2879.09 | 692 | 675 | 189.0 |
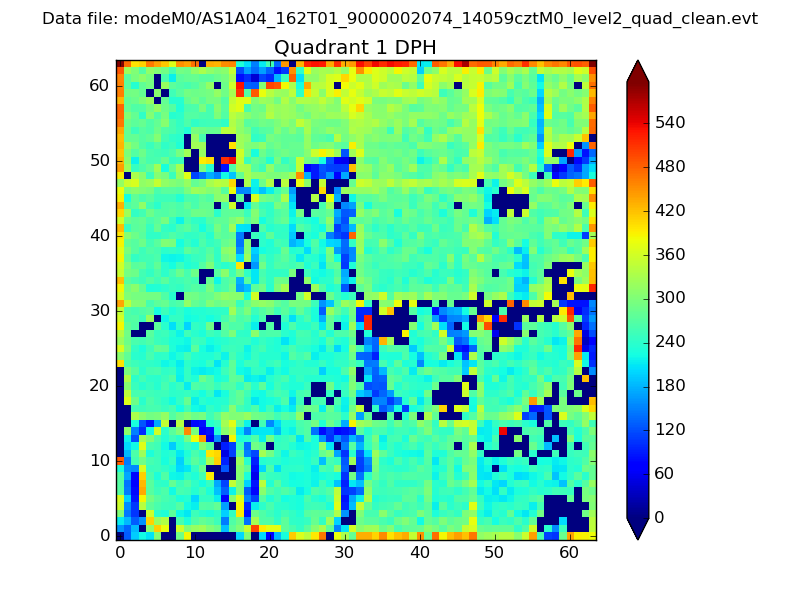
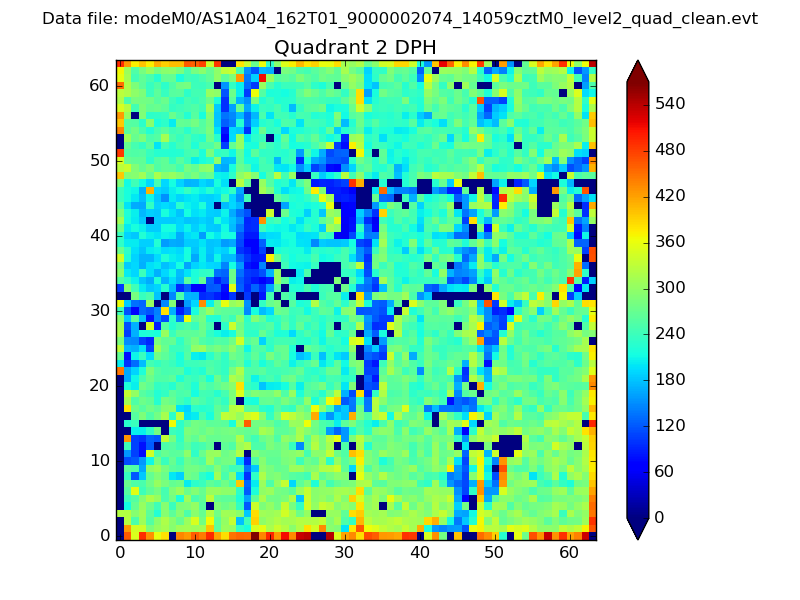
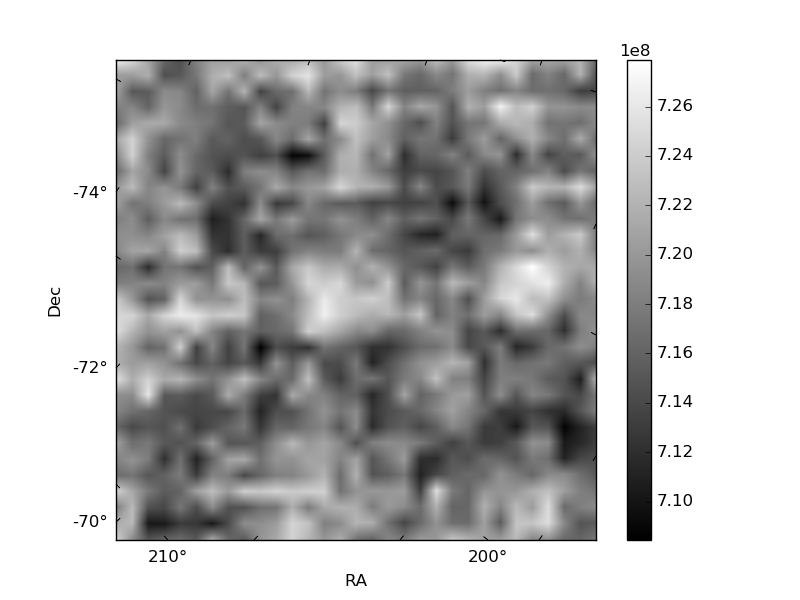
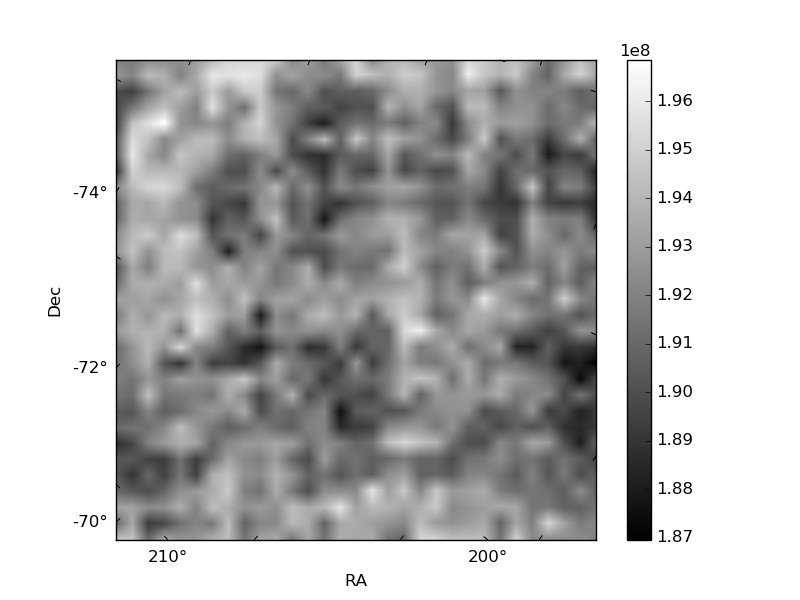
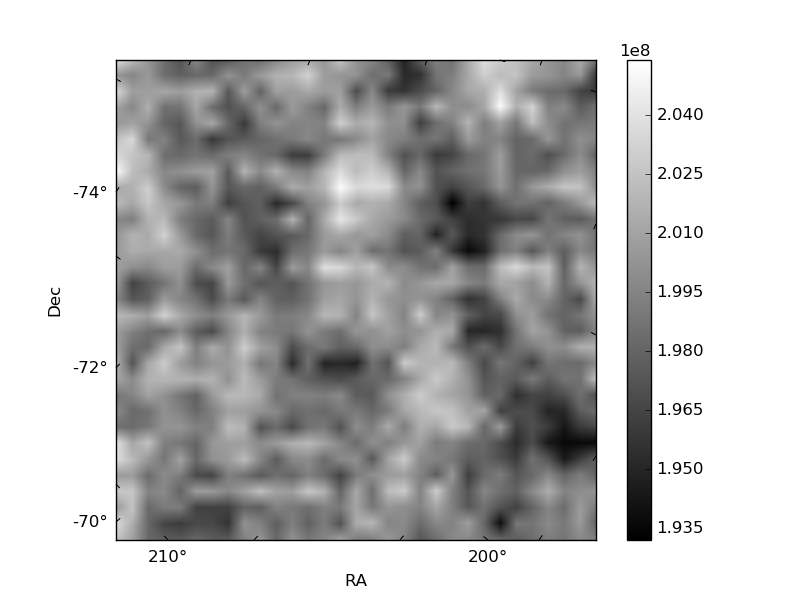
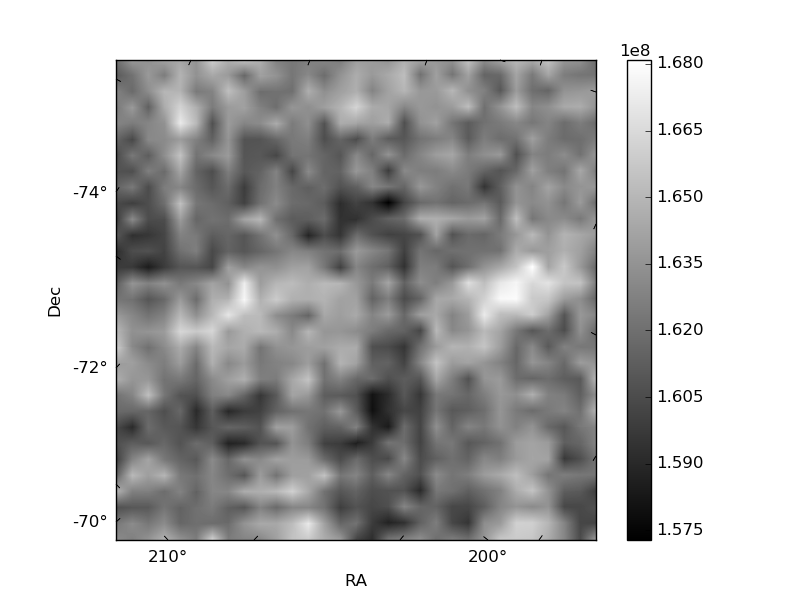
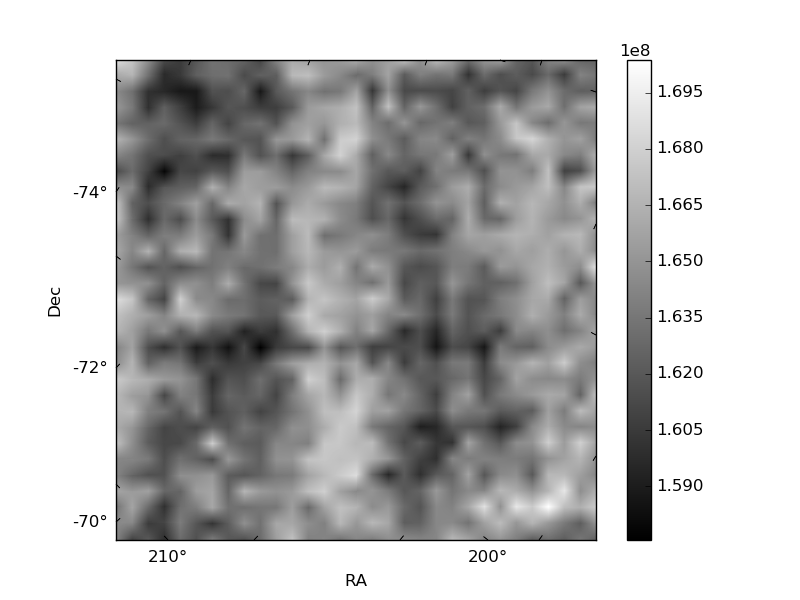
Histogram calculated using DETX and DETY for each event in the final _common_clean file
| Quadrant A | 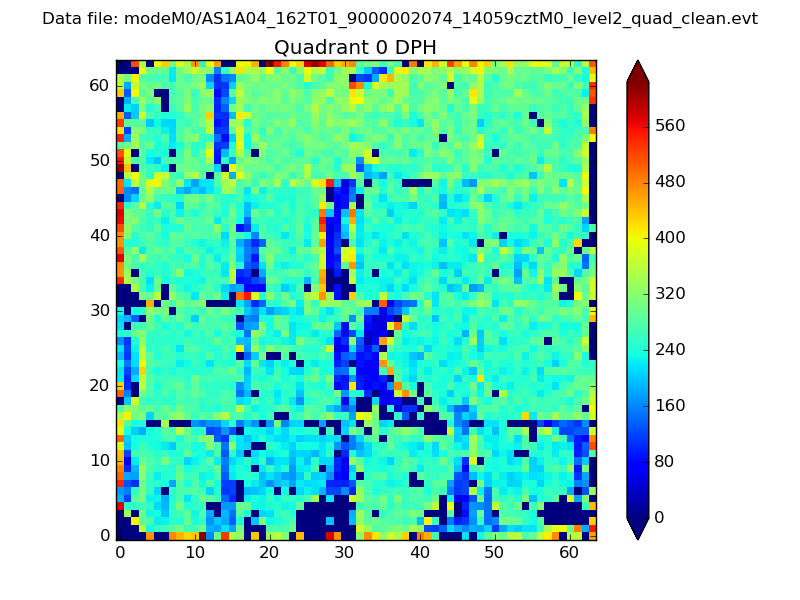 |
 |
Quadrant B |
|---|---|---|---|
| Quadrant D | 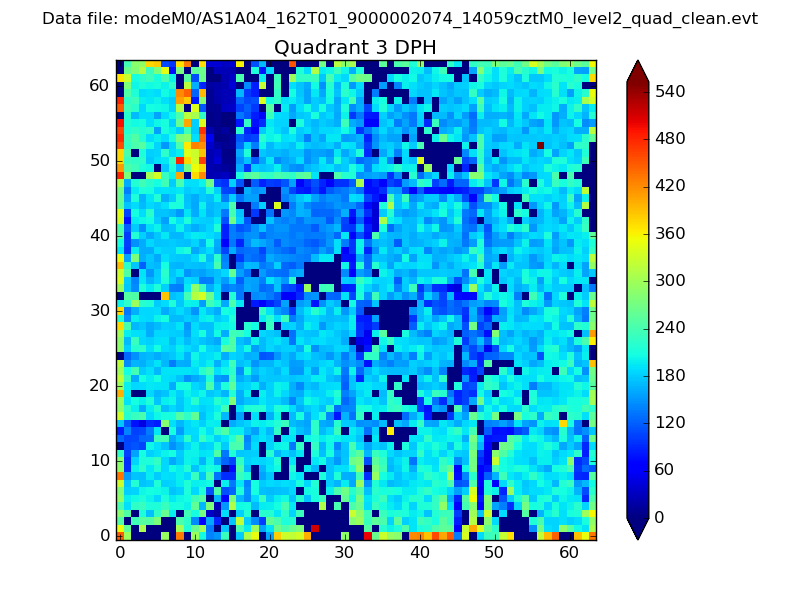 |
 |
Quadrant C |
| Plot type | Count rate plots | Images |
|---|---|---|
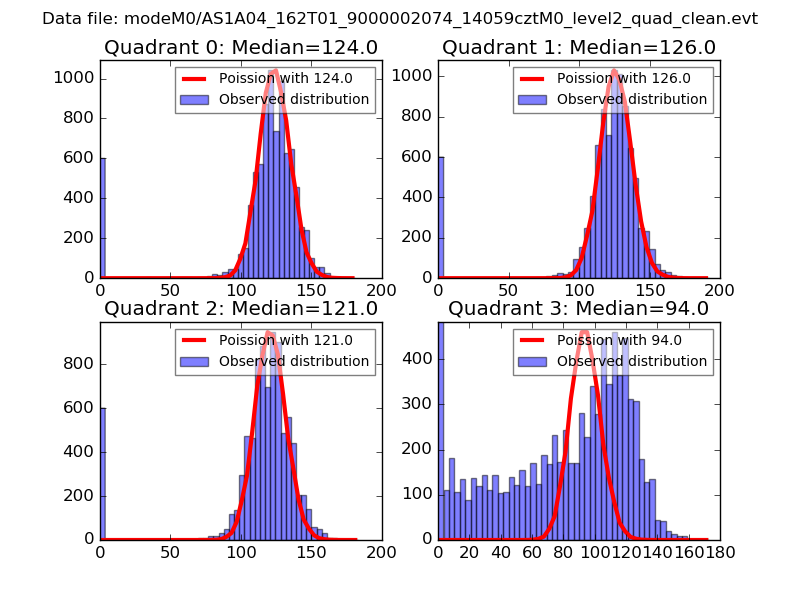
| Comparison with Poisson distribution Blue bars denote a histogram of data divided into 1 sec bins. Red curve is a Poisson curve with rate = median count rate of data. |
 |
 |
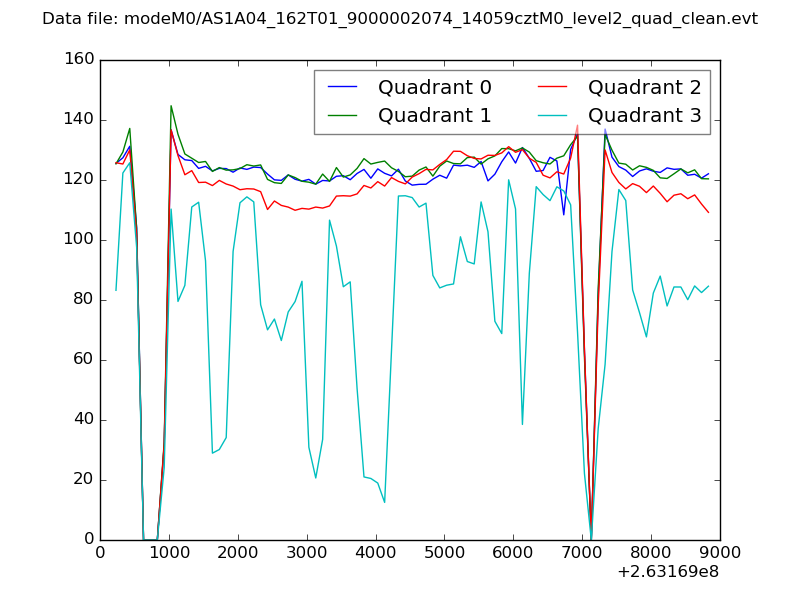
| Quadrant-wise count rates Data is divided into 100 sec bins |
 |
|
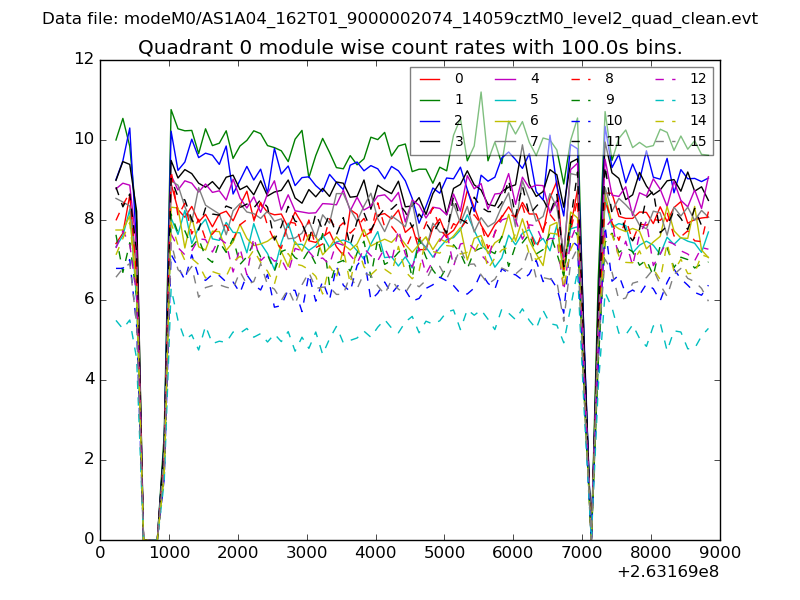
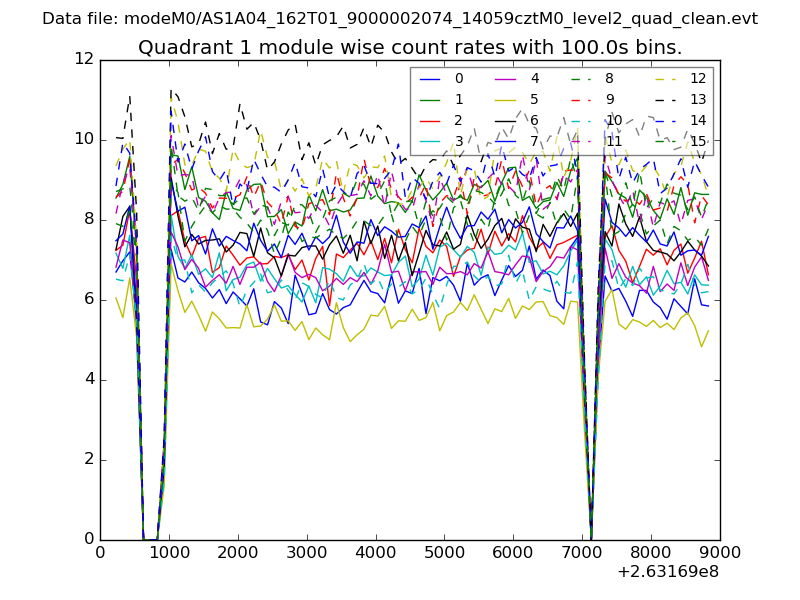
| Module-wise count rates for Quadrant A Data is divided into 100 sec bins |
 |
 |
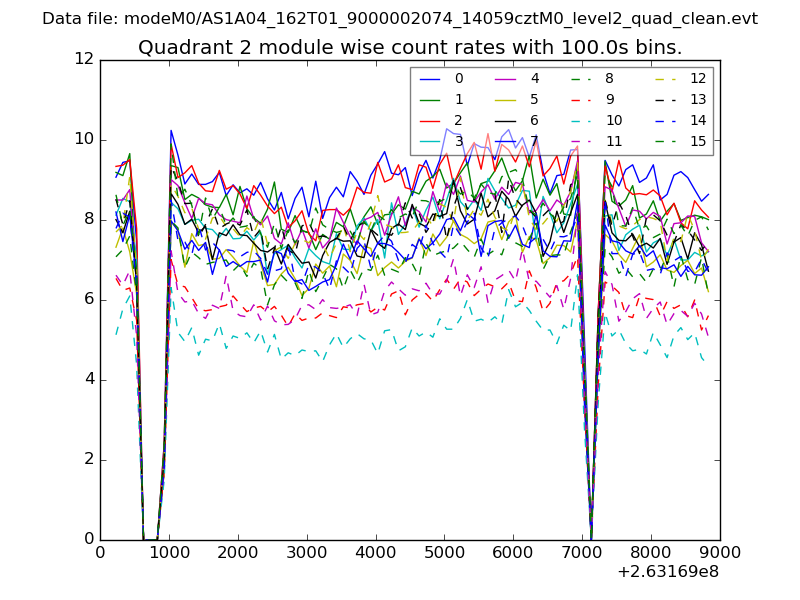
| Module-wise count rates for Quadrant B Data is divided into 100 sec bins |
 |
 |
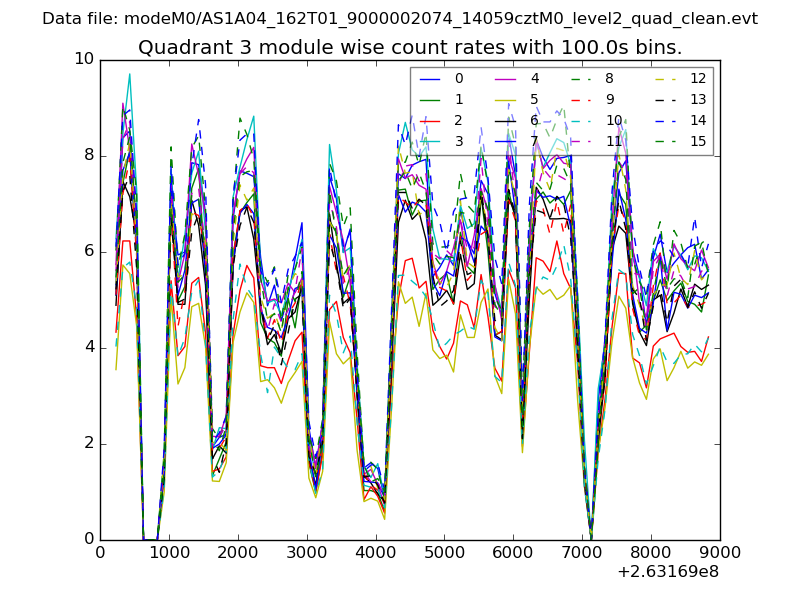
| Module-wise count rates for Quadrant C Data is divided into 100 sec bins |
 |
 |
| Module-wise count rates for Quadrant D Data is divided into 100 sec bins |
 |
 |
| Parameter | Plot |
|---|---|
| CZT HV Monitor | 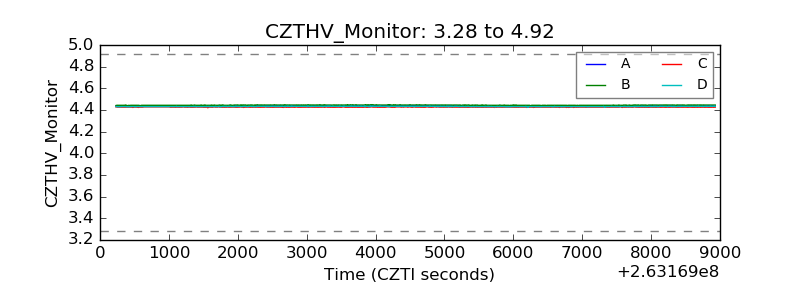 |
| D_VDD | 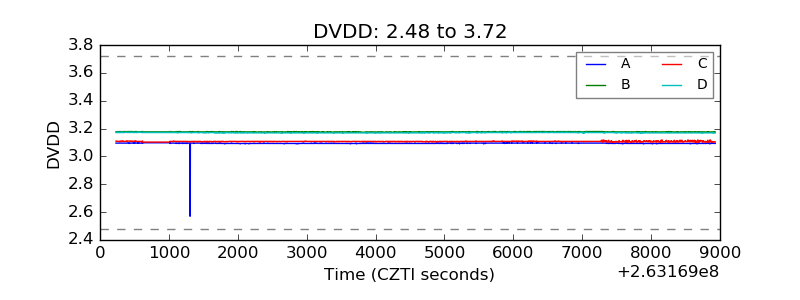 |
| Temperature 1 | 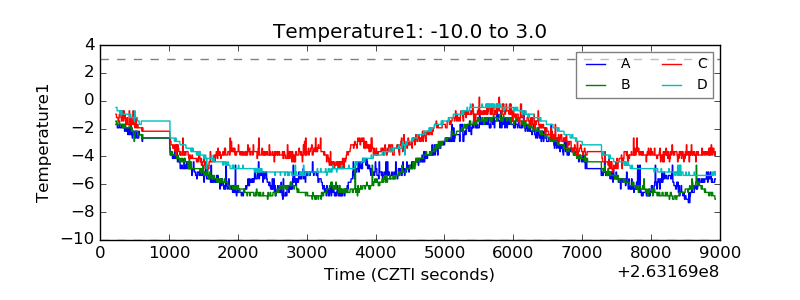 |
| Veto HV Monitor | 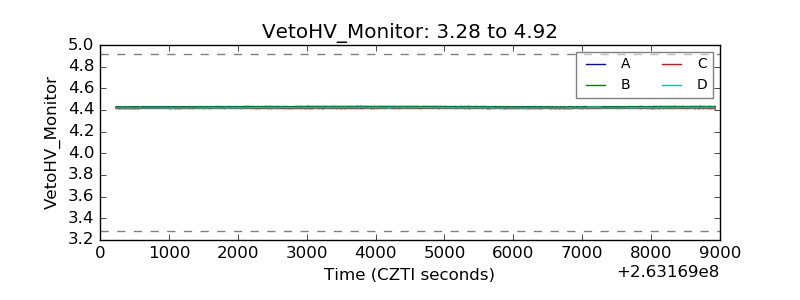 |
| Veto LLD | 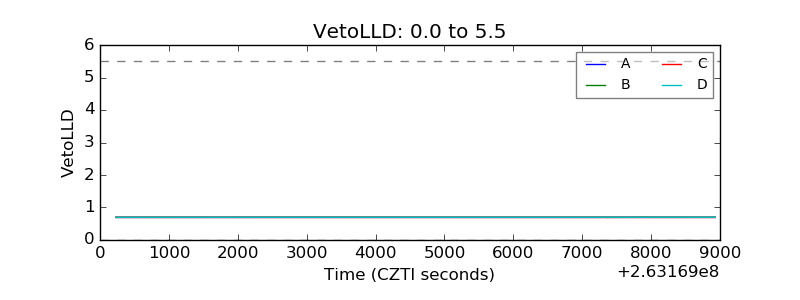 |
| Alpha Counter | 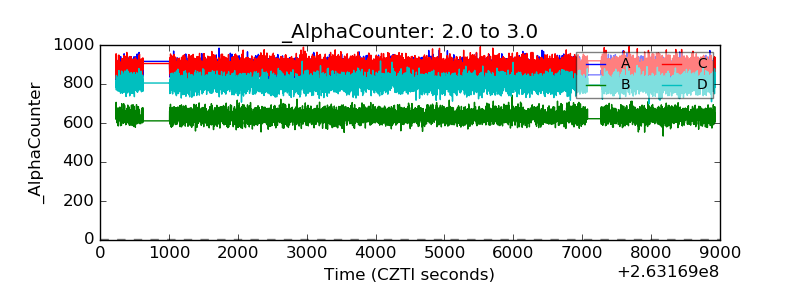 |
| _CPM_Rate | 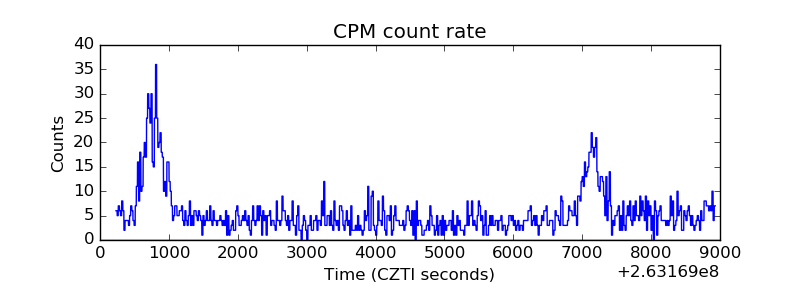 |
| CZT Counter | 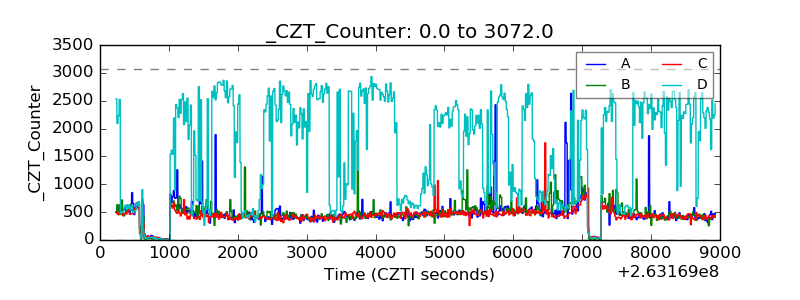 |
| +2.5 Volts monitor |  |
| +5 Volts monitor |  |
| _ROLL_ROT | 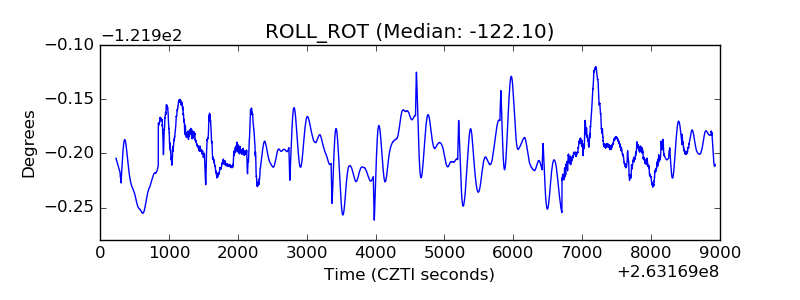 |
| _Roll_DEC | 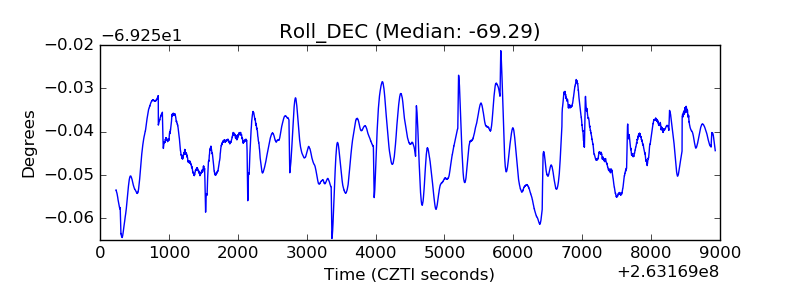 |
| _Roll_RA | 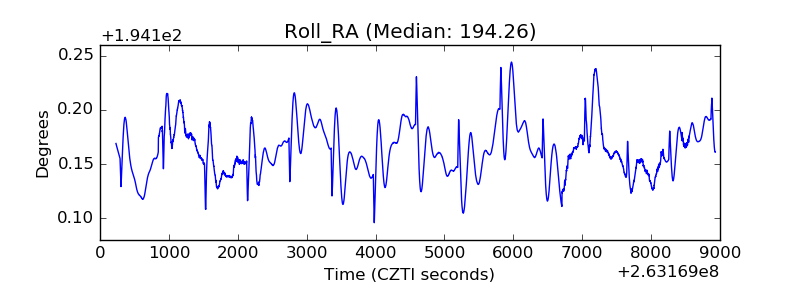 |
| Veto Counter | 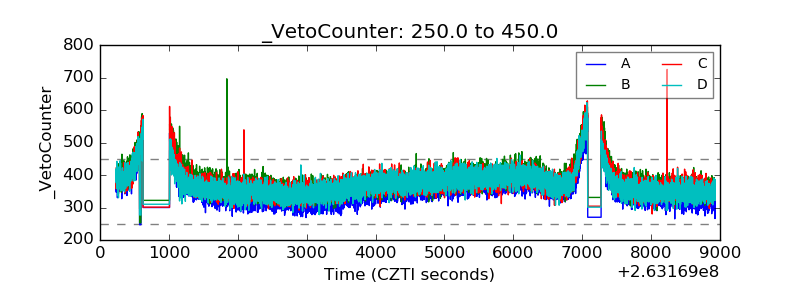 |