| Param | Original file | Final file |
|---|---|---|
| Filename | modeM0/AS1A04_162T01_9000002074_14060cztM0_level2.evt | modeM0/AS1A04_162T01_9000002074_14060cztM0_level2_quad_clean.evt |
| Size (bytes) | 752,613,120 | 131,581,440 |
| Size | 717.7 MB | 125.5 MB |
| Events in quadrant A | 3,559,499 | 928,132 |
| Events in quadrant B | 3,804,460 | 936,004 |
| Events in quadrant C | 3,464,790 | 897,720 |
| Events in quadrant D | 11,453,901 | 697,680 |
| Mode M0 | |||
|---|---|---|---|
| Quadrant | BADHDUFLAG | Total packets | Discarded packets |
| A | 0 | 15804 | 3 |
| B | 0 | 16346 | 2 |
| C | 0 | 15376 | 2 |
| D | 0 | 38976 | 2 |
| Mode M9 | |||
|---|---|---|---|
| Quadrant | BADHDUFLAG | Total packets | Discarded packets |
| A | 0 | 3 | 0 |
| B | 0 | 3 | 0 |
| C | 0 | 3 | 0 |
| D | 0 | 3 | 0 |
| Mode SS | |||
|---|---|---|---|
| Quadrant | BADHDUFLAG | Total packets | Discarded packets |
| A | 0 | 154 | 0 |
| B | 0 | 154 | 0 |
| C | 0 | 154 | 0 |
| D | 0 | 154 | 0 |
| Quadrant | Total seconds | Saturated seconds | Saturation percentage |
|---|---|---|---|
| A | 7530 | 78 | 1.035857% |
| B | 7530 | 120 | 1.593625% |
| C | 7530 | 44 | 0.584329% |
| D | 7531 | 3239 | 43.008897% |
Noise dominated data is calculated using 1-second bins in cleaned event files. If a bin has >2000 counts, and if more than 50% of those come from <1% of pixels, then it is considered to be noise-dominated and hence unusable.
| Quadrant | # 1 sec bins | Bins with >0 counts | Bins with >2000 counts | High rate bins dominated by noise | Noise dominated (total time) | Noise dominated (detector-on time) | Marked lightcurve |
|---|---|---|---|---|---|---|---|
| A | 7871 | 7532 | 11 | 11 | 0.14% | 0.15% | 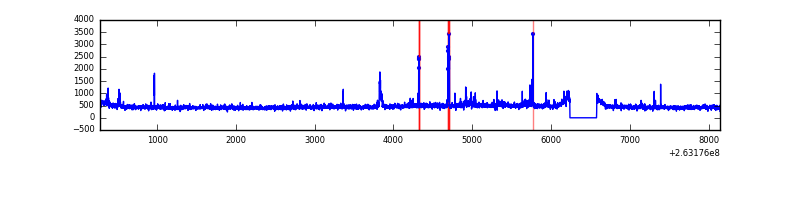 |
| B | 7871 | 7532 | 28 | 28 | 0.36% | 0.37% | 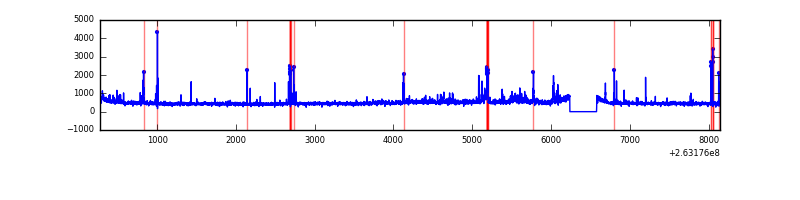 |
| C | 7871 | 7532 | 2 | 2 | 0.03% | 0.03% | 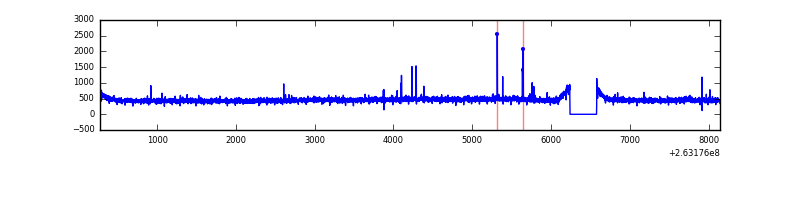 |
| D | 7872 | 7533 | 3006 | 3006 | 38.19% | 39.90% | 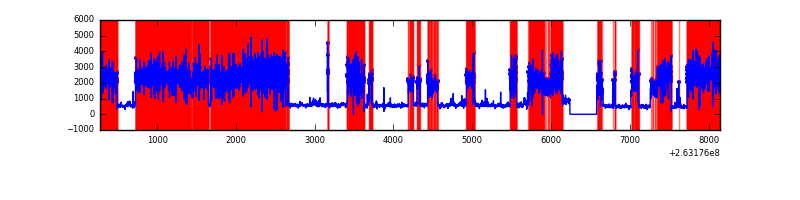 |
Top three noisy pixels from each quadrant. If the there are fewer than three noisy pixels in the level2.evt file, extra rows are filled as -1
| Pixel properties | Quadrant properties | ||||||
|---|---|---|---|---|---|---|---|
| Quadrant | DetID | PixID | Counts | Sigma | Mean | Median | Sigma |
| A | 12 | 189 | 121190 | 673.82 | 868 | 847 | 178.6 |
| A | 9 | 143 | 80746 | 447.37 | 868 | 847 | 178.6 |
| A | 8 | 15 | 13900 | 73.09 | 868 | 847 | 178.6 |
| B | 4 | 80 | 79511 | 472.74 | 873 | 850 | 166.4 |
| B | 0 | 189 | 74333 | 441.62 | 873 | 850 | 166.4 |
| B | 10 | 245 | 63702 | 377.73 | 873 | 850 | 166.4 |
| C | 3 | 233 | 146657 | 750.2 | 841 | 842 | 194.4 |
| C | 0 | 207 | 25514 | 126.93 | 841 | 842 | 194.4 |
| C | 8 | 128 | 7910 | 36.36 | 841 | 842 | 194.4 |
| D | 1 | 52 | 7676879 | 41397.56 | 696 | 681 | 185.4 |
| D | 8 | 195 | 625951 | 3372.07 | 696 | 681 | 185.4 |
| D | 12 | 110 | 157186 | 844.03 | 696 | 681 | 185.4 |
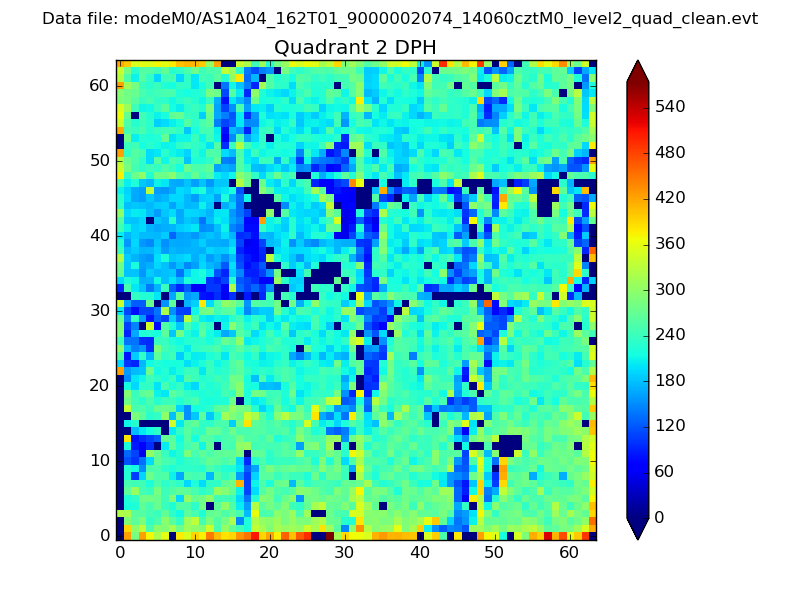
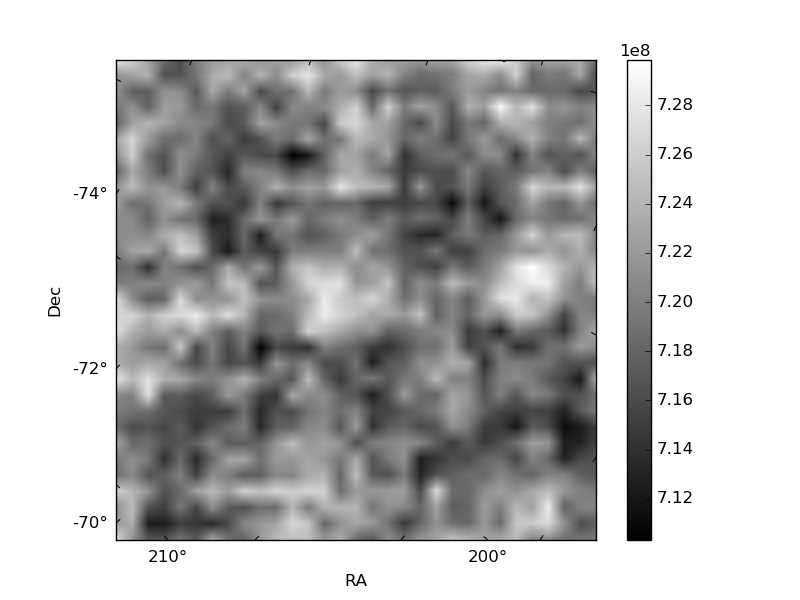
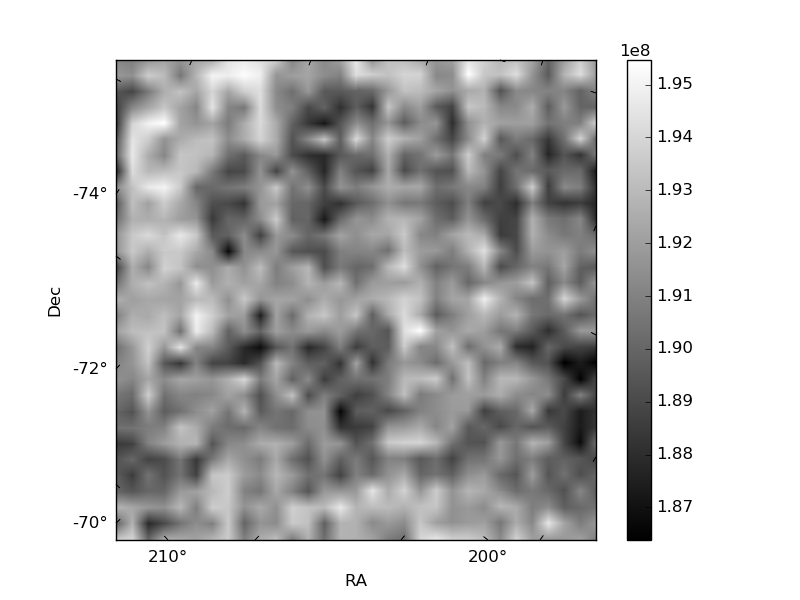
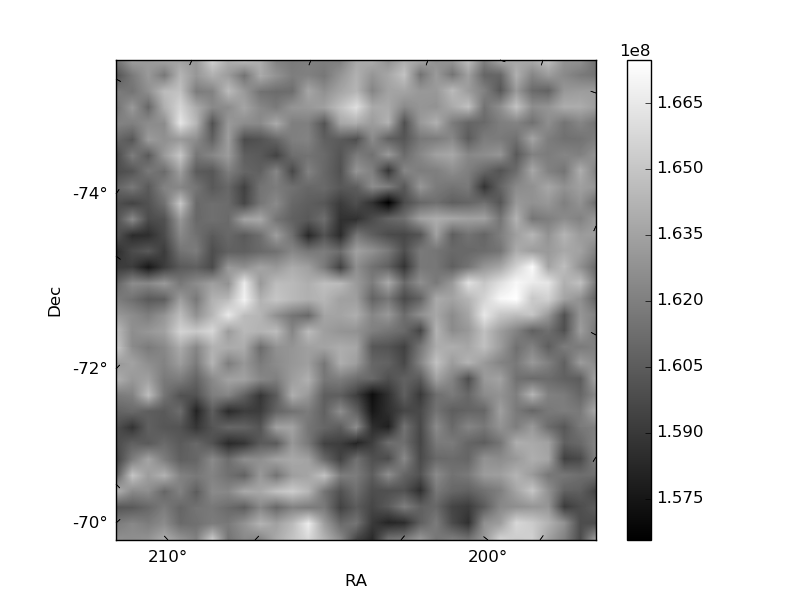
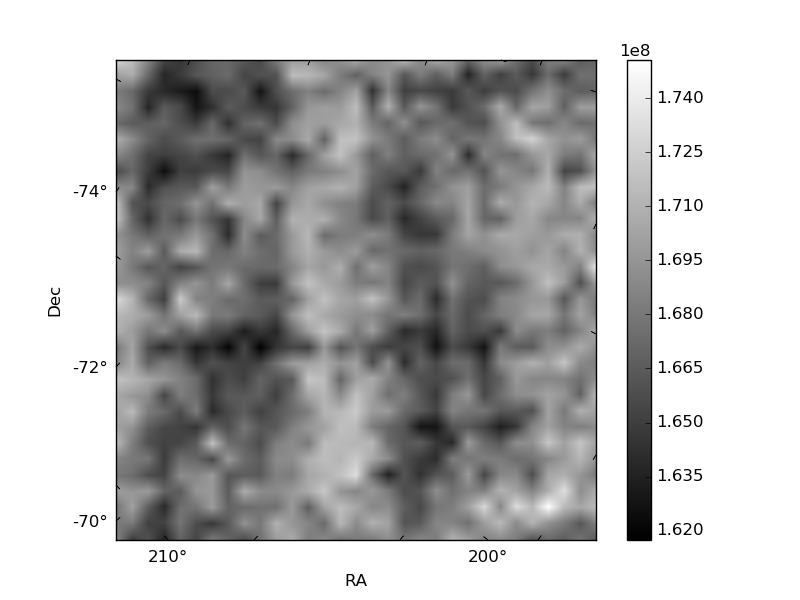
Histogram calculated using DETX and DETY for each event in the final _common_clean file
| Quadrant A | 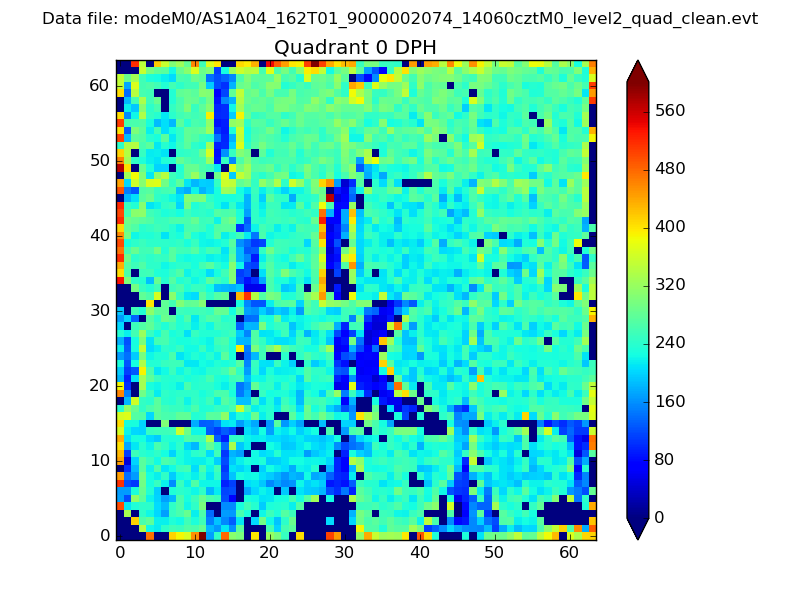 |
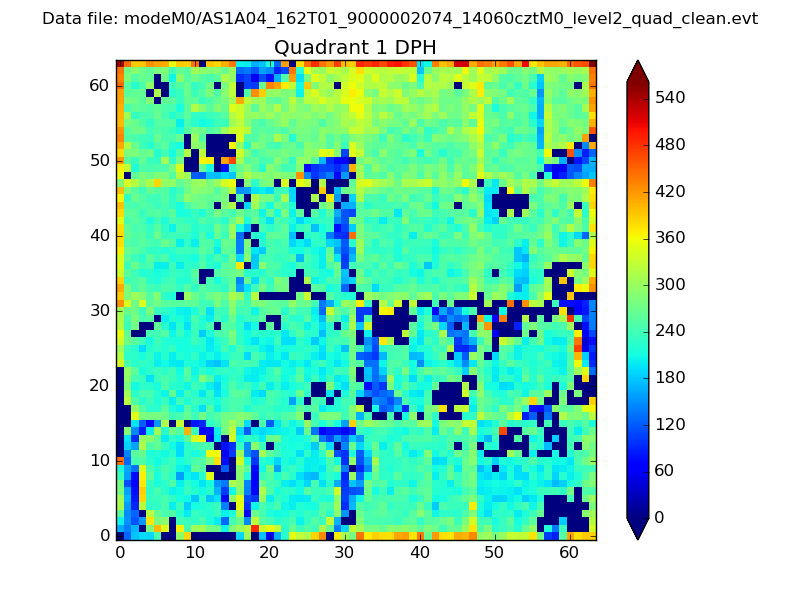 |
Quadrant B |
|---|---|---|---|
| Quadrant D | 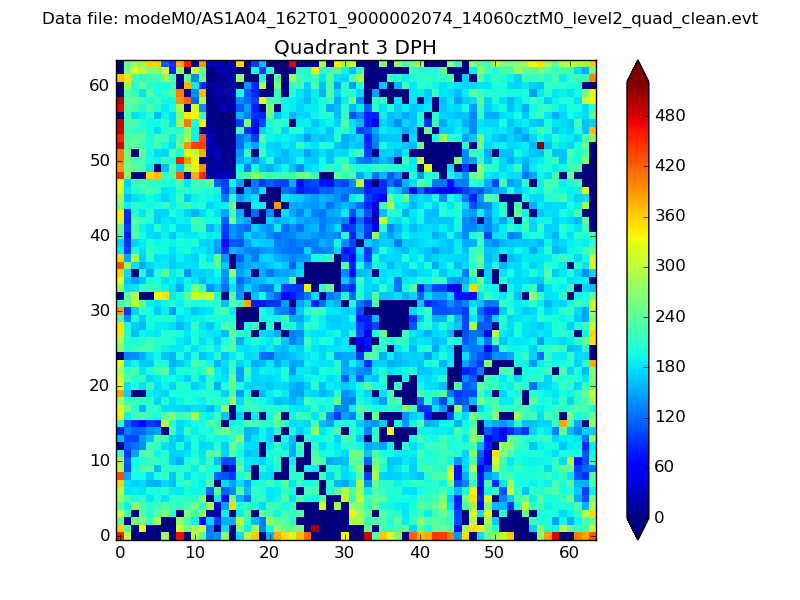 |
 |
Quadrant C |
| Plot type | Count rate plots | Images |
|---|---|---|
| Comparison with Poisson distribution Blue bars denote a histogram of data divided into 1 sec bins. Red curve is a Poisson curve with rate = median count rate of data. |
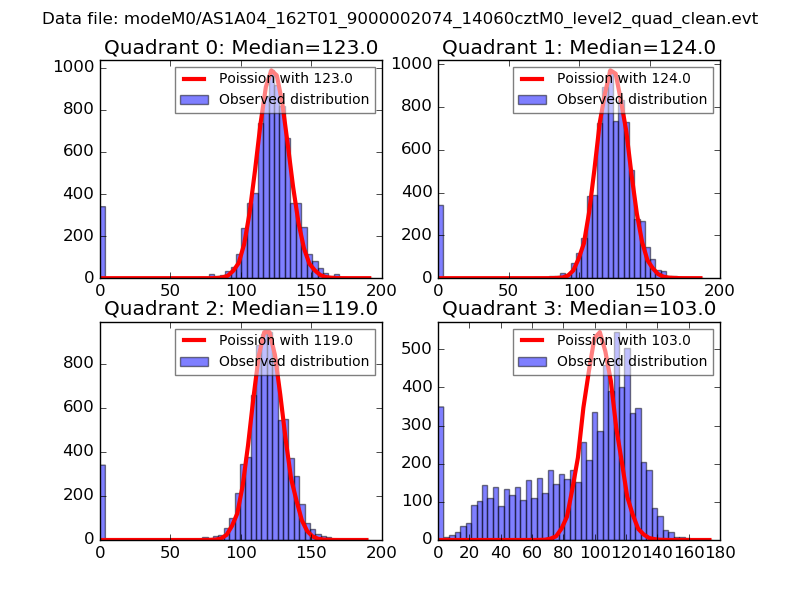 |
 |
| Quadrant-wise count rates Data is divided into 100 sec bins |
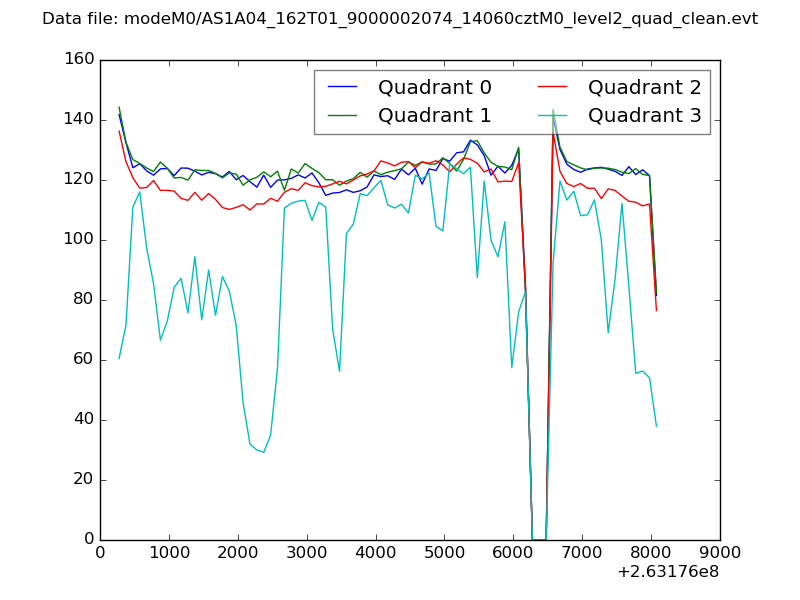 |
|
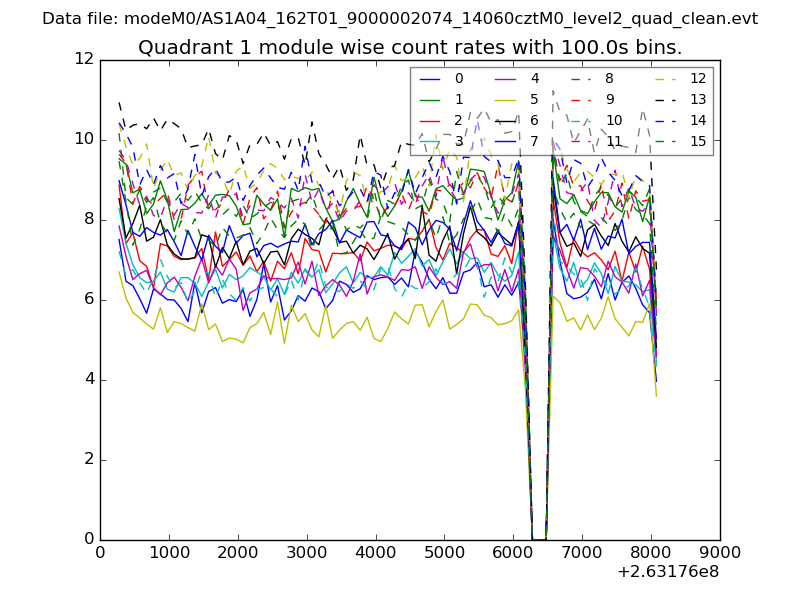
| Module-wise count rates for Quadrant A Data is divided into 100 sec bins |
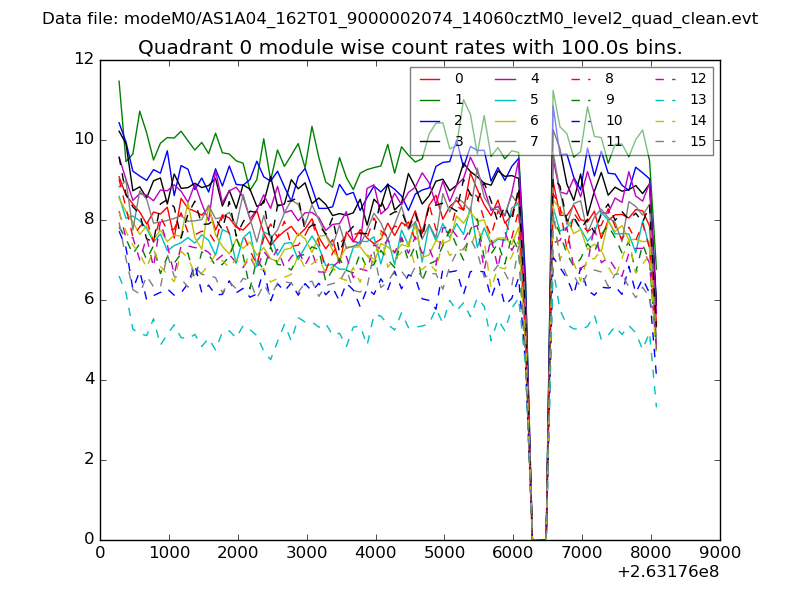 |
 |
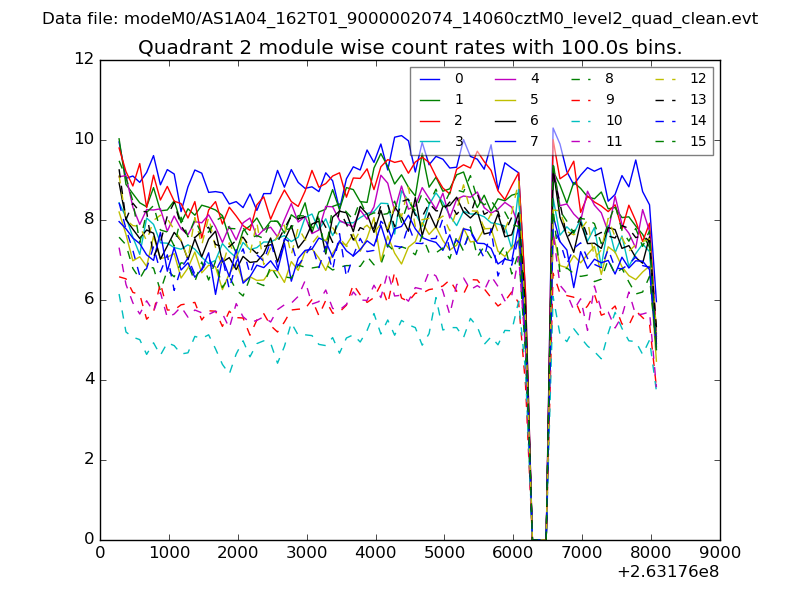
| Module-wise count rates for Quadrant B Data is divided into 100 sec bins |
 |
 |
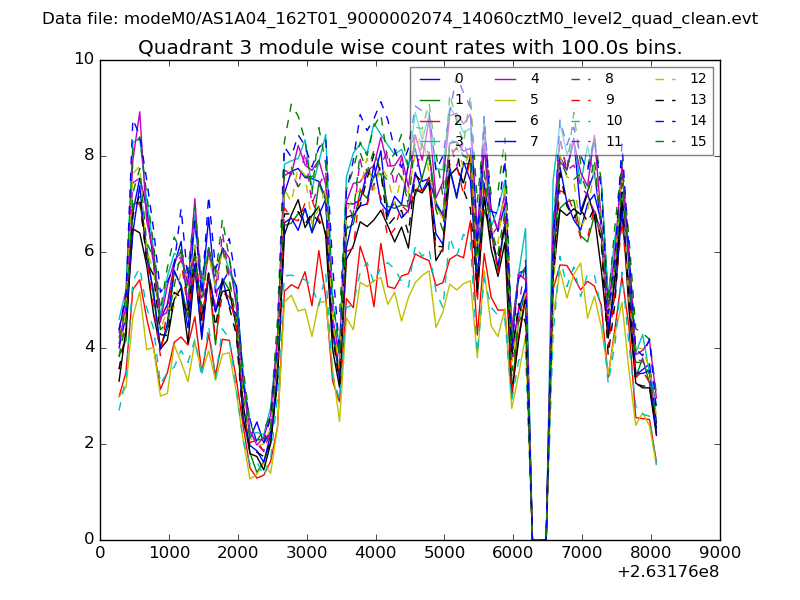
| Module-wise count rates for Quadrant C Data is divided into 100 sec bins |
 |
 |
| Module-wise count rates for Quadrant D Data is divided into 100 sec bins |
 |
 |
| Parameter | Plot |
|---|---|
| CZT HV Monitor | 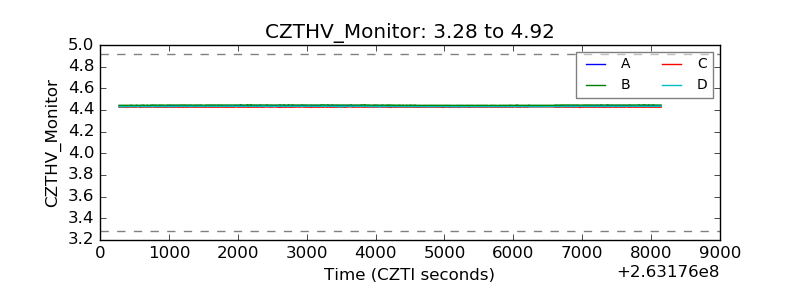 |
| D_VDD | 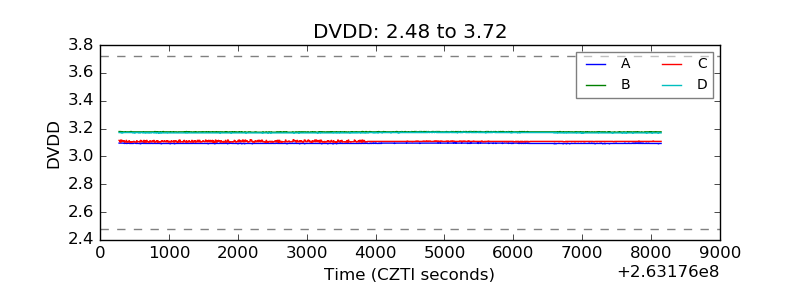 |
| Temperature 1 | 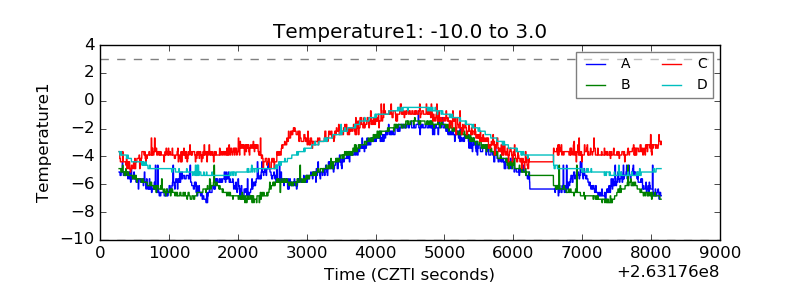 |
| Veto HV Monitor | 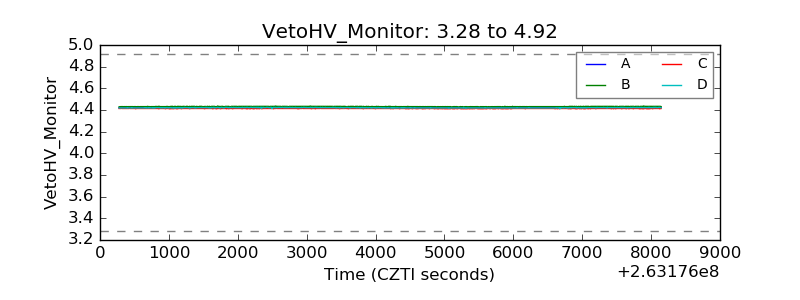 |
| Veto LLD | 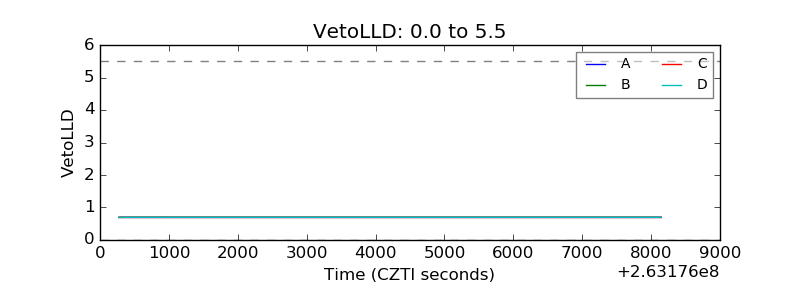 |
| Alpha Counter | 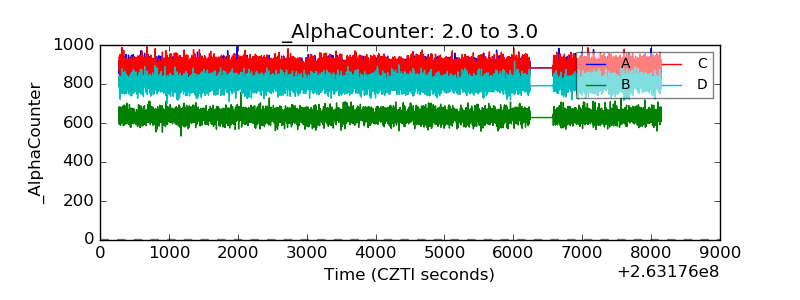 |
| _CPM_Rate | 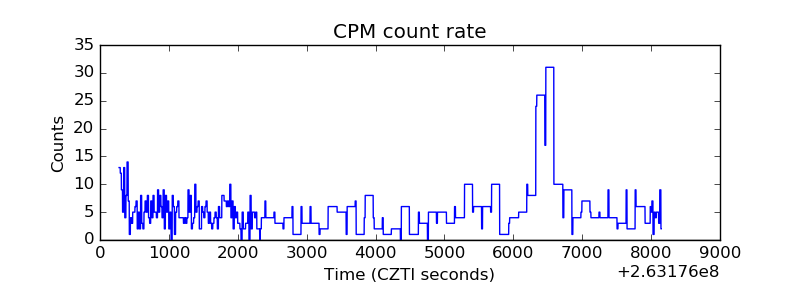 |
| CZT Counter | 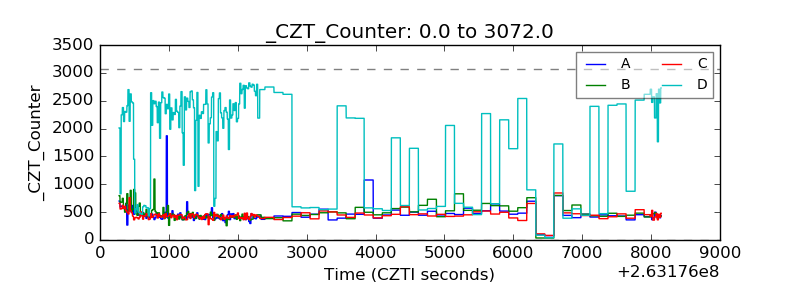 |
| +2.5 Volts monitor |  |
| +5 Volts monitor |  |
| _ROLL_ROT | 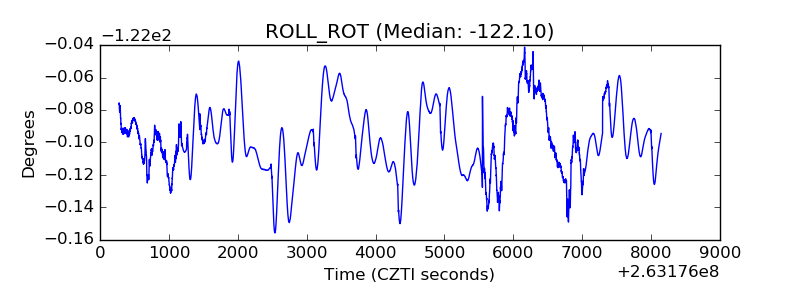 |
| _Roll_DEC |  |
| _Roll_RA | 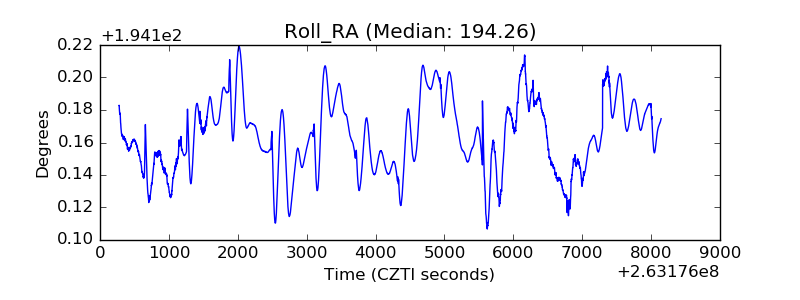 |
| Veto Counter | 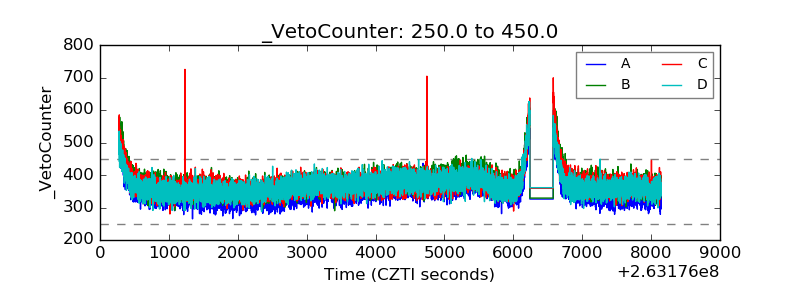 |