| Param | Original file | Final file |
|---|---|---|
| Filename | modeM0/AS1A04_162T01_9000002074_14062cztM0_level2.evt | modeM0/AS1A04_162T01_9000002074_14062cztM0_level2_quad_clean.evt |
| Size (bytes) | 1,040,158,080 | 199,068,480 |
| Size | 992.0 MB | 189.8 MB |
| Events in quadrant A | 5,278,739 | 1,393,101 |
| Events in quadrant B | 5,922,717 | 1,406,190 |
| Events in quadrant C | 5,224,282 | 1,365,318 |
| Events in quadrant D | 14,303,278 | 1,073,299 |
| Mode M0 | |||
|---|---|---|---|
| Quadrant | BADHDUFLAG | Total packets | Discarded packets |
| A | 0 | 23475 | 2 |
| B | 0 | 25026 | 2 |
| C | 0 | 23229 | 2 |
| D | 0 | 49975 | 2 |
| Mode M9 | |||
|---|---|---|---|
| Quadrant | BADHDUFLAG | Total packets | Discarded packets |
| A | 0 | 8 | 0 |
| B | 0 | 8 | 0 |
| C | 0 | 8 | 0 |
| D | 0 | 8 | 0 |
| Mode SS | |||
|---|---|---|---|
| Quadrant | BADHDUFLAG | Total packets | Discarded packets |
| A | 0 | 232 | 0 |
| B | 0 | 232 | 0 |
| C | 0 | 232 | 0 |
| D | 0 | 232 | 0 |
| Quadrant | Total seconds | Saturated seconds | Saturation percentage |
|---|---|---|---|
| A | 11419 | 100 | 0.875733% |
| B | 11419 | 174 | 1.523776% |
| C | 11419 | 85 | 0.744373% |
| D | 11419 | 3834 | 33.575620% |
Noise dominated data is calculated using 1-second bins in cleaned event files. If a bin has >2000 counts, and if more than 50% of those come from <1% of pixels, then it is considered to be noise-dominated and hence unusable.
| Quadrant | # 1 sec bins | Bins with >0 counts | Bins with >2000 counts | High rate bins dominated by noise | Noise dominated (total time) | Noise dominated (detector-on time) | Marked lightcurve |
|---|---|---|---|---|---|---|---|
| A | 12255 | 11422 | 2 | 2 | 0.02% | 0.02% | 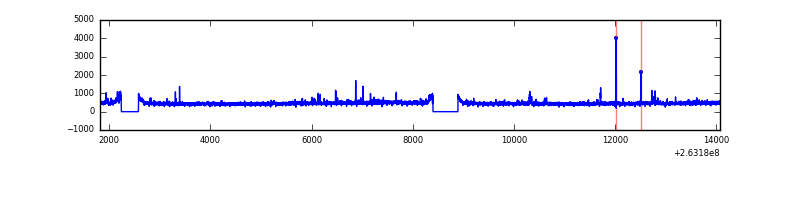 |
| B | 12255 | 11422 | 27 | 27 | 0.22% | 0.24% | 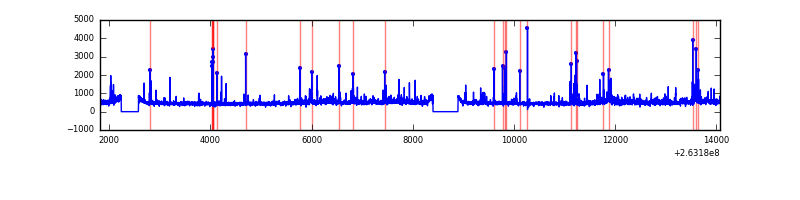 |
| C | 12255 | 11422 | 1 | 1 | 0.01% | 0.01% | 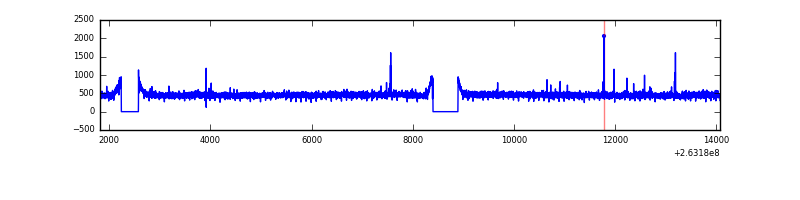 |
| D | 12255 | 11421 | 3165 | 3165 | 25.83% | 27.71% | 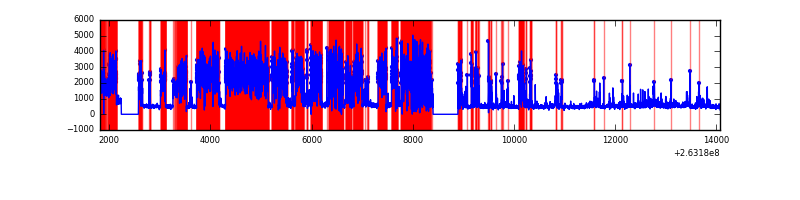 |
Top three noisy pixels from each quadrant. If the there are fewer than three noisy pixels in the level2.evt file, extra rows are filled as -1
| Pixel properties | Quadrant properties | ||||||
|---|---|---|---|---|---|---|---|
| Quadrant | DetID | PixID | Counts | Sigma | Mean | Median | Sigma |
| A | 12 | 189 | 100542 | 369.97 | 1321 | 1289 | 268.3 |
| A | 9 | 143 | 44920 | 162.64 | 1321 | 1289 | 268.3 |
| A | 8 | 15 | 30228 | 107.87 | 1321 | 1289 | 268.3 |
| B | 0 | 189 | 169341 | 671.58 | 1321 | 1285 | 250.2 |
| B | 0 | 229 | 133113 | 526.81 | 1321 | 1285 | 250.2 |
| B | 3 | 209 | 94736 | 373.45 | 1321 | 1285 | 250.2 |
| C | 3 | 233 | 195233 | 656.9 | 1279 | 1283 | 295.2 |
| C | 0 | 207 | 20865 | 66.32 | 1279 | 1283 | 295.2 |
| C | 8 | 128 | 11087 | 33.21 | 1279 | 1283 | 295.2 |
| D | 1 | 52 | 8784616 | 32535.19 | 1061 | 1030 | 270.0 |
| D | 2 | 152 | 503140 | 1859.86 | 1061 | 1030 | 270.0 |
| D | 8 | 195 | 383471 | 1416.6 | 1061 | 1030 | 270.0 |
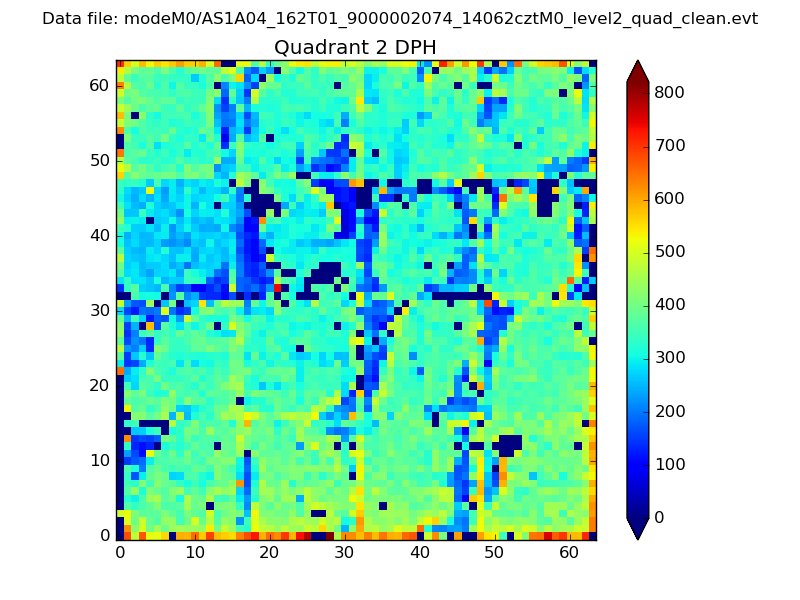
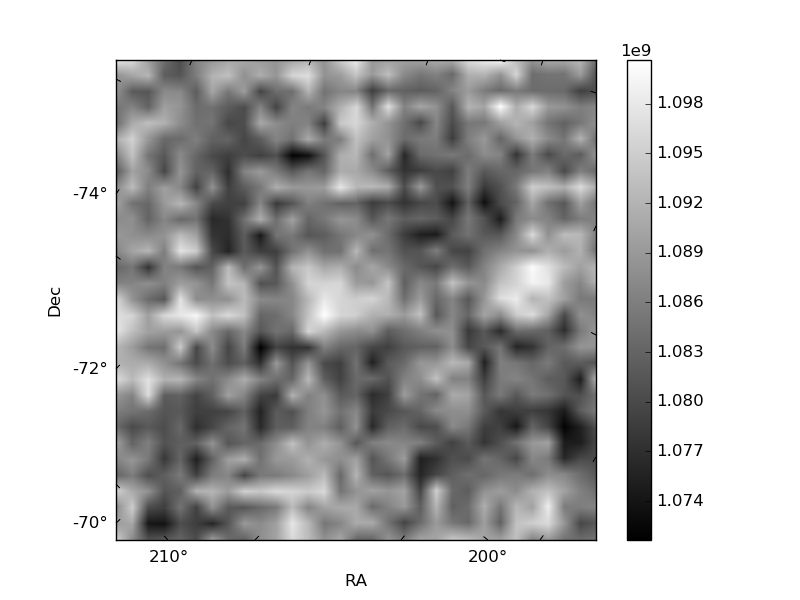
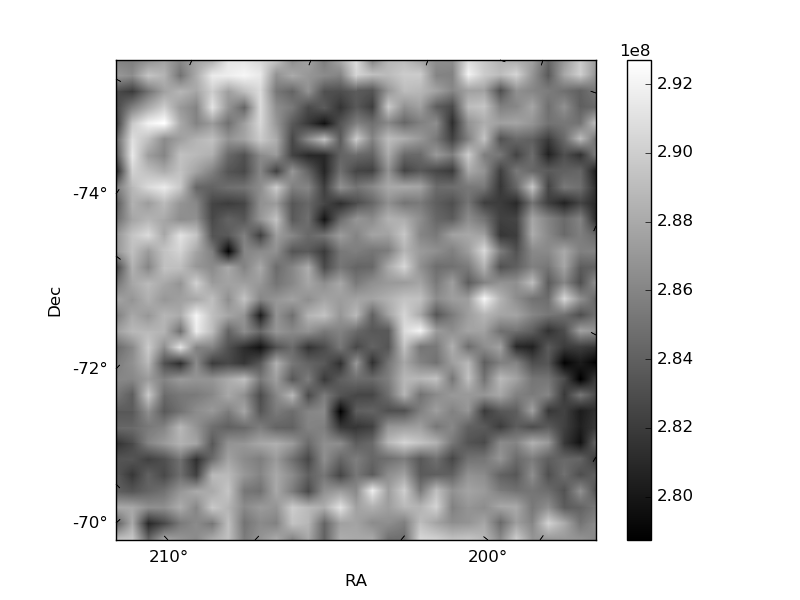
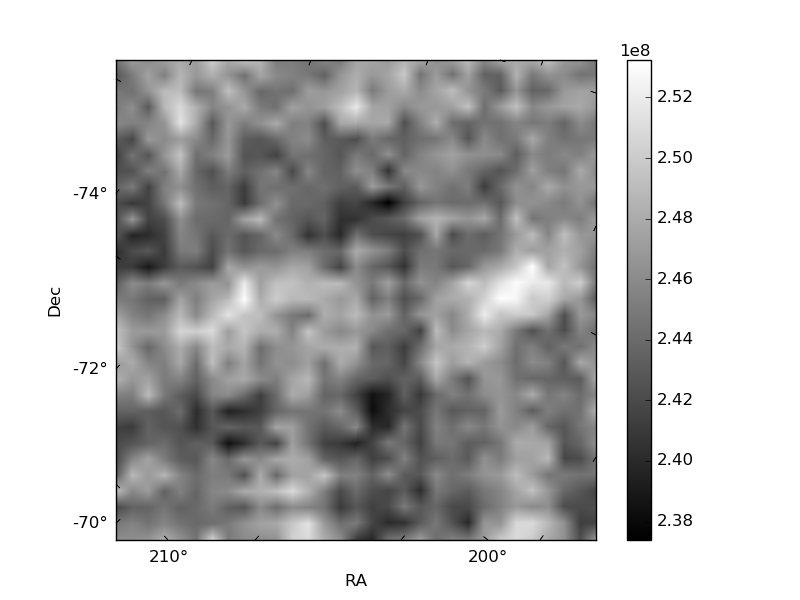
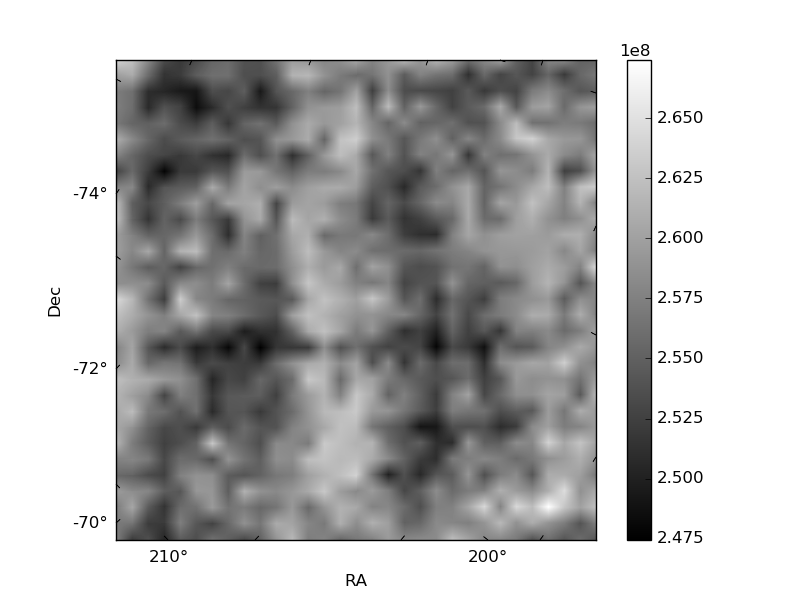
Histogram calculated using DETX and DETY for each event in the final _common_clean file
| Quadrant A | 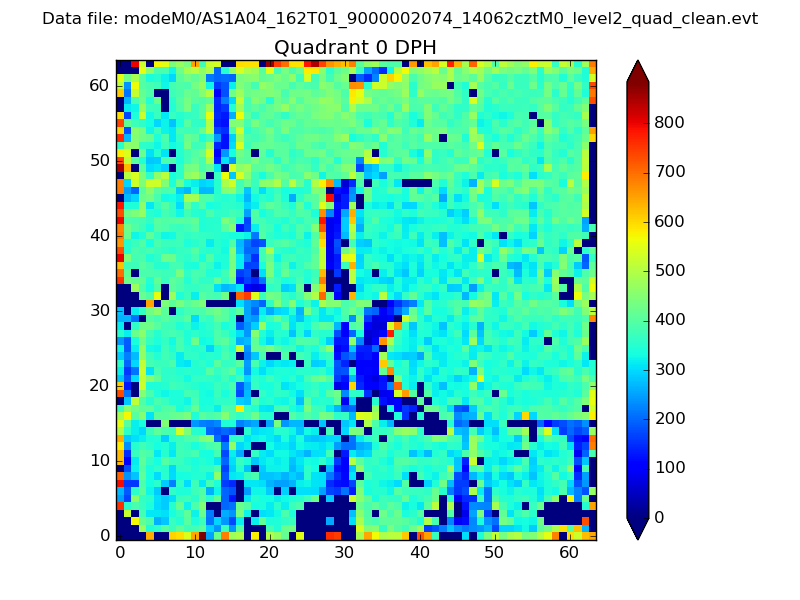 |
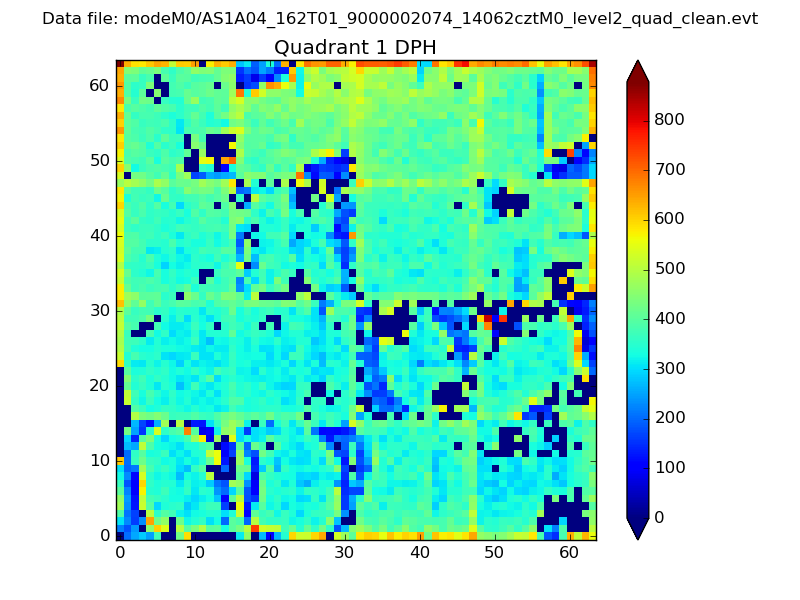 |
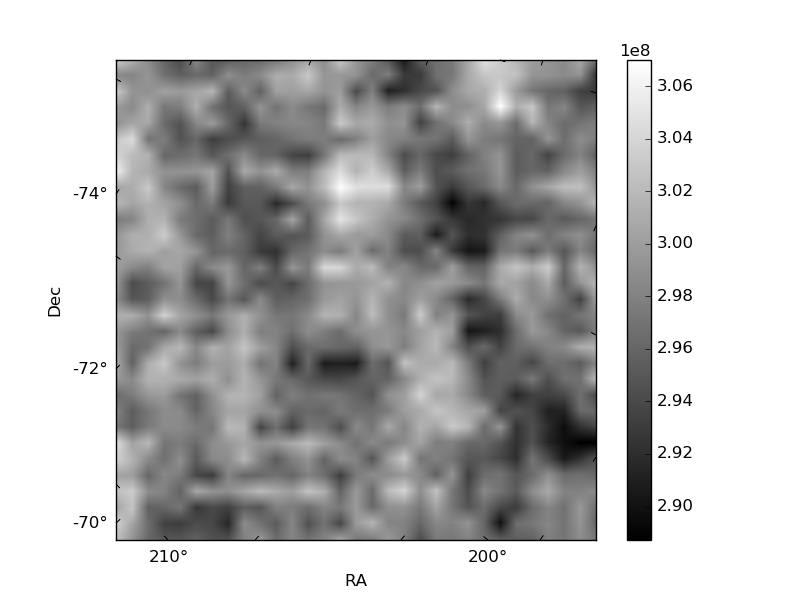
Quadrant B |
|---|---|---|---|
| Quadrant D | 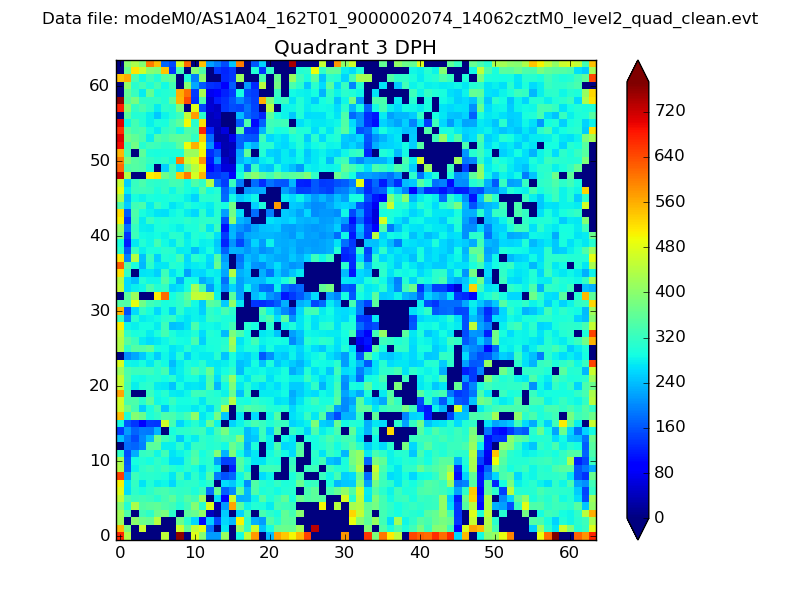 |
 |
Quadrant C |
| Plot type | Count rate plots | Images |
|---|---|---|
| Comparison with Poisson distribution Blue bars denote a histogram of data divided into 1 sec bins. Red curve is a Poisson curve with rate = median count rate of data. |
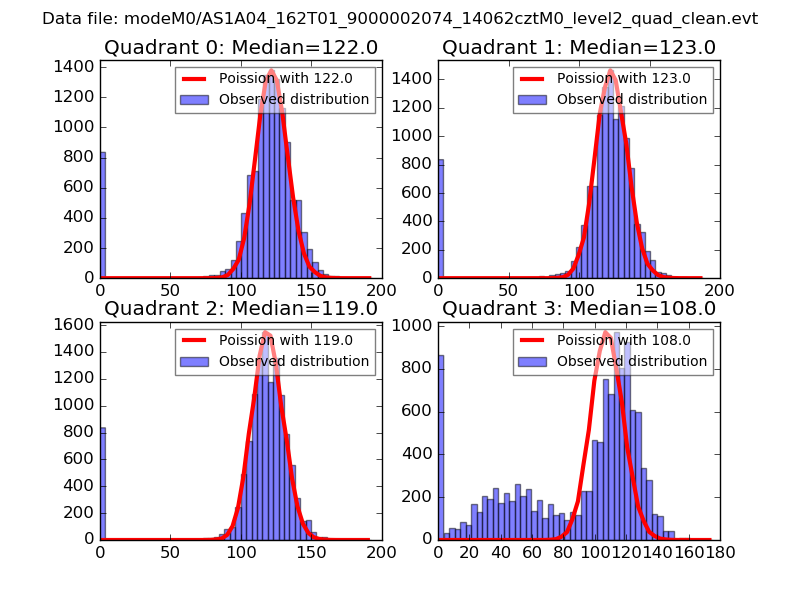 |
 |
| Quadrant-wise count rates Data is divided into 100 sec bins |
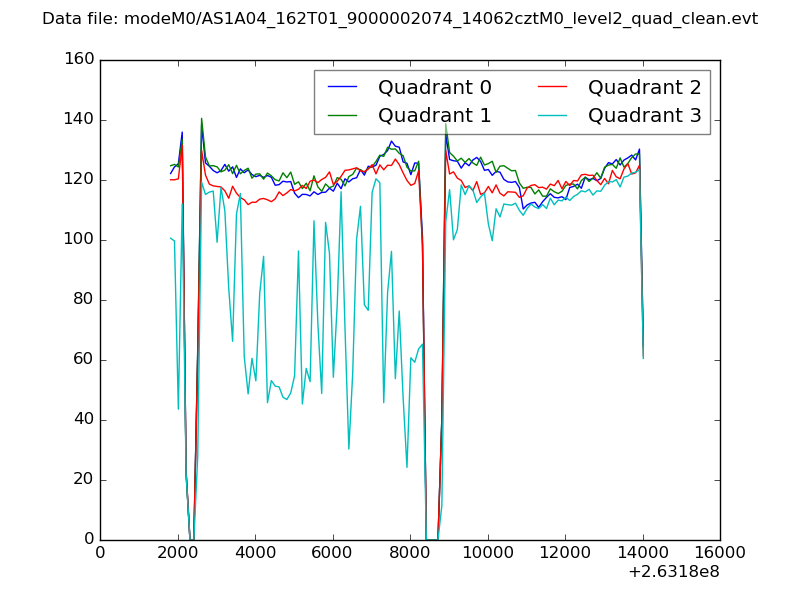 |
|
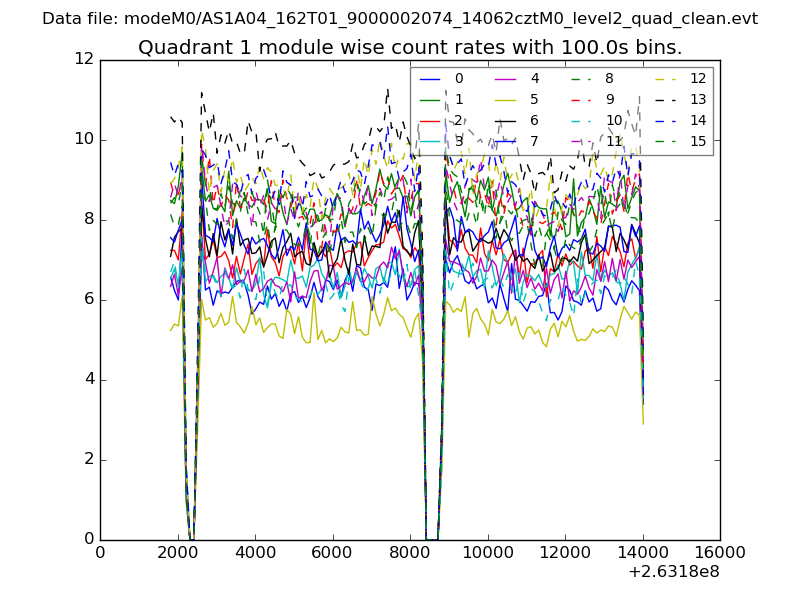
| Module-wise count rates for Quadrant A Data is divided into 100 sec bins |
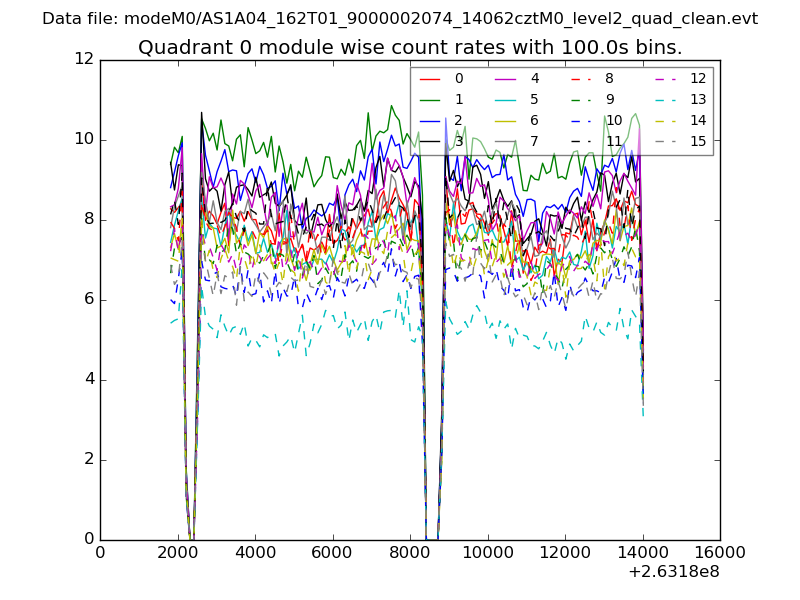 |
 |
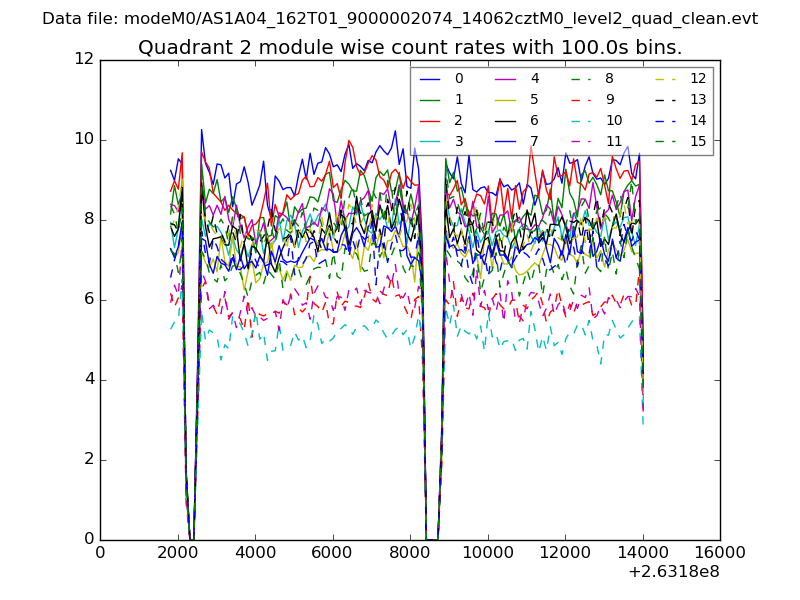
| Module-wise count rates for Quadrant B Data is divided into 100 sec bins |
 |
 |
| Module-wise count rates for Quadrant C Data is divided into 100 sec bins |
 |
 |
| Module-wise count rates for Quadrant D Data is divided into 100 sec bins |
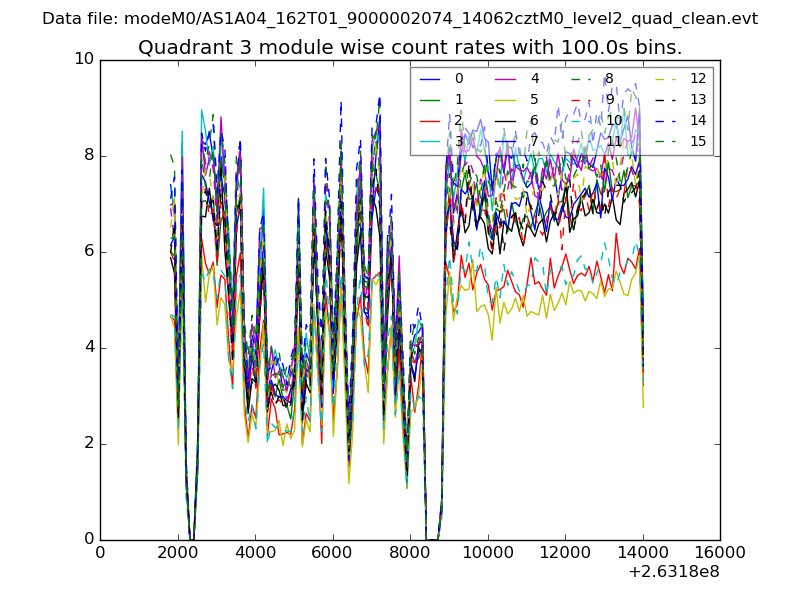 |
 |
| Parameter | Plot |
|---|---|
| CZT HV Monitor | 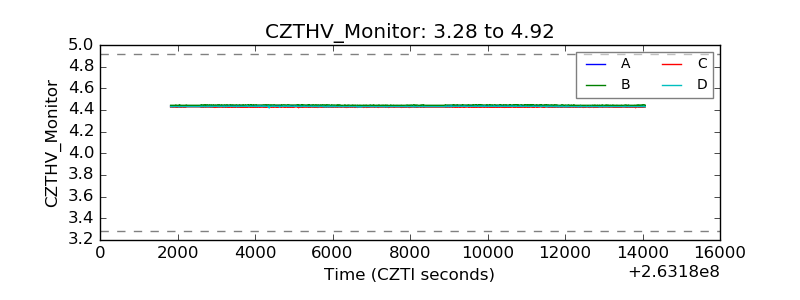 |
| D_VDD |  |
| Temperature 1 | 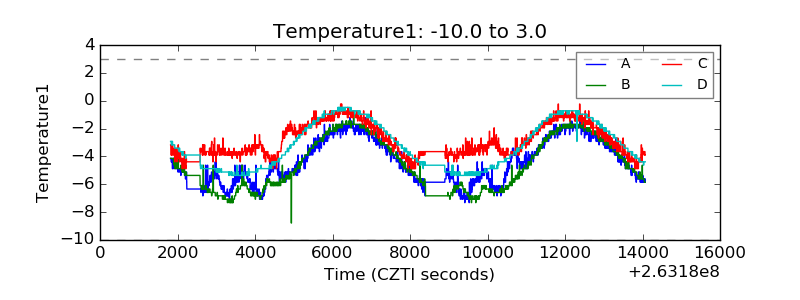 |
| Veto HV Monitor | 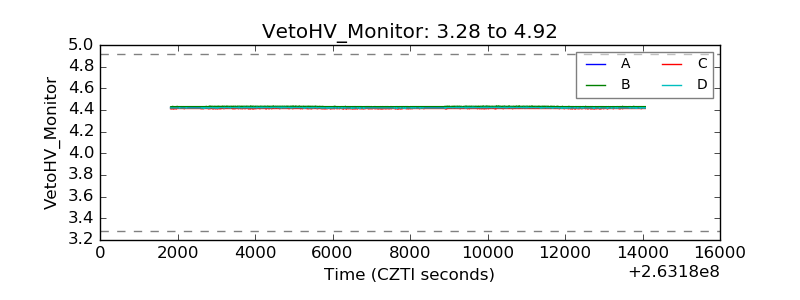 |
| Veto LLD | 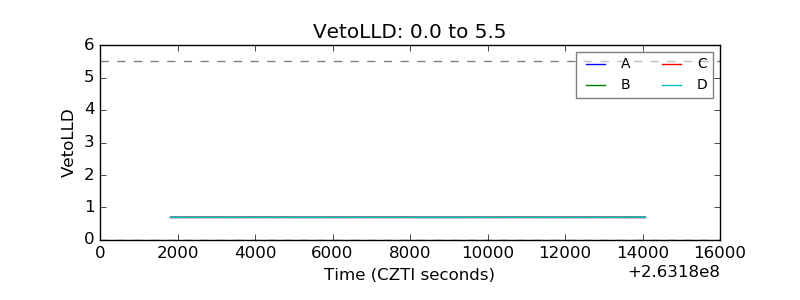 |
| Alpha Counter | 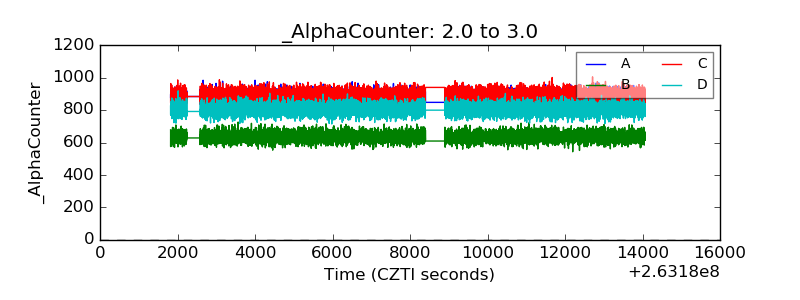 |
| _CPM_Rate | 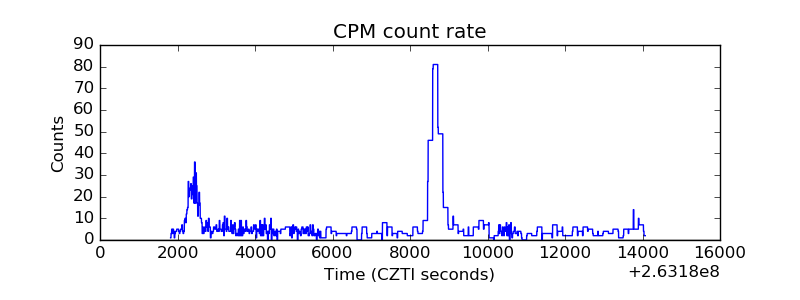 |
| CZT Counter | 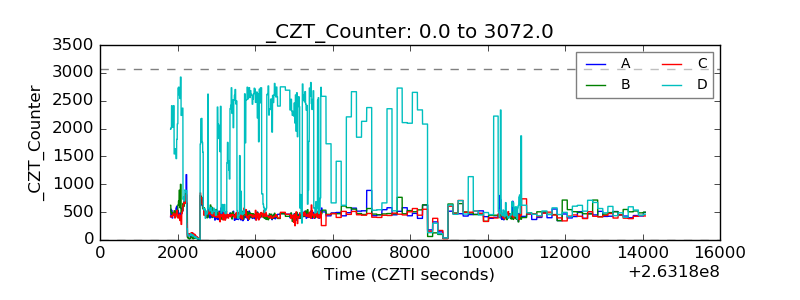 |
| +2.5 Volts monitor |  |
| +5 Volts monitor |  |
| _ROLL_ROT | 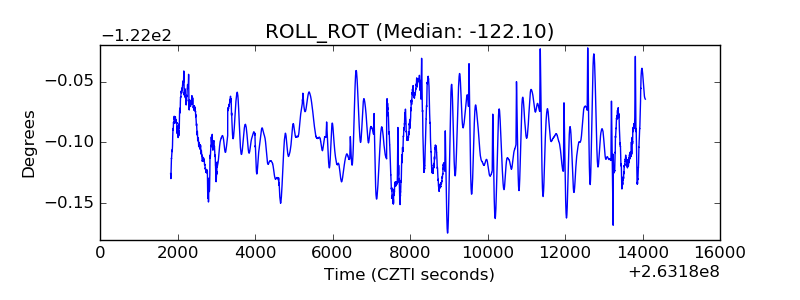 |
| _Roll_DEC | 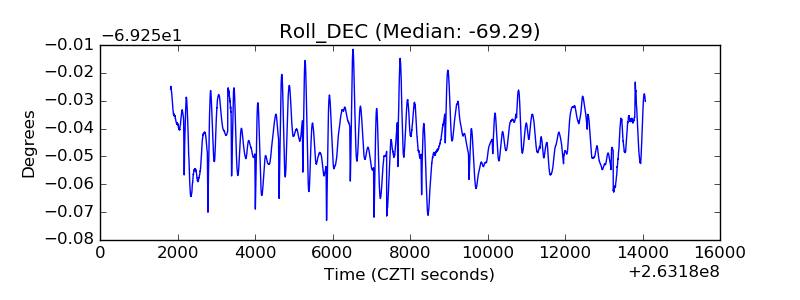 |
| _Roll_RA | 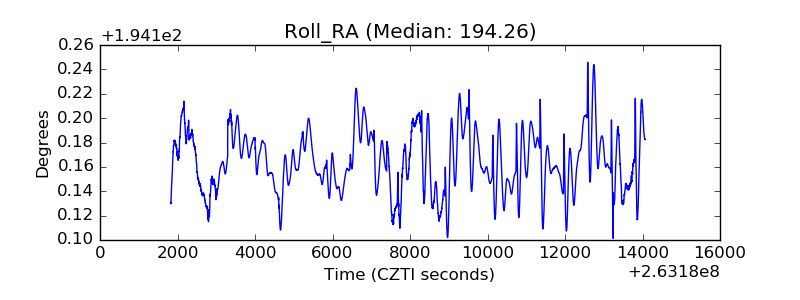 |
| Veto Counter | 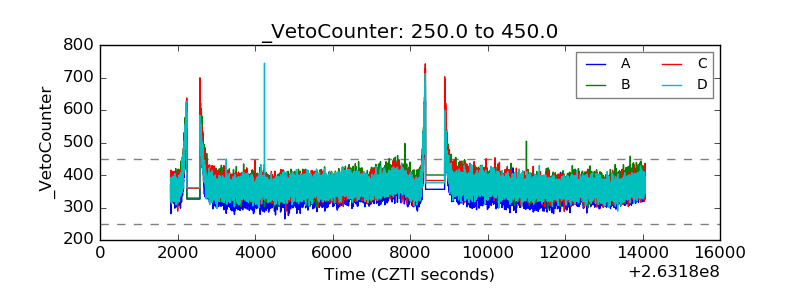 |