| Param | Original file | Final file |
|---|---|---|
| Filename | modeM0/AS1G08_055T01_9000002076_14062cztM0_level2.evt | modeM0/AS1G08_055T01_9000002076_14062cztM0_level2_quad_clean.evt |
| Size (bytes) | 123,811,200 | 26,262,720 |
| Size | 118.1 MB | 25.0 MB |
| Events in quadrant A | 788,164 | 174,811 |
| Events in quadrant B | 837,754 | 177,817 |
| Events in quadrant C | 820,953 | 168,735 |
| Events in quadrant D | 1,191,521 | 155,619 |
| Mode M9 | |||
|---|---|---|---|
| Quadrant | BADHDUFLAG | Total packets | Discarded packets |
| A | 0 | 7 | 0 |
| B | 0 | 7 | 0 |
| C | 0 | 7 | 0 |
| D | 0 | 7 | 0 |
| Mode SS | |||
|---|---|---|---|
| Quadrant | BADHDUFLAG | Total packets | Discarded packets |
| A | 0 | 34 | 0 |
| B | 0 | 34 | 0 |
| C | 0 | 34 | 0 |
| D | 0 | 34 | 0 |
| Mode M0 | |||
|---|---|---|---|
| Quadrant | BADHDUFLAG | Total packets | Discarded packets |
| A | 0 | 3333 | 2 |
| B | 0 | 3448 | 1 |
| C | 0 | 3344 | 1 |
| D | 0 | 4537 | 1 |
| Quadrant | Total seconds | Saturated seconds | Saturation percentage |
|---|---|---|---|
| A | 1595 | 48 | 3.009404% |
| B | 1595 | 64 | 4.012539% |
| C | 1595 | 52 | 3.260188% |
| D | 1595 | 173 | 10.846395% |
Noise dominated data is calculated using 1-second bins in cleaned event files. If a bin has >2000 counts, and if more than 50% of those come from <1% of pixels, then it is considered to be noise-dominated and hence unusable.
| Quadrant | # 1 sec bins | Bins with >0 counts | Bins with >2000 counts | High rate bins dominated by noise | Noise dominated (total time) | Noise dominated (detector-on time) | Marked lightcurve |
|---|---|---|---|---|---|---|---|
| A | 2261 | 1597 | 0 | 0 | 0.00% | 0.00% | 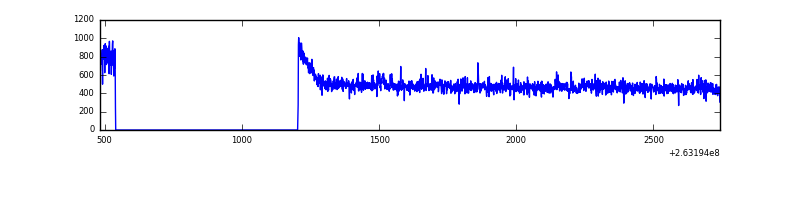 |
| B | 2261 | 1597 | 0 | 0 | 0.00% | 0.00% | 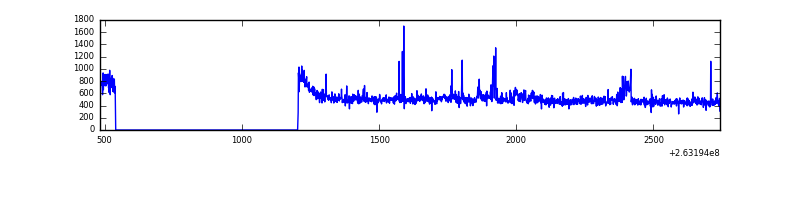 |
| C | 2261 | 1597 | 0 | 0 | 0.00% | 0.00% | 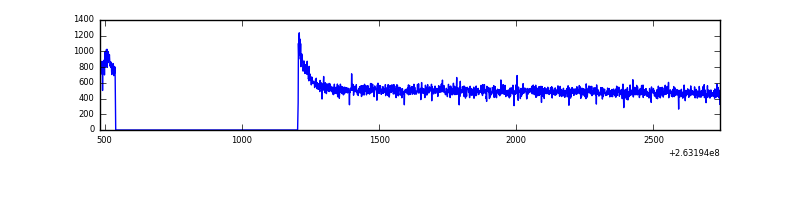 |
| D | 2261 | 1597 | 97 | 97 | 4.29% | 6.07% | 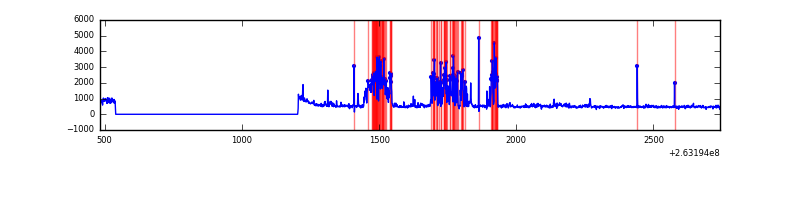 |
Top three noisy pixels from each quadrant. If the there are fewer than three noisy pixels in the level2.evt file, extra rows are filled as -1
| Pixel properties | Quadrant properties | ||||||
|---|---|---|---|---|---|---|---|
| Quadrant | DetID | PixID | Counts | Sigma | Mean | Median | Sigma |
| A | 12 | 189 | 6265 | 141.8 | 202 | 196 | 42.8 |
| A | 8 | 15 | 3061 | 66.94 | 202 | 196 | 42.8 |
| A | 9 | 143 | 2660 | 57.57 | 202 | 196 | 42.8 |
| B | 3 | 64 | 11409 | 275.3 | 203 | 197 | 40.7 |
| B | 3 | 209 | 11162 | 269.23 | 203 | 197 | 40.7 |
| B | 4 | 80 | 10839 | 261.3 | 203 | 197 | 40.7 |
| C | 3 | 233 | 29261 | 594.39 | 202 | 203 | 48.9 |
| C | 13 | 61 | 1511 | 26.76 | 202 | 203 | 48.9 |
| C | 10 | 22 | 1130 | 18.96 | 202 | 203 | 48.9 |
| D | 2 | 152 | 362302 | 7319.78 | 192 | 187 | 49.5 |
| D | 1 | 52 | 34748 | 698.62 | 192 | 187 | 49.5 |
| D | 8 | 195 | 21170 | 424.15 | 192 | 187 | 49.5 |
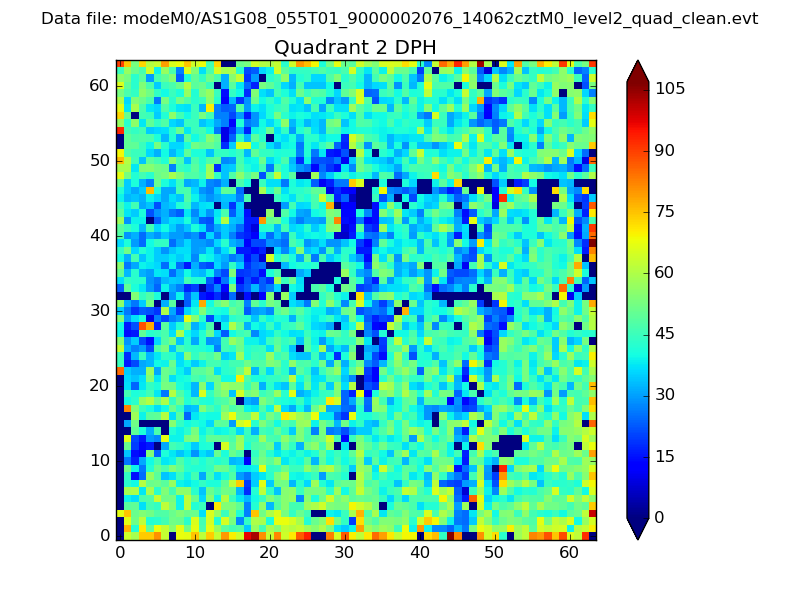
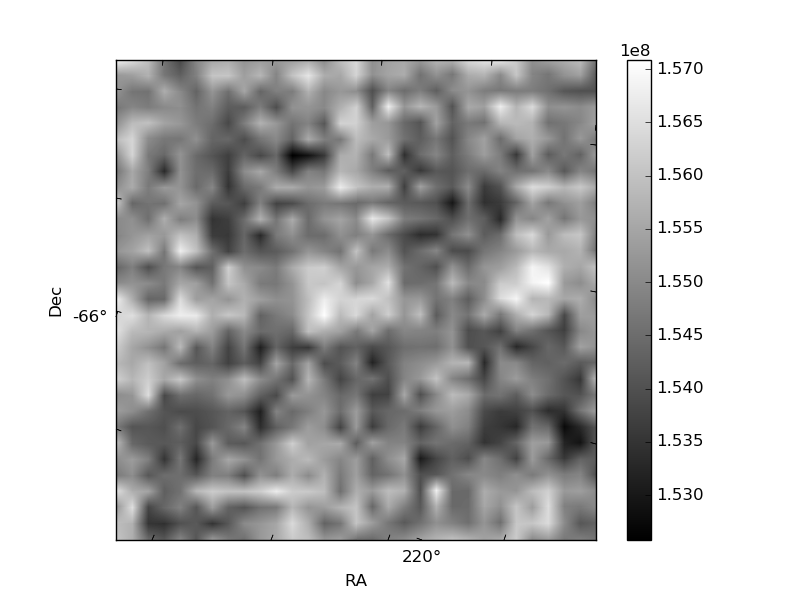
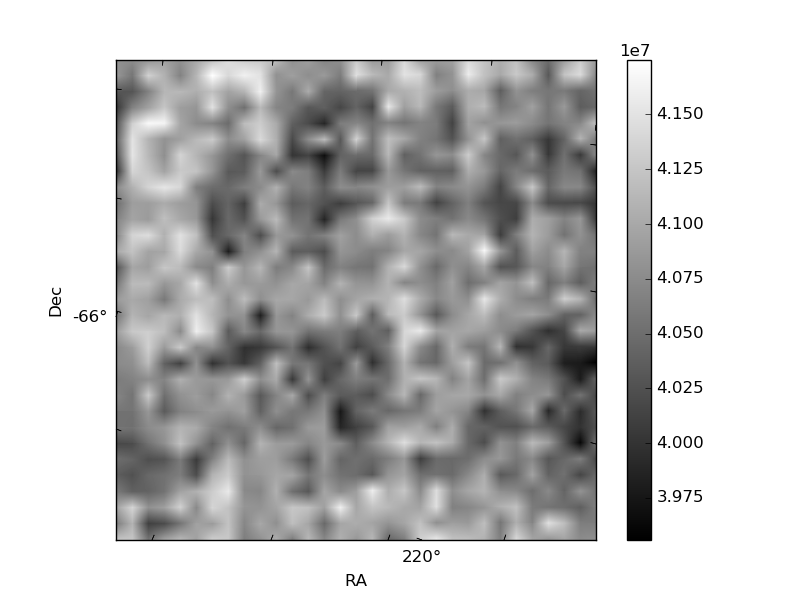
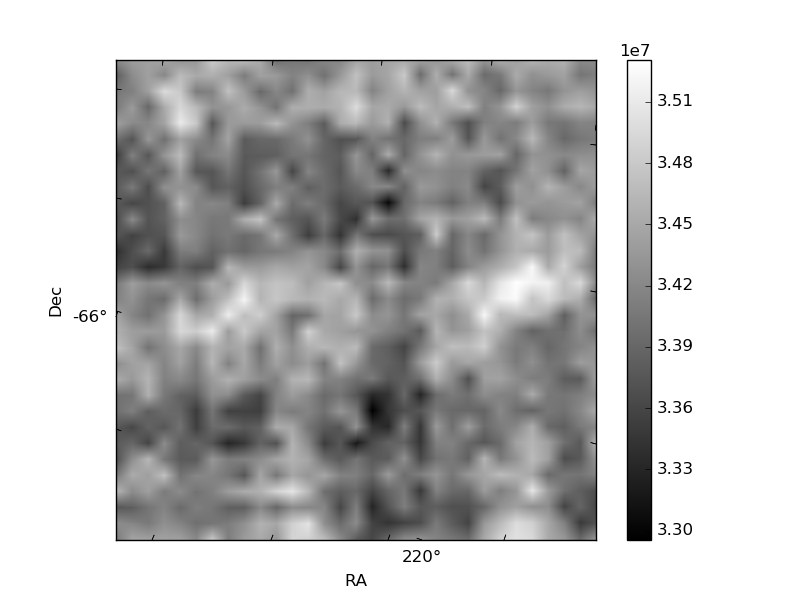
Histogram calculated using DETX and DETY for each event in the final _common_clean file
| Quadrant A | 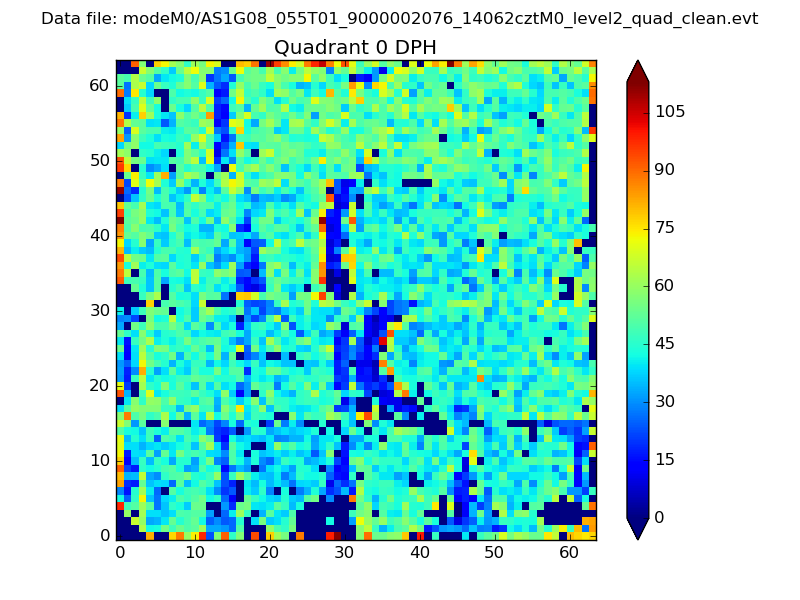 |
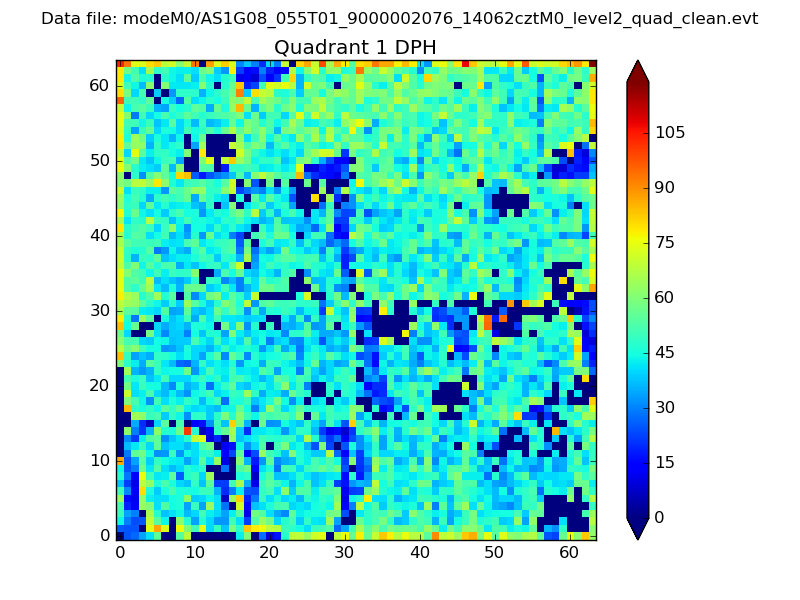 |
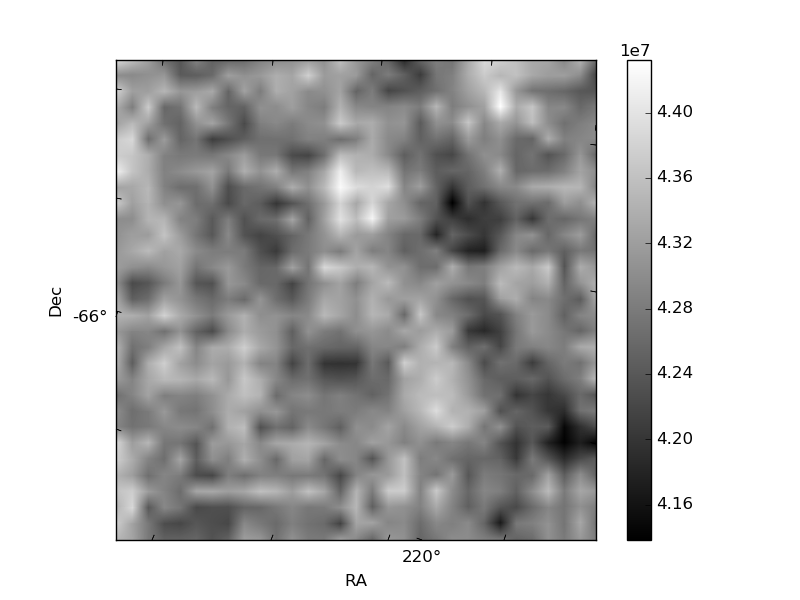
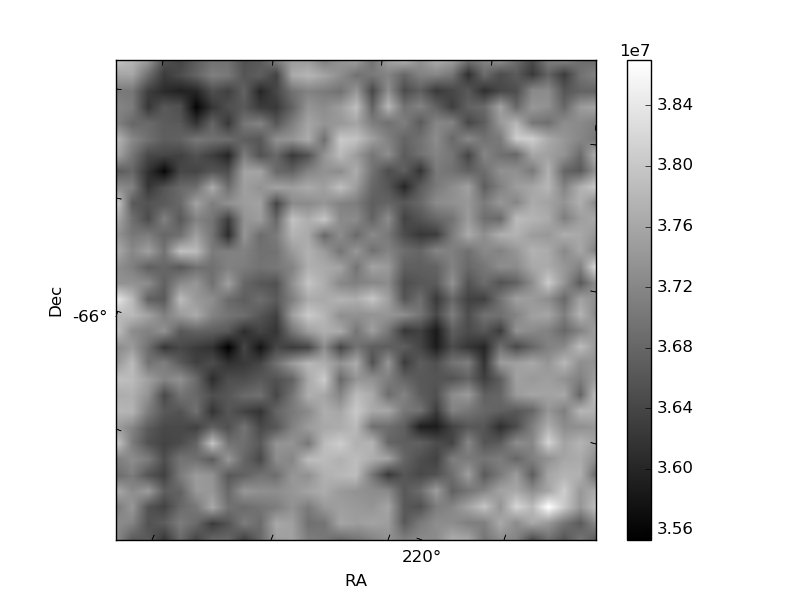
Quadrant B |
|---|---|---|---|
| Quadrant D | 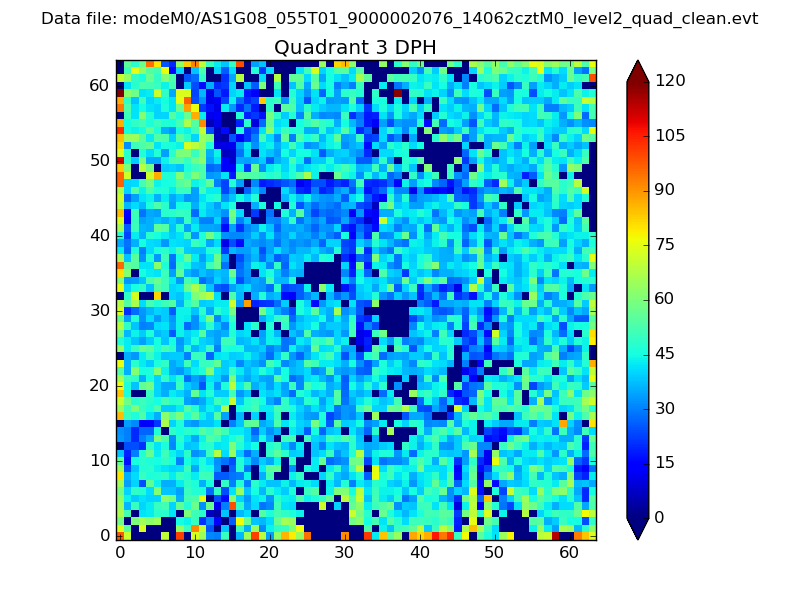 |
 |
Quadrant C |
| Plot type | Count rate plots | Images |
|---|---|---|
| Comparison with Poisson distribution Blue bars denote a histogram of data divided into 1 sec bins. Red curve is a Poisson curve with rate = median count rate of data. |
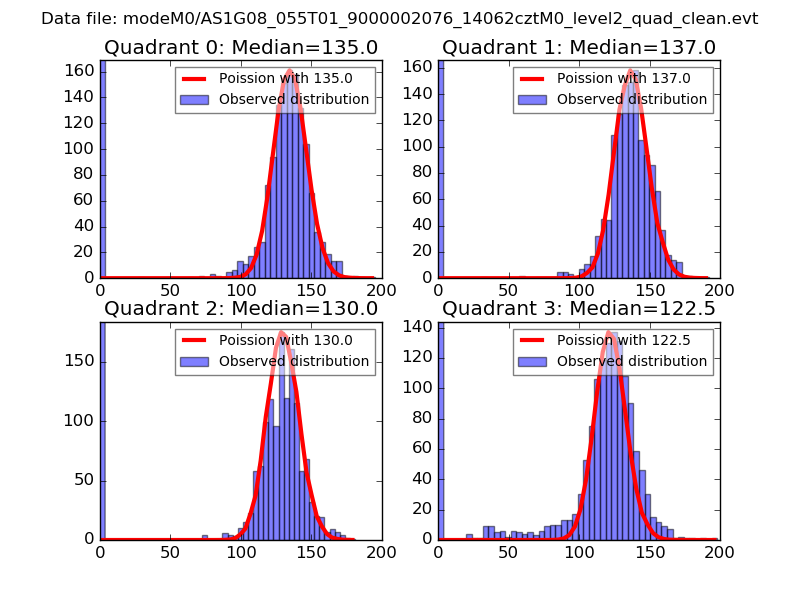 |
 |
| Quadrant-wise count rates Data is divided into 100 sec bins |
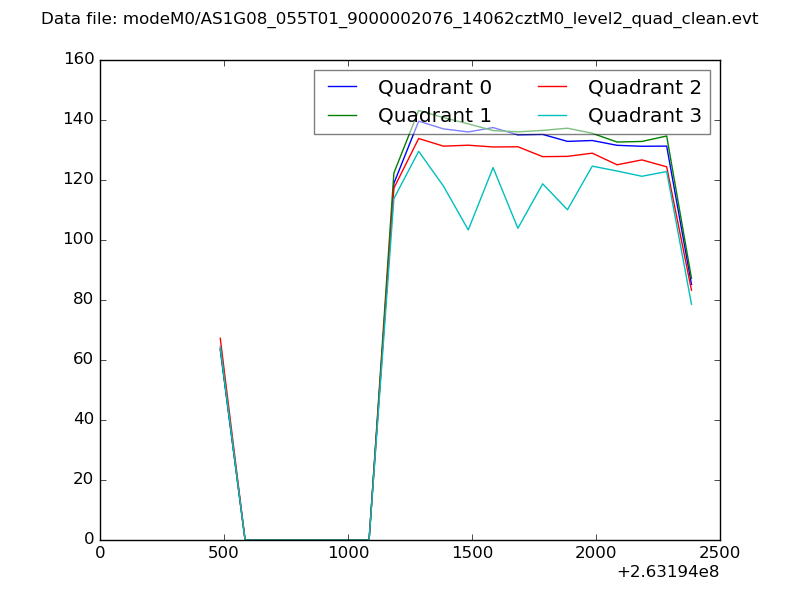 |
|
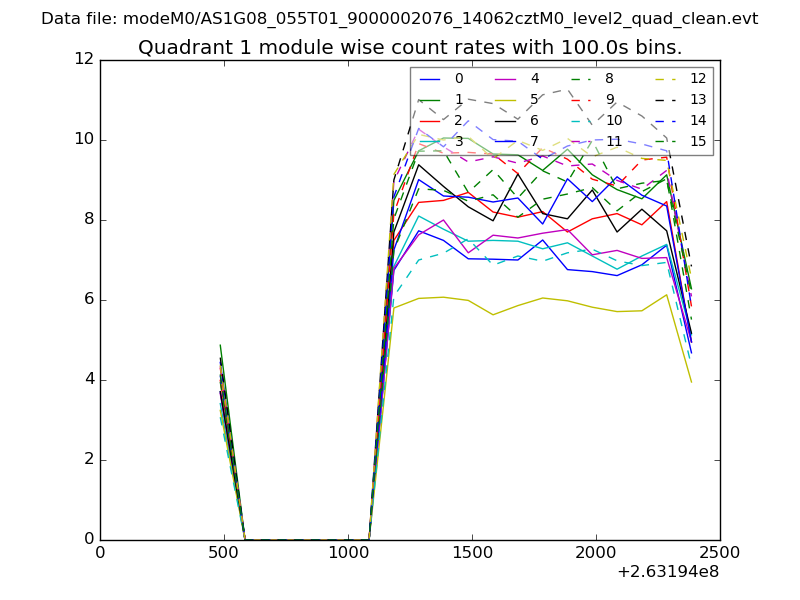
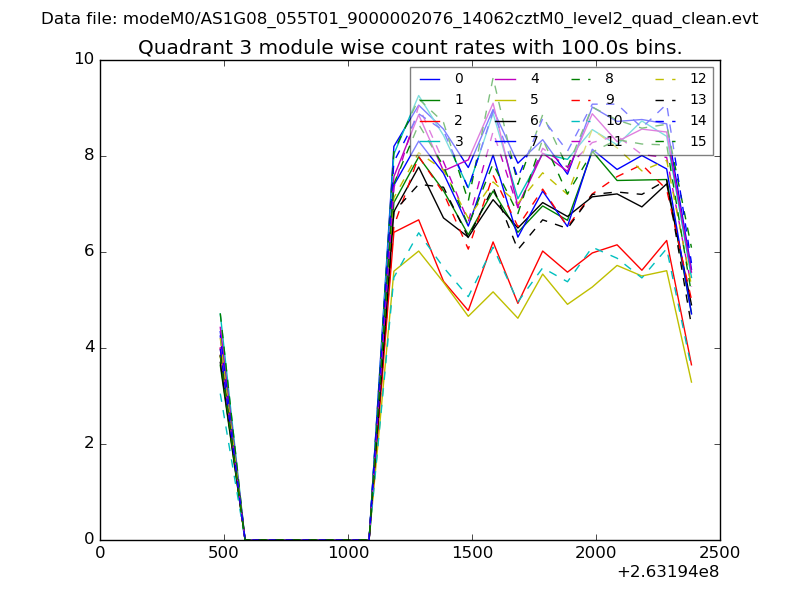
| Module-wise count rates for Quadrant A Data is divided into 100 sec bins |
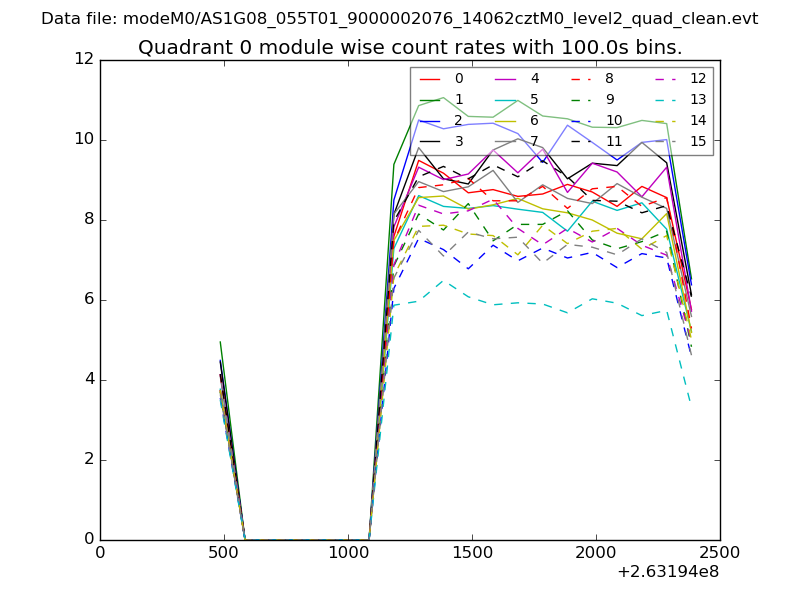 |
 |
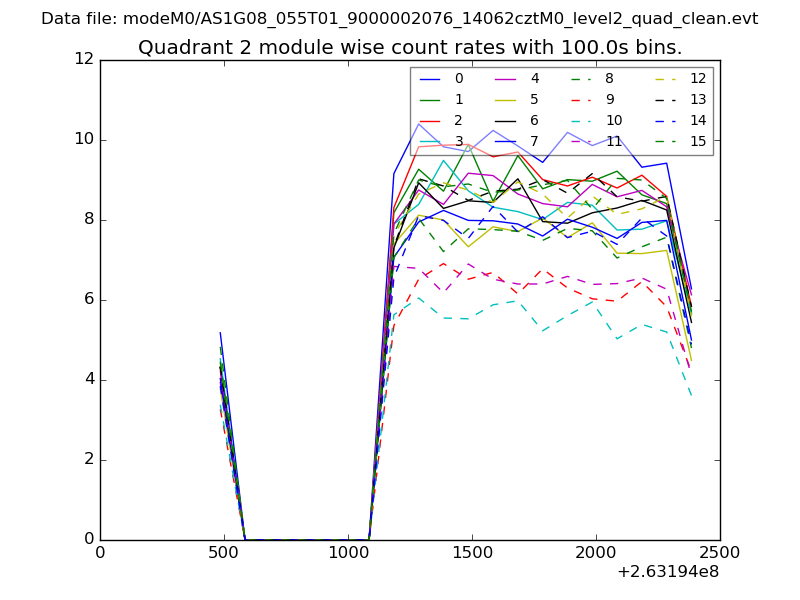
| Module-wise count rates for Quadrant B Data is divided into 100 sec bins |
 |
 |
| Module-wise count rates for Quadrant C Data is divided into 100 sec bins |
 |
 |
| Module-wise count rates for Quadrant D Data is divided into 100 sec bins |
 |
 |
| Parameter | Plot |
|---|---|
| CZT HV Monitor | 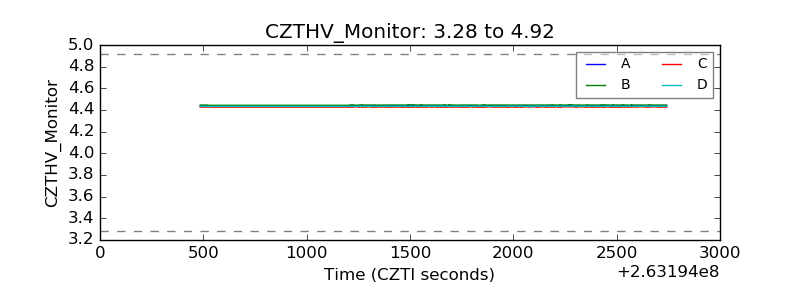 |
| D_VDD | 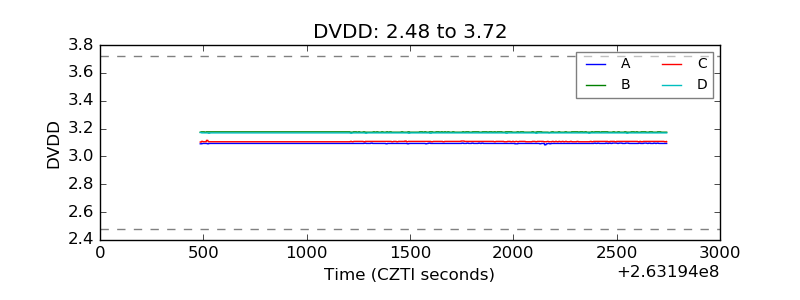 |
| Temperature 1 | 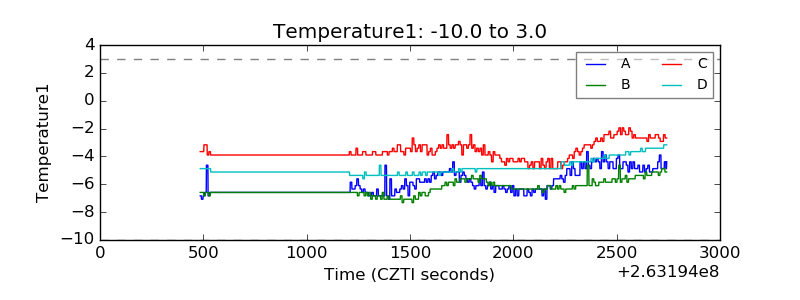 |
| Veto HV Monitor | 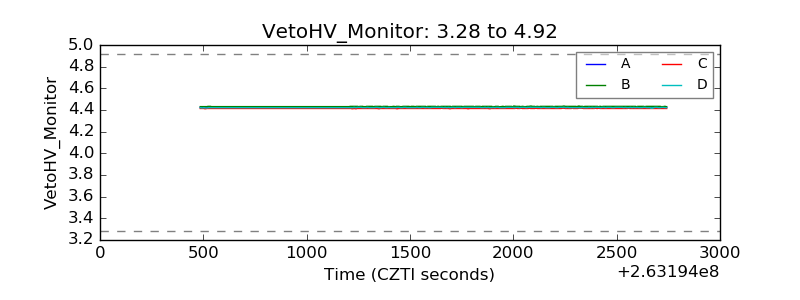 |
| Veto LLD | 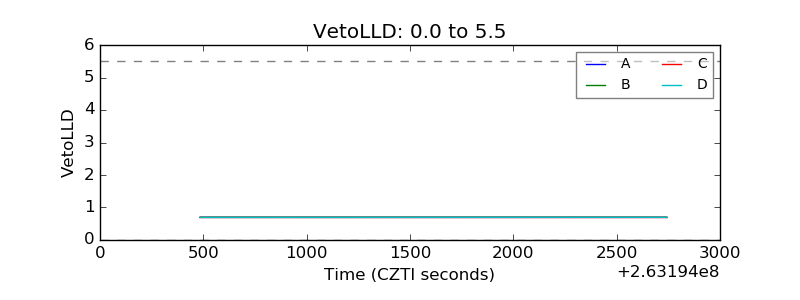 |
| Alpha Counter |  |
| _CPM_Rate | 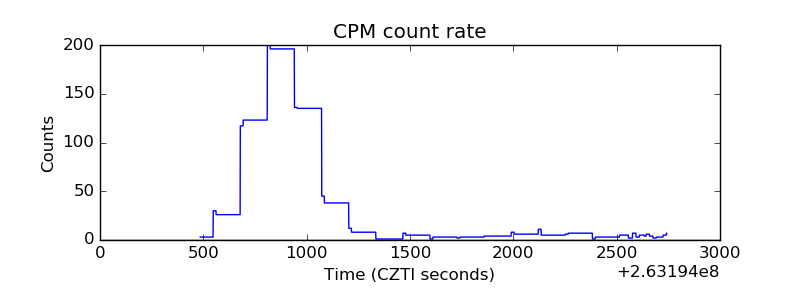 |
| CZT Counter |  |
| +2.5 Volts monitor |  |
| +5 Volts monitor |  |
| _ROLL_ROT | 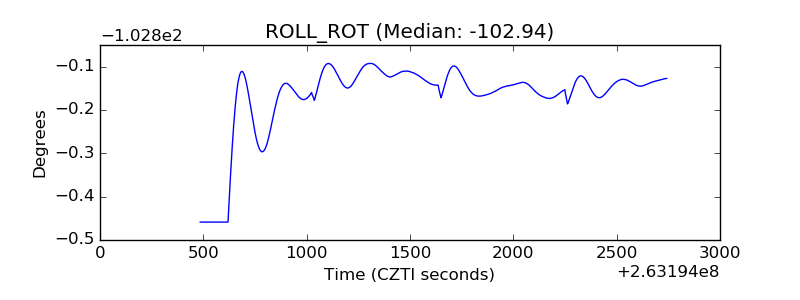 |
| _Roll_DEC | 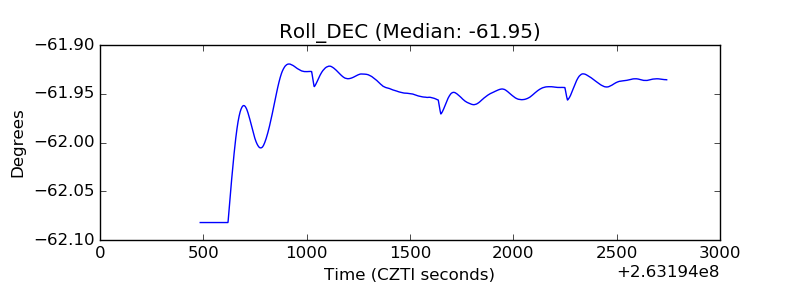 |
| _Roll_RA | 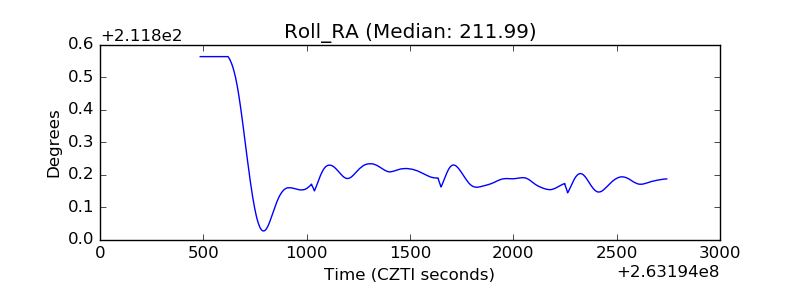 |
| Veto Counter | 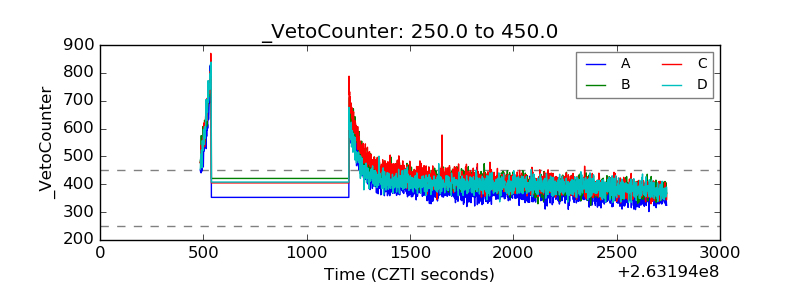 |