| Param | Original file | Final file |
|---|---|---|
| Filename | modeM0/AS1G08_055T01_9000002076_14063cztM0_level2.evt | modeM0/AS1G08_055T01_9000002076_14063cztM0_level2_quad_clean.evt |
| Size (bytes) | 486,967,680 | 98,184,960 |
| Size | 464.4 MB | 93.6 MB |
| Events in quadrant A | 3,389,121 | 636,155 |
| Events in quadrant B | 3,323,529 | 652,476 |
| Events in quadrant C | 3,161,242 | 632,020 |
| Events in quadrant D | 4,429,579 | 596,286 |
| Mode M9 | |||
|---|---|---|---|
| Quadrant | BADHDUFLAG | Total packets | Discarded packets |
| A | 0 | 9 | 0 |
| B | 0 | 9 | 0 |
| C | 0 | 9 | 0 |
| D | 0 | 9 | 0 |
| Mode SS | |||
|---|---|---|---|
| Quadrant | BADHDUFLAG | Total packets | Discarded packets |
| A | 0 | 132 | 0 |
| B | 0 | 132 | 0 |
| C | 0 | 132 | 0 |
| D | 0 | 132 | 0 |
| Mode M0 | |||
|---|---|---|---|
| Quadrant | BADHDUFLAG | Total packets | Discarded packets |
| A | 0 | 14230 | 2 |
| B | 0 | 13911 | 1 |
| C | 0 | 13530 | 1 |
| D | 0 | 17436 | 1 |
| Quadrant | Total seconds | Saturated seconds | Saturation percentage |
|---|---|---|---|
| A | 6548 | 173 | 2.642028% |
| B | 6548 | 95 | 1.450825% |
| C | 6548 | 70 | 1.069029% |
| D | 6548 | 237 | 3.619426% |
Noise dominated data is calculated using 1-second bins in cleaned event files. If a bin has >2000 counts, and if more than 50% of those come from <1% of pixels, then it is considered to be noise-dominated and hence unusable.
| Quadrant | # 1 sec bins | Bins with >0 counts | Bins with >2000 counts | High rate bins dominated by noise | Noise dominated (total time) | Noise dominated (detector-on time) | Marked lightcurve |
|---|---|---|---|---|---|---|---|
| A | 7384 | 6550 | 88 | 88 | 1.19% | 1.34% | 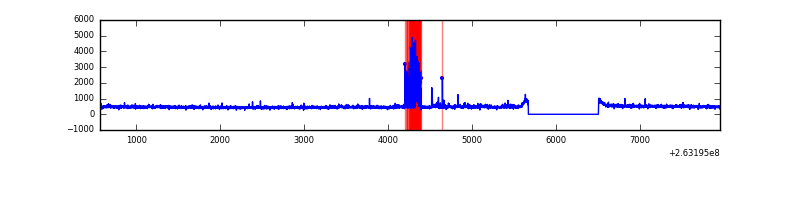 |
| B | 7384 | 6550 | 6 | 6 | 0.08% | 0.09% | 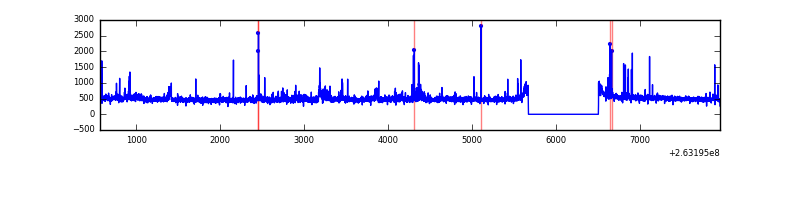 |
| C | 7384 | 6550 | 1 | 1 | 0.01% | 0.02% | 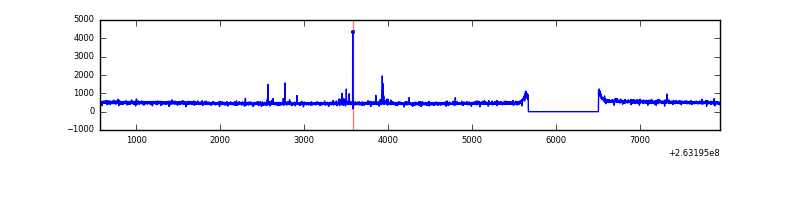 |
| D | 7384 | 6550 | 130 | 130 | 1.76% | 1.98% | 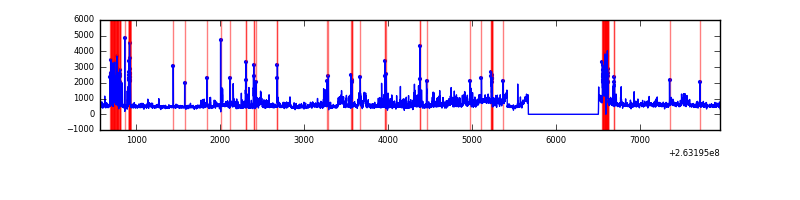 |
Top three noisy pixels from each quadrant. If the there are fewer than three noisy pixels in the level2.evt file, extra rows are filled as -1
| Pixel properties | Quadrant properties | ||||||
|---|---|---|---|---|---|---|---|
| Quadrant | DetID | PixID | Counts | Sigma | Mean | Median | Sigma |
| A | 9 | 143 | 312654 | 1977.27 | 776 | 760 | 157.7 |
| A | 12 | 189 | 70268 | 440.65 | 776 | 760 | 157.7 |
| A | 8 | 15 | 20247 | 123.54 | 776 | 760 | 157.7 |
| B | 0 | 189 | 53504 | 357.38 | 782 | 762 | 147.6 |
| B | 3 | 209 | 46655 | 310.97 | 782 | 762 | 147.6 |
| B | 4 | 80 | 45972 | 306.34 | 782 | 762 | 147.6 |
| C | 3 | 233 | 145291 | 818.7 | 763 | 768 | 176.5 |
| C | 0 | 207 | 32345 | 178.88 | 763 | 768 | 176.5 |
| C | 10 | 22 | 6622 | 33.16 | 763 | 768 | 176.5 |
| D | 1 | 52 | 725631 | 3926.39 | 746 | 727 | 184.6 |
| D | 2 | 152 | 364321 | 1969.38 | 746 | 727 | 184.6 |
| D | 8 | 195 | 127451 | 686.39 | 746 | 727 | 184.6 |
Histogram calculated using DETX and DETY for each event in the final _common_clean file
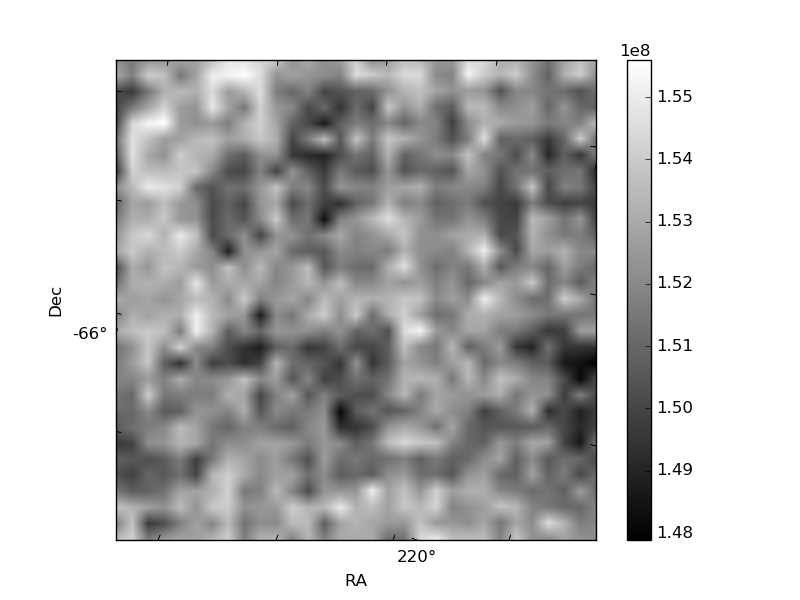
| Quadrant A | 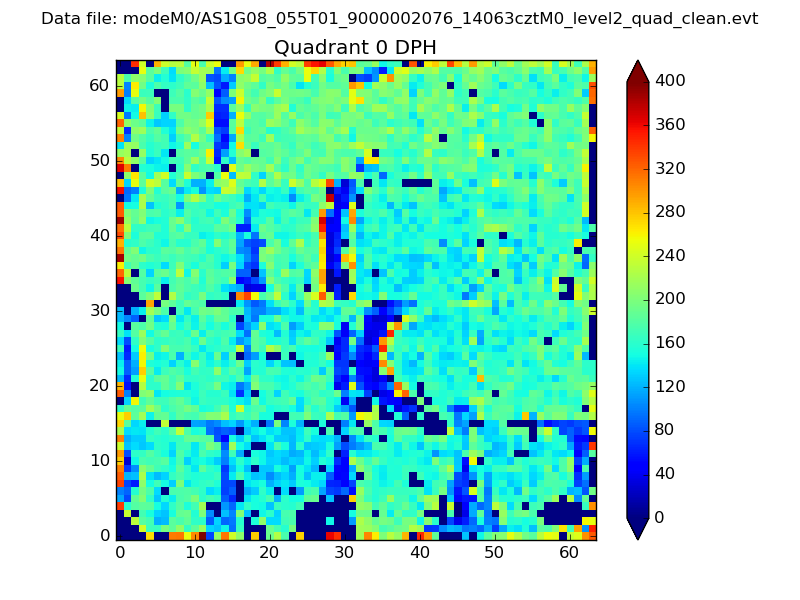 |
 |
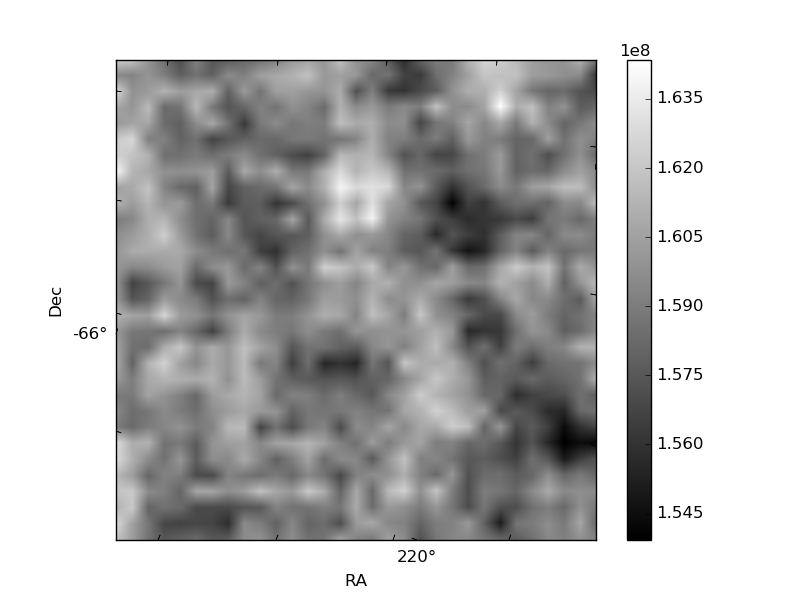
Quadrant B |
|---|---|---|---|
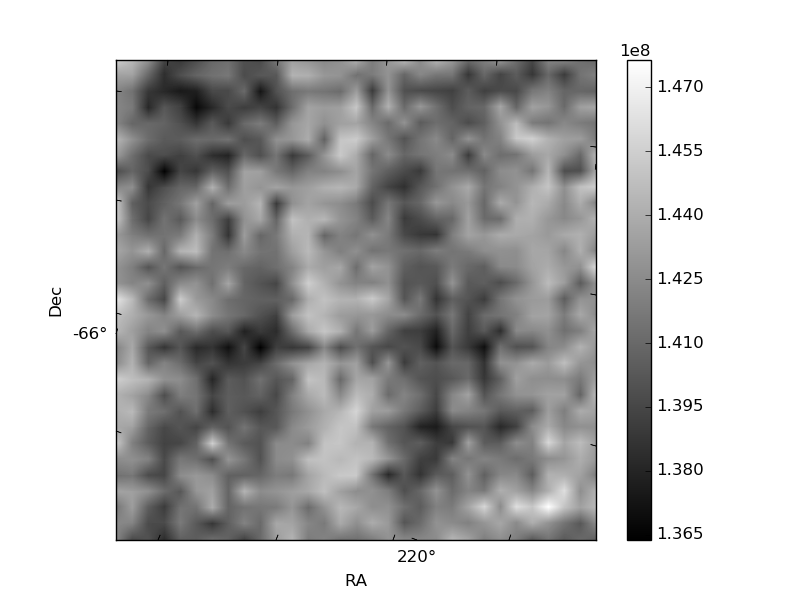
| Quadrant D | 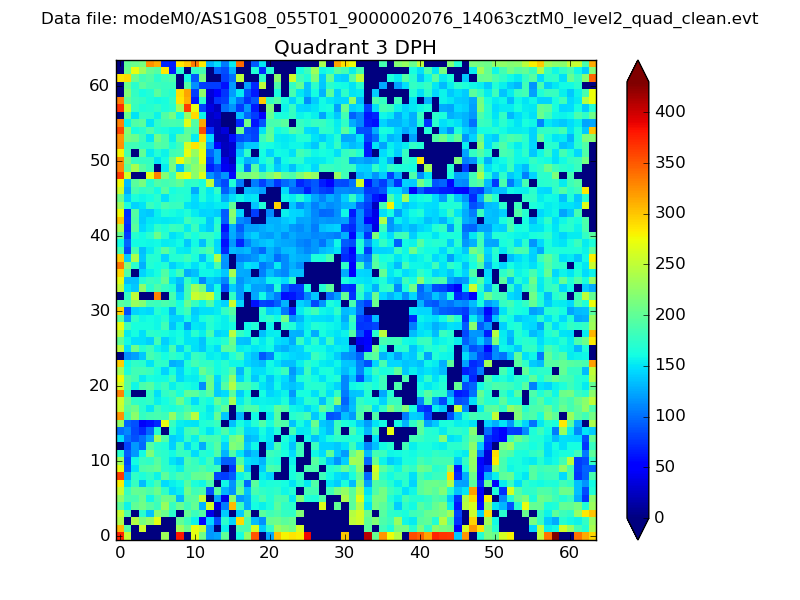 |
 |
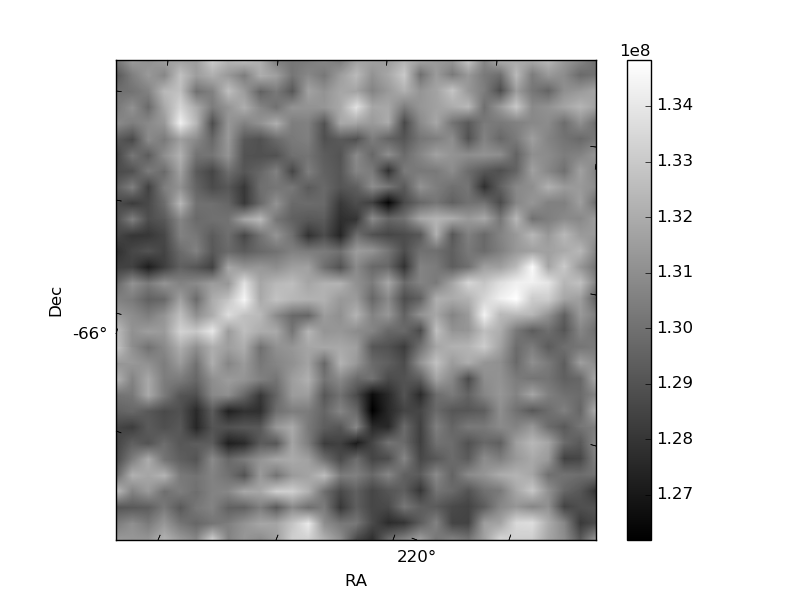
Quadrant C |
| Plot type | Count rate plots | Images |
|---|---|---|
| Comparison with Poisson distribution Blue bars denote a histogram of data divided into 1 sec bins. Red curve is a Poisson curve with rate = median count rate of data. |
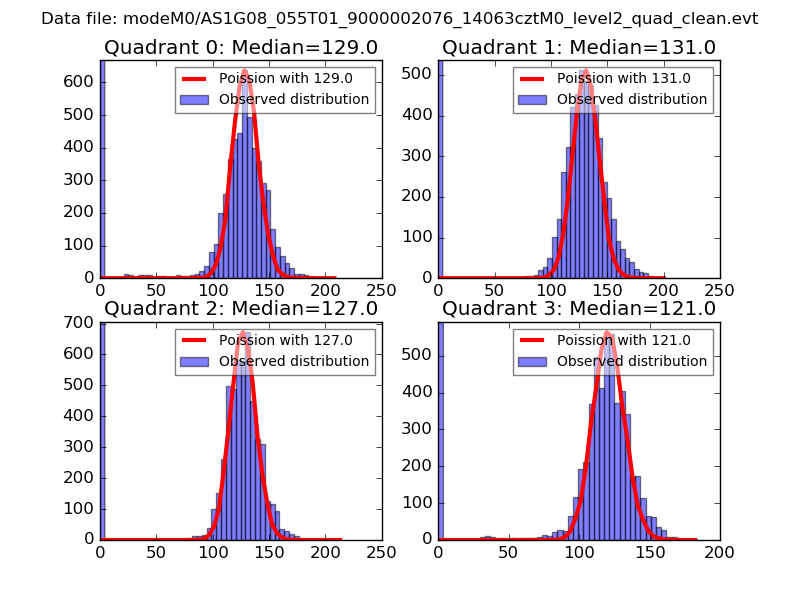 |
 |
| Quadrant-wise count rates Data is divided into 100 sec bins |
 |
|
| Module-wise count rates for Quadrant A Data is divided into 100 sec bins |
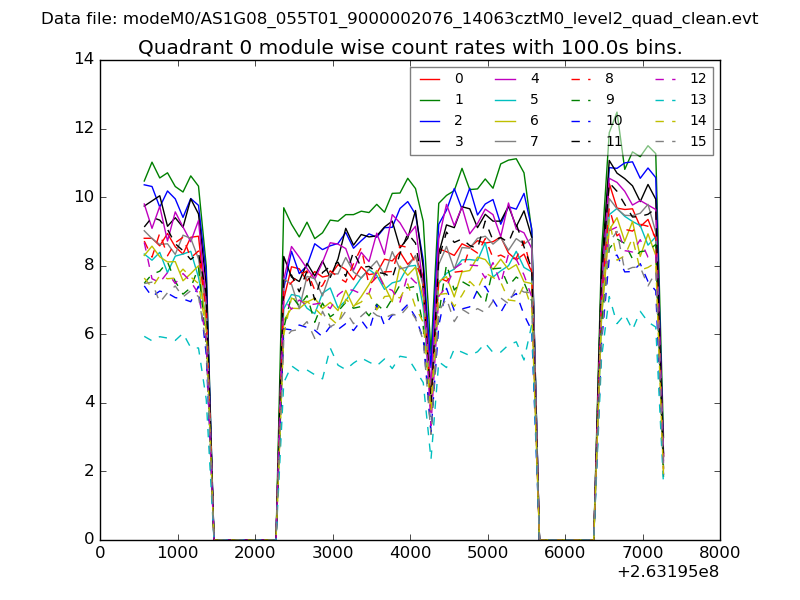 |
 |
| Module-wise count rates for Quadrant B Data is divided into 100 sec bins |
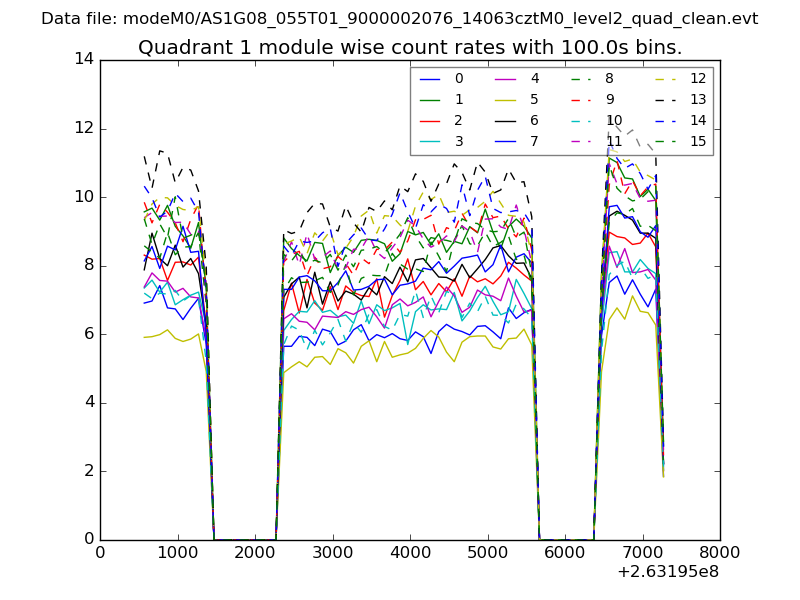 |
 |
| Module-wise count rates for Quadrant C Data is divided into 100 sec bins |
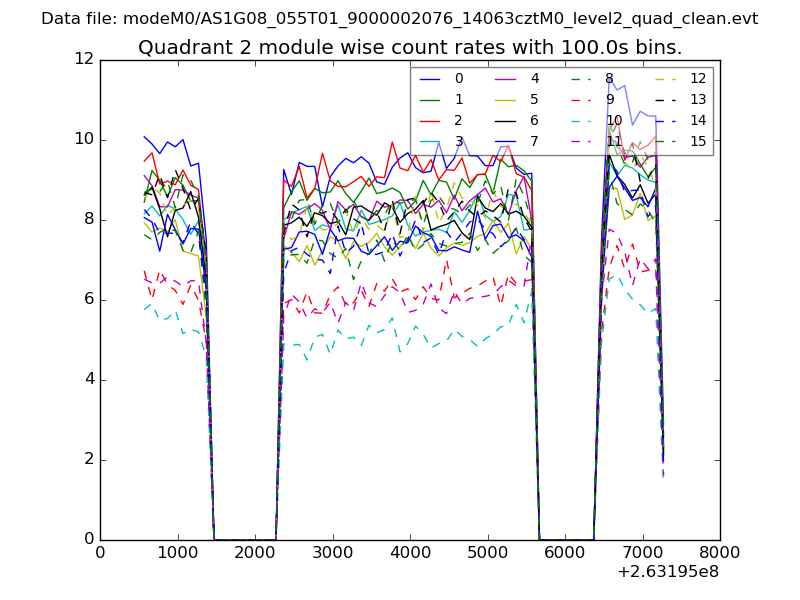 |
 |
| Module-wise count rates for Quadrant D Data is divided into 100 sec bins |
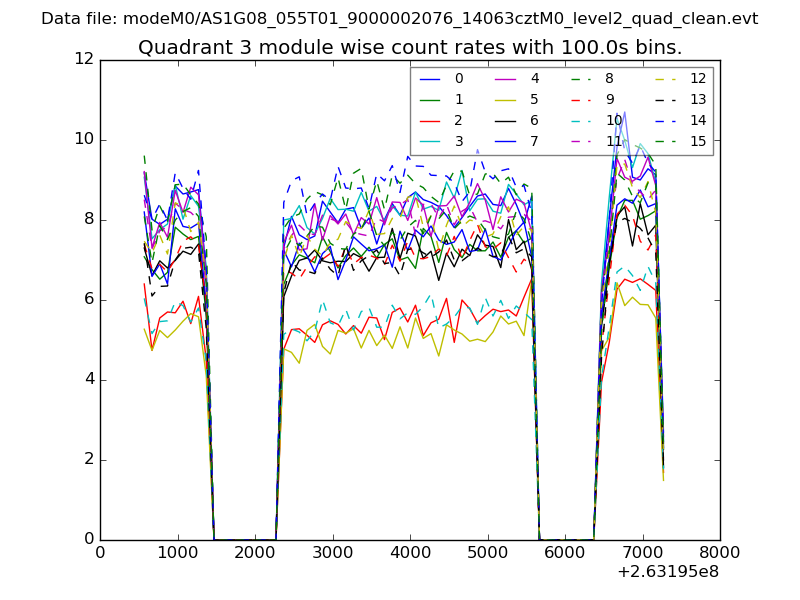 |
 |
| Parameter | Plot |
|---|---|
| CZT HV Monitor | 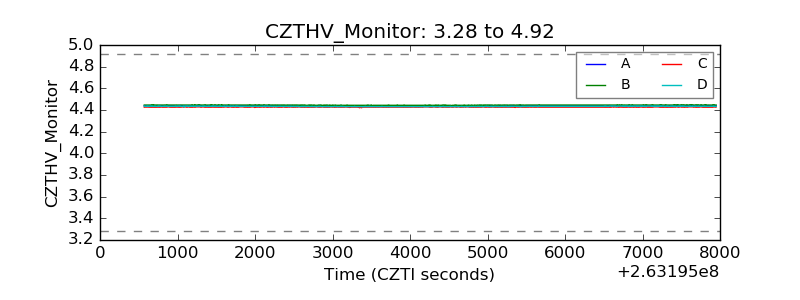 |
| D_VDD | 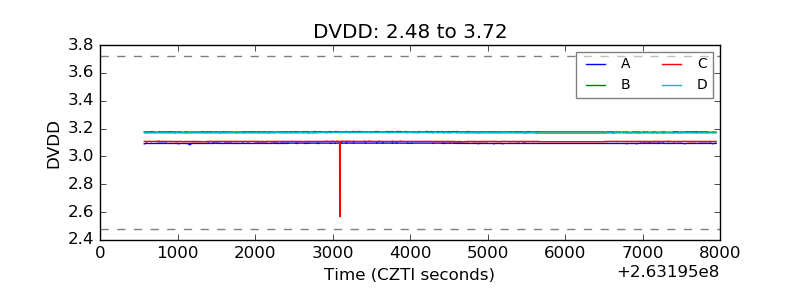 |
| Temperature 1 | 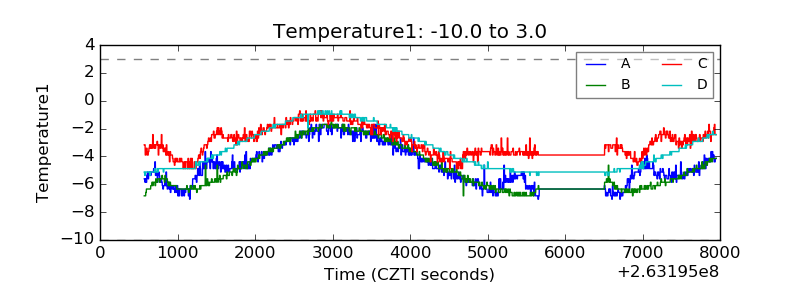 |
| Veto HV Monitor | 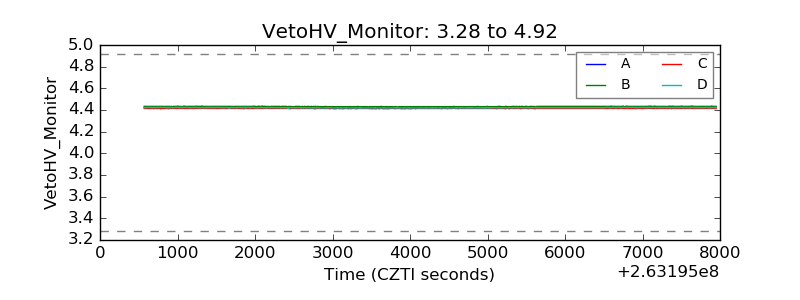 |
| Veto LLD |  |
| Alpha Counter | 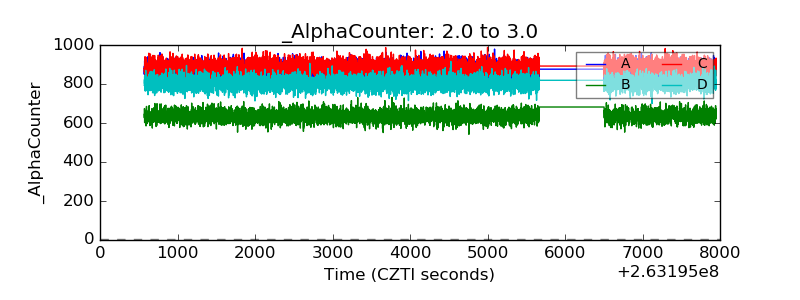 |
| _CPM_Rate | 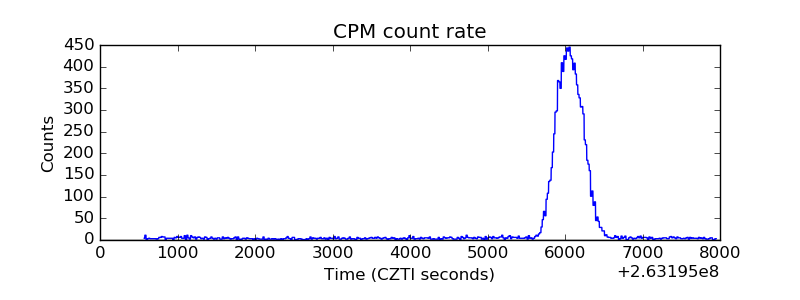 |
| CZT Counter | 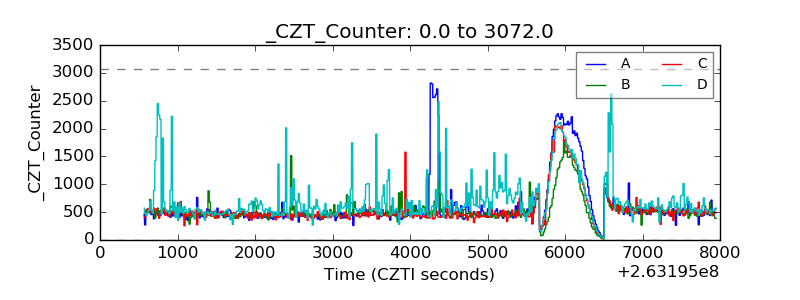 |
| +2.5 Volts monitor |  |
| +5 Volts monitor |  |
| _ROLL_ROT | 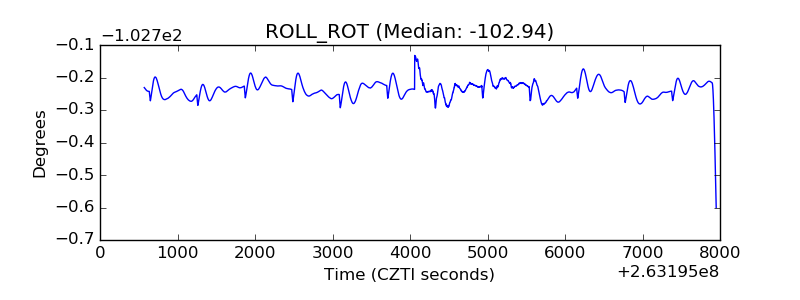 |
| _Roll_DEC | 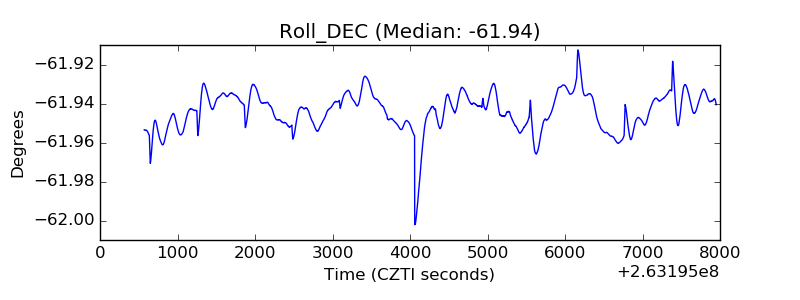 |
| _Roll_RA | 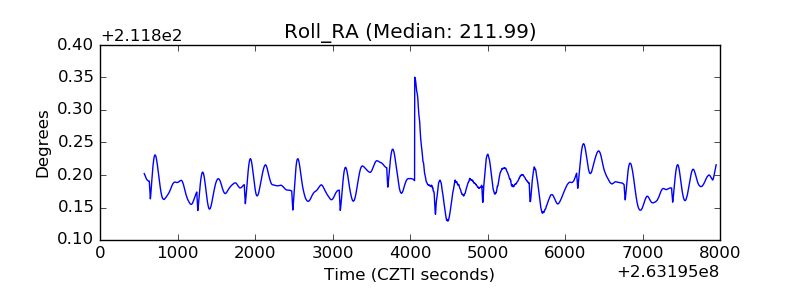 |
| Veto Counter | 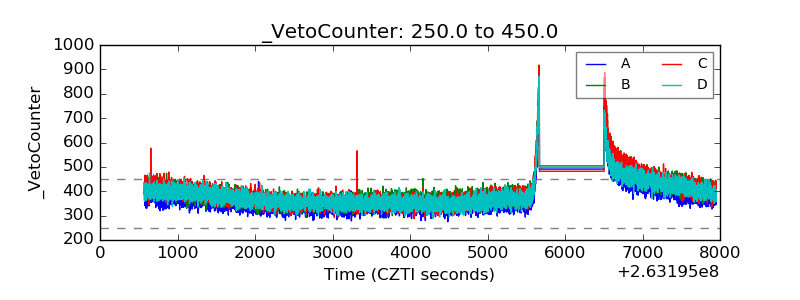 |