| Param | Original file | Final file |
|---|---|---|
| Filename | modeM0/AS1G08_055T01_9000002076_14064cztM0_level2.evt | modeM0/AS1G08_055T01_9000002076_14064cztM0_level2_quad_clean.evt |
| Size (bytes) | 472,904,640 | 90,950,400 |
| Size | 451.0 MB | 86.7 MB |
| Events in quadrant A | 3,066,627 | 587,836 |
| Events in quadrant B | 3,347,714 | 592,510 |
| Events in quadrant C | 3,188,277 | 578,541 |
| Events in quadrant D | 4,289,241 | 553,341 |
| Mode M9 | |||
|---|---|---|---|
| Quadrant | BADHDUFLAG | Total packets | Discarded packets |
| A | 0 | 10 | 0 |
| B | 0 | 10 | 0 |
| C | 0 | 10 | 0 |
| D | 0 | 10 | 0 |
| Mode SS | |||
|---|---|---|---|
| Quadrant | BADHDUFLAG | Total packets | Discarded packets |
| A | 0 | 130 | 0 |
| B | 0 | 130 | 0 |
| C | 0 | 130 | 0 |
| D | 0 | 130 | 0 |
| Mode M0 | |||
|---|---|---|---|
| Quadrant | BADHDUFLAG | Total packets | Discarded packets |
| A | 0 | 13136 | 2 |
| B | 0 | 13835 | 1 |
| C | 0 | 13408 | 1 |
| D | 0 | 17089 | 1 |
| Quadrant | Total seconds | Saturated seconds | Saturation percentage |
|---|---|---|---|
| A | 6329 | 47 | 0.742613% |
| B | 6329 | 95 | 1.501027% |
| C | 6329 | 46 | 0.726813% |
| D | 6329 | 127 | 2.006636% |
Noise dominated data is calculated using 1-second bins in cleaned event files. If a bin has >2000 counts, and if more than 50% of those come from <1% of pixels, then it is considered to be noise-dominated and hence unusable.
| Quadrant | # 1 sec bins | Bins with >0 counts | Bins with >2000 counts | High rate bins dominated by noise | Noise dominated (total time) | Noise dominated (detector-on time) | Marked lightcurve |
|---|---|---|---|---|---|---|---|
| A | 7350 | 6331 | 0 | 0 | 0.00% | 0.00% | 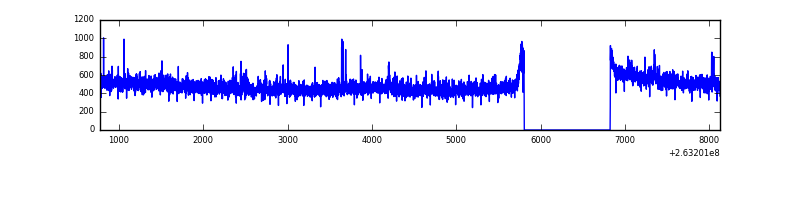 |
| B | 7350 | 6331 | 22 | 22 | 0.30% | 0.35% | 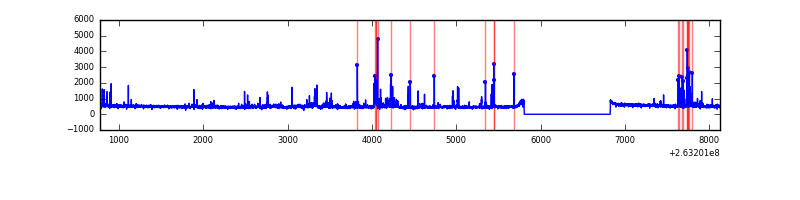 |
| C | 7350 | 6331 | 1 | 1 | 0.01% | 0.02% | 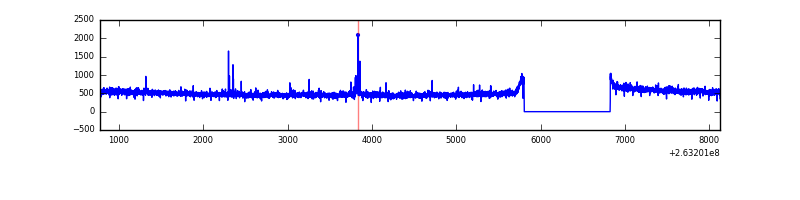 |
| D | 7350 | 6331 | 67 | 67 | 0.91% | 1.06% | 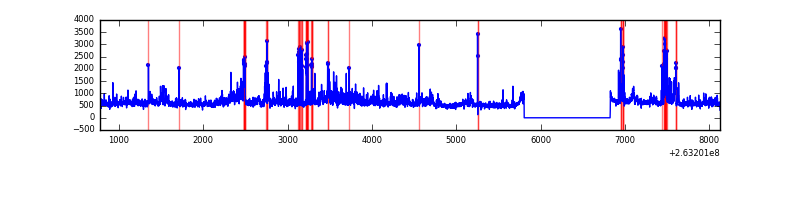 |
Top three noisy pixels from each quadrant. If the there are fewer than three noisy pixels in the level2.evt file, extra rows are filled as -1
| Pixel properties | Quadrant properties | ||||||
|---|---|---|---|---|---|---|---|
| Quadrant | DetID | PixID | Counts | Sigma | Mean | Median | Sigma |
| A | 12 | 189 | 62126 | 394.37 | 772 | 756 | 155.6 |
| A | 8 | 15 | 32774 | 205.75 | 772 | 756 | 155.6 |
| A | 0 | 226 | 6758 | 38.57 | 772 | 756 | 155.6 |
| B | 4 | 80 | 88111 | 607.19 | 769 | 751 | 143.9 |
| B | 4 | 48 | 72370 | 497.78 | 769 | 751 | 143.9 |
| B | 0 | 189 | 53624 | 367.49 | 769 | 751 | 143.9 |
| C | 3 | 233 | 234049 | 1359.0 | 749 | 753 | 171.7 |
| C | 0 | 207 | 29168 | 165.52 | 749 | 753 | 171.7 |
| C | 13 | 61 | 5458 | 27.41 | 749 | 753 | 171.7 |
| D | 1 | 52 | 567631 | 3161.65 | 742 | 724 | 179.3 |
| D | 8 | 195 | 322684 | 1795.58 | 742 | 724 | 179.3 |
| D | 12 | 110 | 219195 | 1218.42 | 742 | 724 | 179.3 |
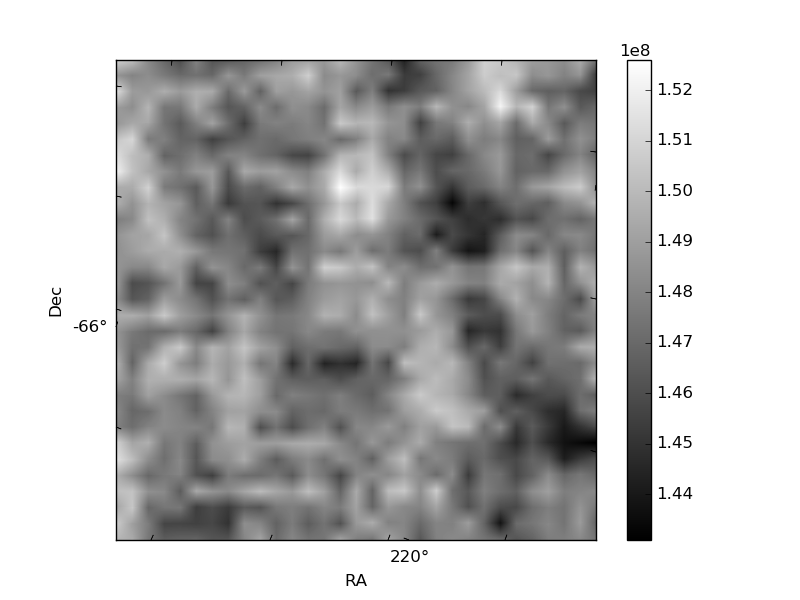
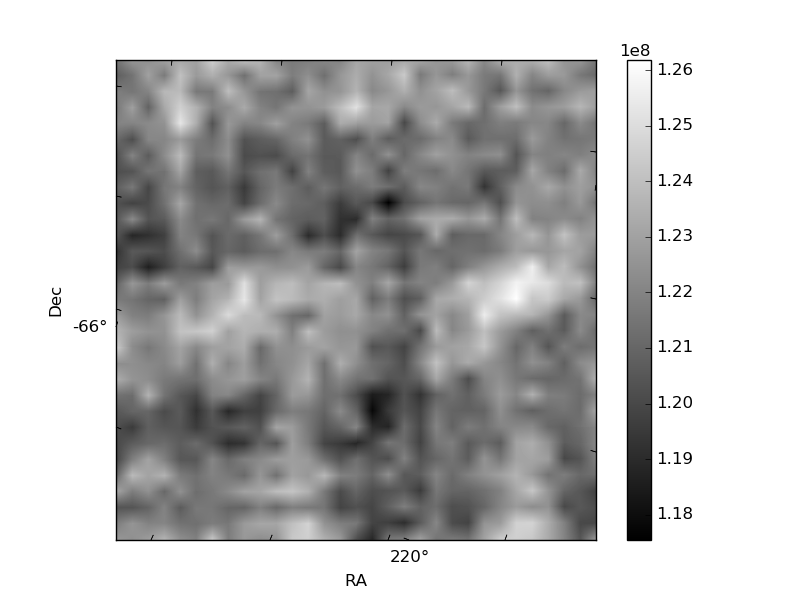
Histogram calculated using DETX and DETY for each event in the final _common_clean file
| Quadrant A |  |
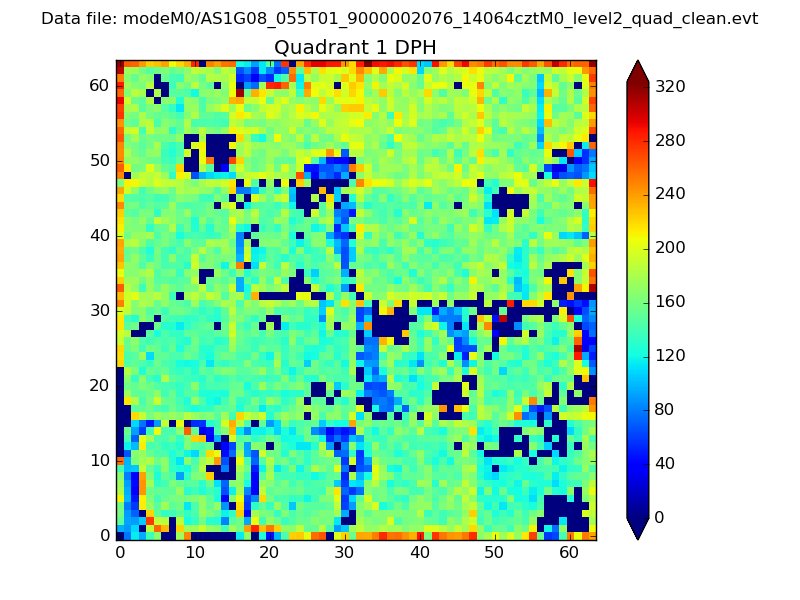 |
Quadrant B |
|---|---|---|---|
| Quadrant D | 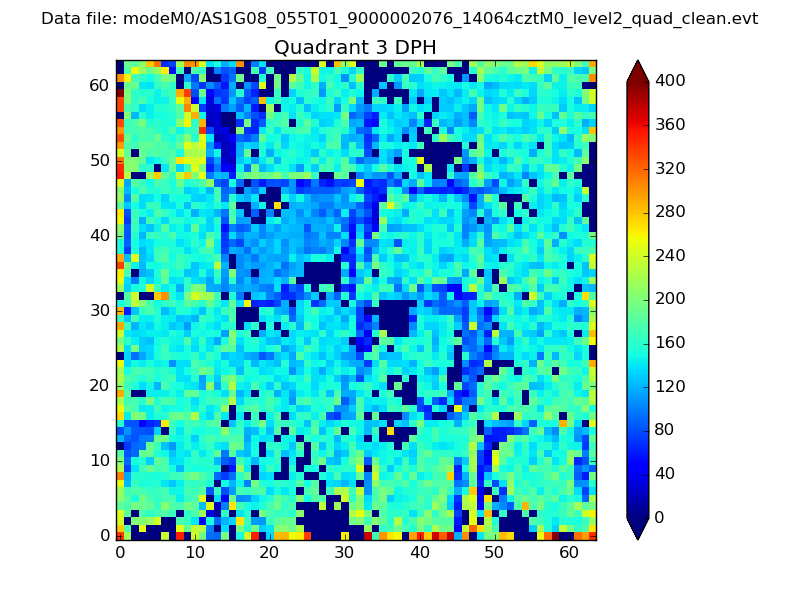 |
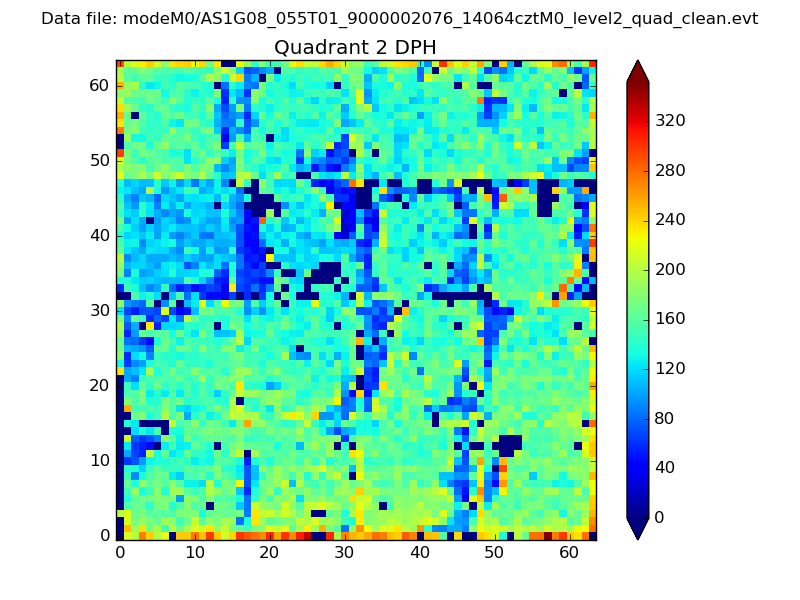 |
Quadrant C |
| Plot type | Count rate plots | Images |
|---|---|---|
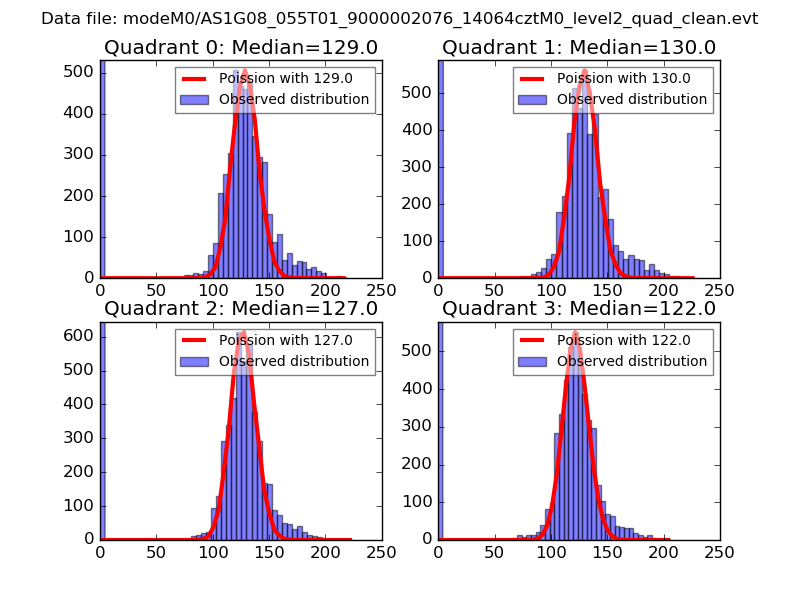
| Comparison with Poisson distribution Blue bars denote a histogram of data divided into 1 sec bins. Red curve is a Poisson curve with rate = median count rate of data. |
 |
 |
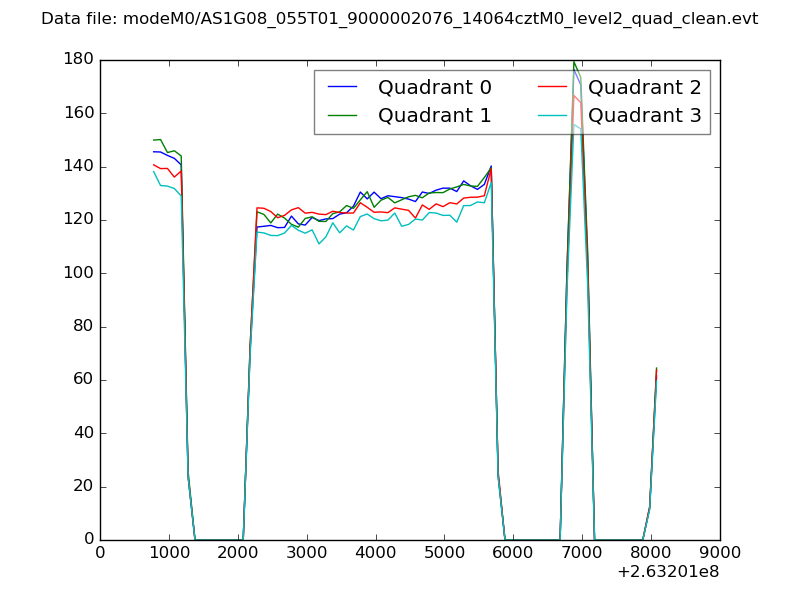
| Quadrant-wise count rates Data is divided into 100 sec bins |
 |
|
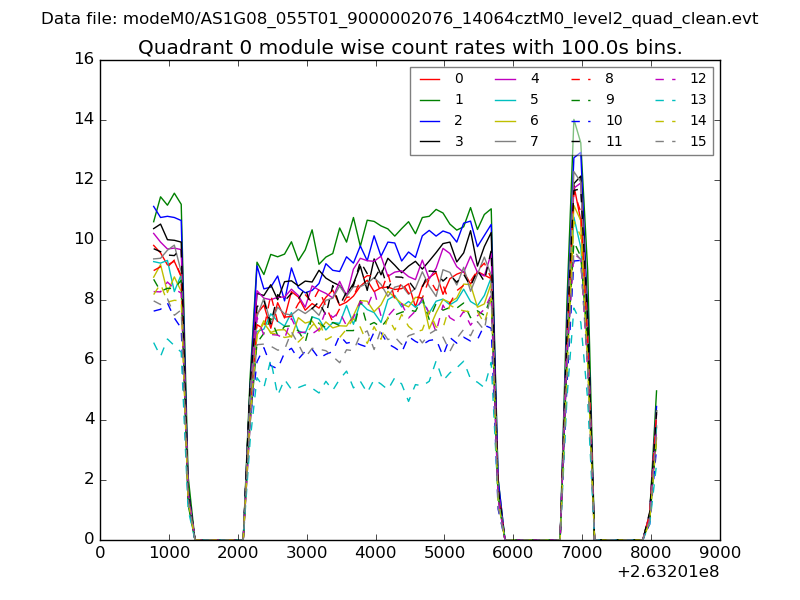
| Module-wise count rates for Quadrant A Data is divided into 100 sec bins |
 |
 |
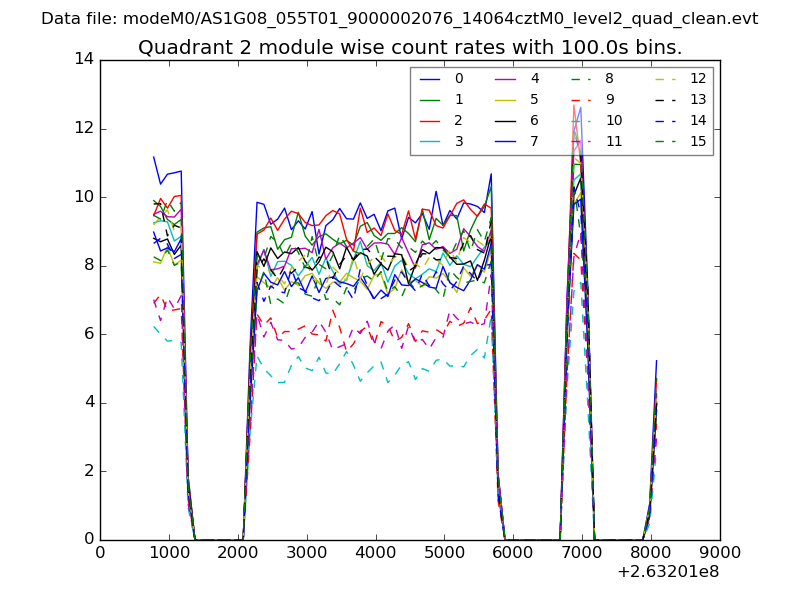
| Module-wise count rates for Quadrant B Data is divided into 100 sec bins |
 |
 |
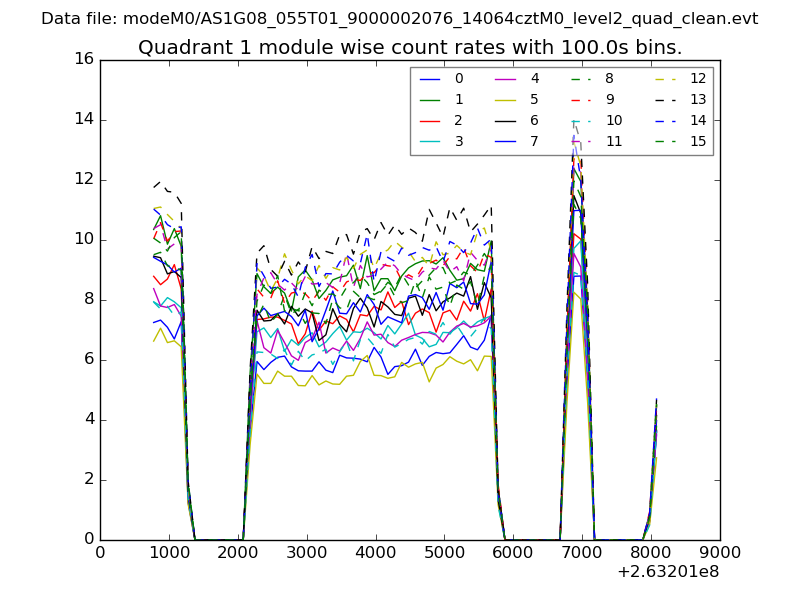
| Module-wise count rates for Quadrant C Data is divided into 100 sec bins |
 |
 |
| Module-wise count rates for Quadrant D Data is divided into 100 sec bins |
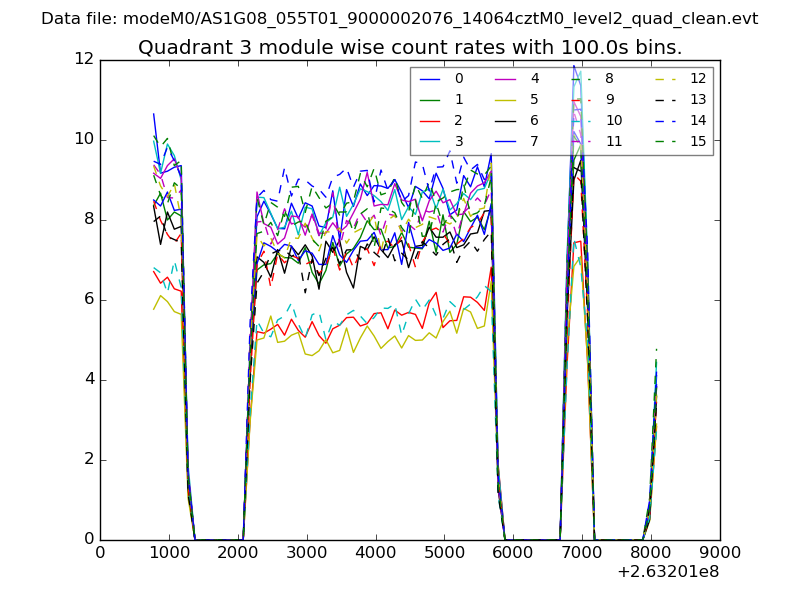 |
 |
| Parameter | Plot |
|---|---|
| CZT HV Monitor | 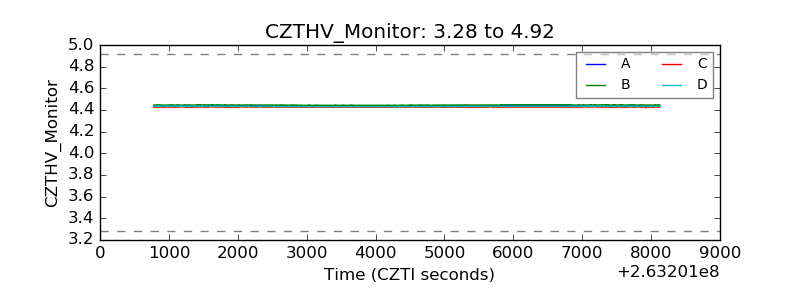 |
| D_VDD | 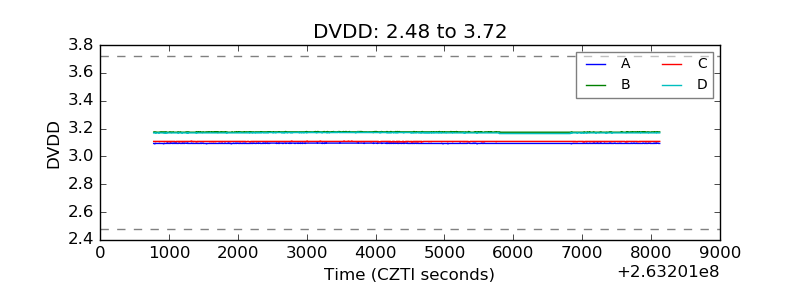 |
| Temperature 1 | 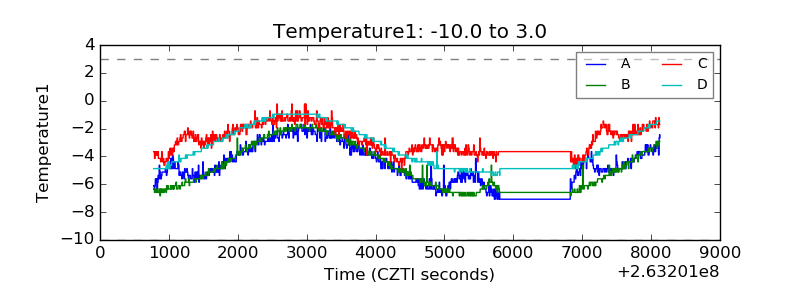 |
| Veto HV Monitor | 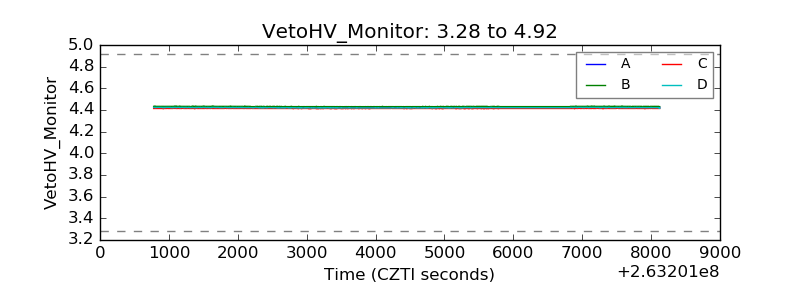 |
| Veto LLD | 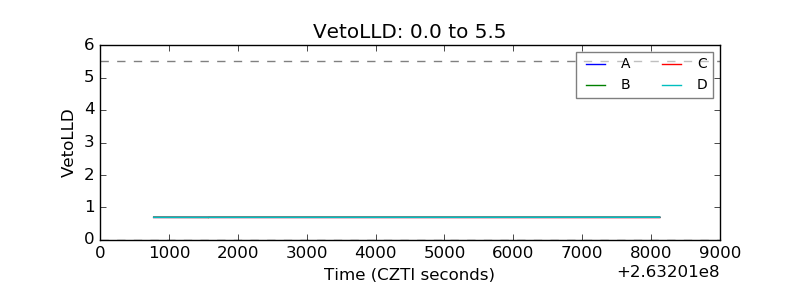 |
| Alpha Counter | 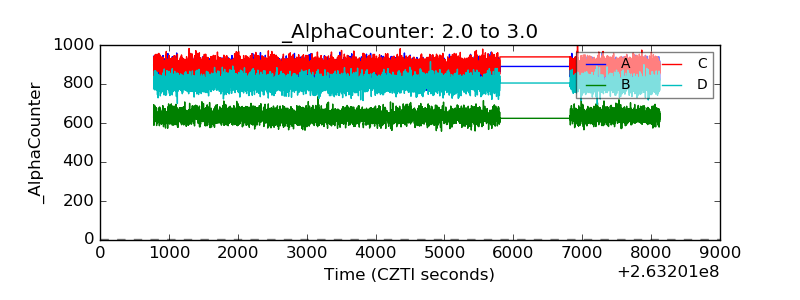 |
| _CPM_Rate |  |
| CZT Counter | 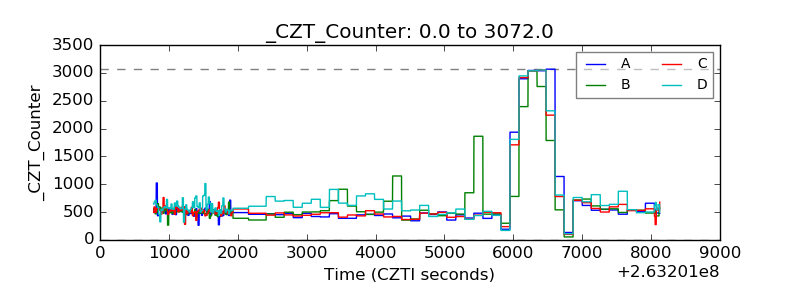 |
| +2.5 Volts monitor | 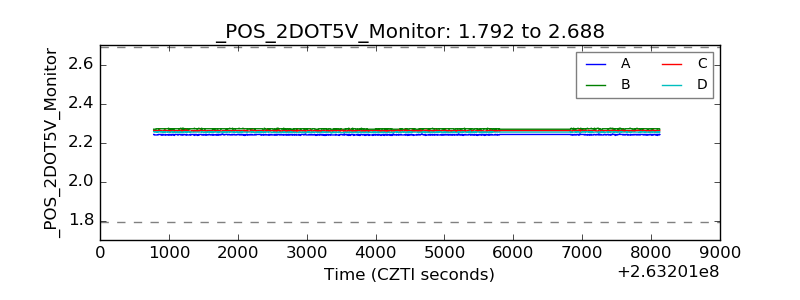 |
| +5 Volts monitor | 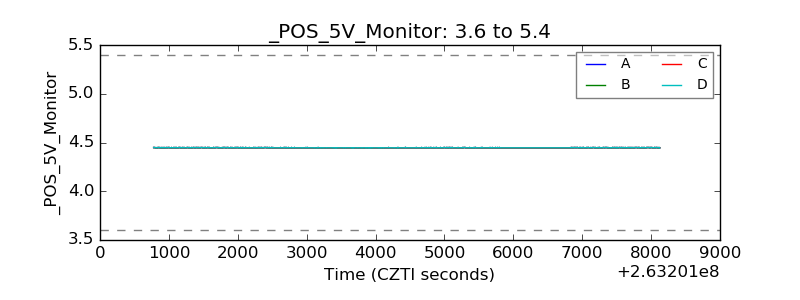 |
| _ROLL_ROT | 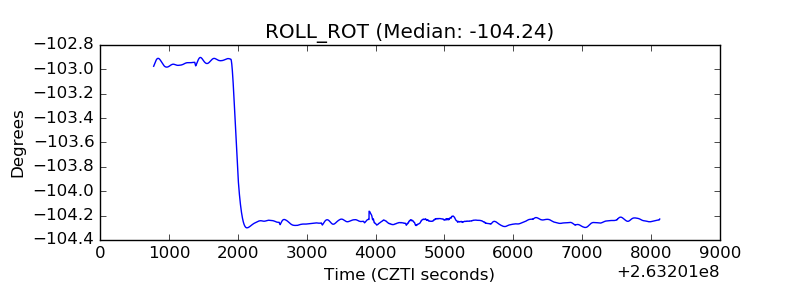 |
| _Roll_DEC |  |
| _Roll_RA | 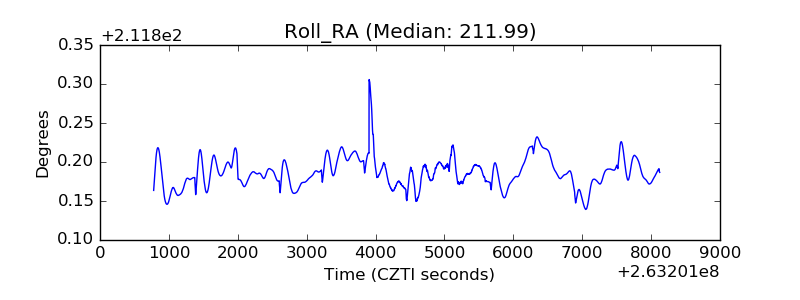 |
| Veto Counter |  |