| Param | Original file | Final file |
|---|---|---|
| Filename | modeM0/AS1G08_055T01_9000002076_14066cztM0_level2.evt | modeM0/AS1G08_055T01_9000002076_14066cztM0_level2_quad_clean.evt |
| Size (bytes) | 484,896,960 | 91,212,480 |
| Size | 462.4 MB | 87.0 MB |
| Events in quadrant A | 3,152,055 | 595,804 |
| Events in quadrant B | 3,409,191 | 596,749 |
| Events in quadrant C | 3,171,894 | 582,945 |
| Events in quadrant D | 4,533,348 | 556,018 |
| Mode M9 | |||
|---|---|---|---|
| Quadrant | BADHDUFLAG | Total packets | Discarded packets |
| A | 0 | 12 | 0 |
| B | 0 | 12 | 0 |
| C | 0 | 12 | 0 |
| D | 0 | 12 | 0 |
| Mode SS | |||
|---|---|---|---|
| Quadrant | BADHDUFLAG | Total packets | Discarded packets |
| A | 0 | 124 | 0 |
| B | 0 | 124 | 0 |
| C | 0 | 124 | 0 |
| D | 0 | 124 | 0 |
| Mode M0 | |||
|---|---|---|---|
| Quadrant | BADHDUFLAG | Total packets | Discarded packets |
| A | 0 | 13339 | 2 |
| B | 0 | 14007 | 1 |
| C | 0 | 13383 | 1 |
| D | 0 | 17895 | 1 |
| Quadrant | Total seconds | Saturated seconds | Saturation percentage |
|---|---|---|---|
| A | 6176 | 85 | 1.376295% |
| B | 6176 | 120 | 1.943005% |
| C | 6176 | 72 | 1.165803% |
| D | 6176 | 158 | 2.558290% |
Noise dominated data is calculated using 1-second bins in cleaned event files. If a bin has >2000 counts, and if more than 50% of those come from <1% of pixels, then it is considered to be noise-dominated and hence unusable.
| Quadrant | # 1 sec bins | Bins with >0 counts | Bins with >2000 counts | High rate bins dominated by noise | Noise dominated (total time) | Noise dominated (detector-on time) | Marked lightcurve |
|---|---|---|---|---|---|---|---|
| A | 7302 | 6177 | 0 | 0 | 0.00% | 0.00% | 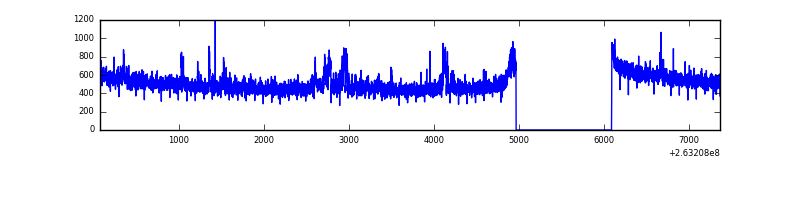 |
| B | 7302 | 6177 | 18 | 18 | 0.25% | 0.29% | 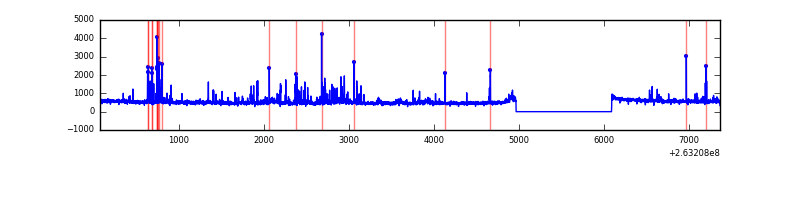 |
| C | 7302 | 6178 | 3 | 3 | 0.04% | 0.05% | 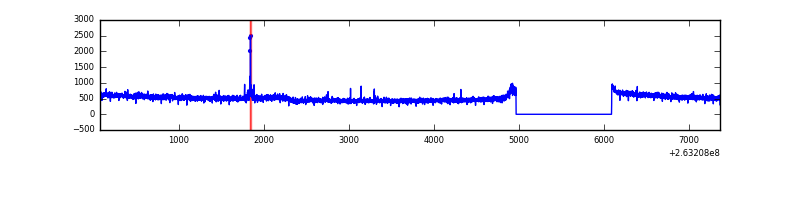 |
| D | 7302 | 6177 | 65 | 65 | 0.89% | 1.05% | 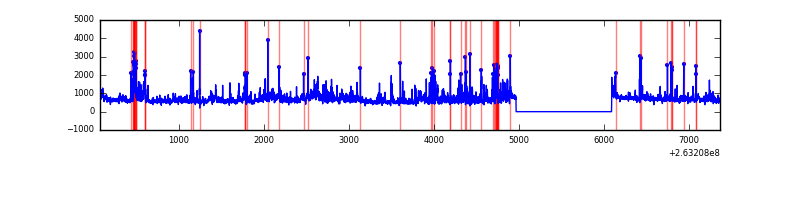 |
Top three noisy pixels from each quadrant. If the there are fewer than three noisy pixels in the level2.evt file, extra rows are filled as -1
| Pixel properties | Quadrant properties | ||||||
|---|---|---|---|---|---|---|---|
| Quadrant | DetID | PixID | Counts | Sigma | Mean | Median | Sigma |
| A | 12 | 189 | 123047 | 777.66 | 784 | 770 | 157.2 |
| A | 8 | 15 | 14691 | 88.54 | 784 | 770 | 157.2 |
| A | 0 | 226 | 7026 | 39.79 | 784 | 770 | 157.2 |
| B | 4 | 80 | 67417 | 460.61 | 778 | 759 | 144.7 |
| B | 4 | 48 | 55658 | 379.36 | 778 | 759 | 144.7 |
| B | 0 | 189 | 45746 | 310.86 | 778 | 759 | 144.7 |
| C | 3 | 233 | 202843 | 1168.87 | 754 | 758 | 172.9 |
| C | 0 | 207 | 25941 | 145.66 | 754 | 758 | 172.9 |
| C | 13 | 61 | 5416 | 26.94 | 754 | 758 | 172.9 |
| D | 10 | 172 | 368319 | 1959.4 | 749 | 730 | 187.6 |
| D | 1 | 52 | 354790 | 1887.29 | 749 | 730 | 187.6 |
| D | 8 | 195 | 280419 | 1490.86 | 749 | 730 | 187.6 |
Histogram calculated using DETX and DETY for each event in the final _common_clean file
| Quadrant A | 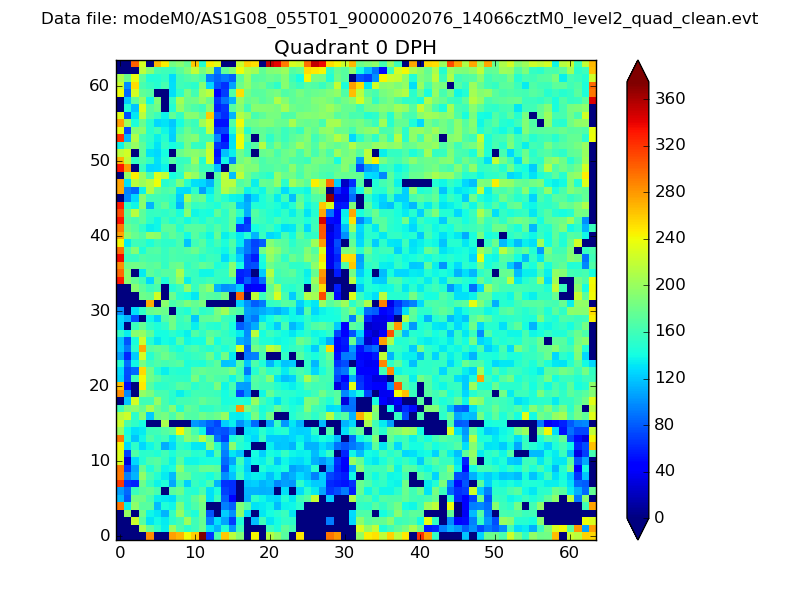 |
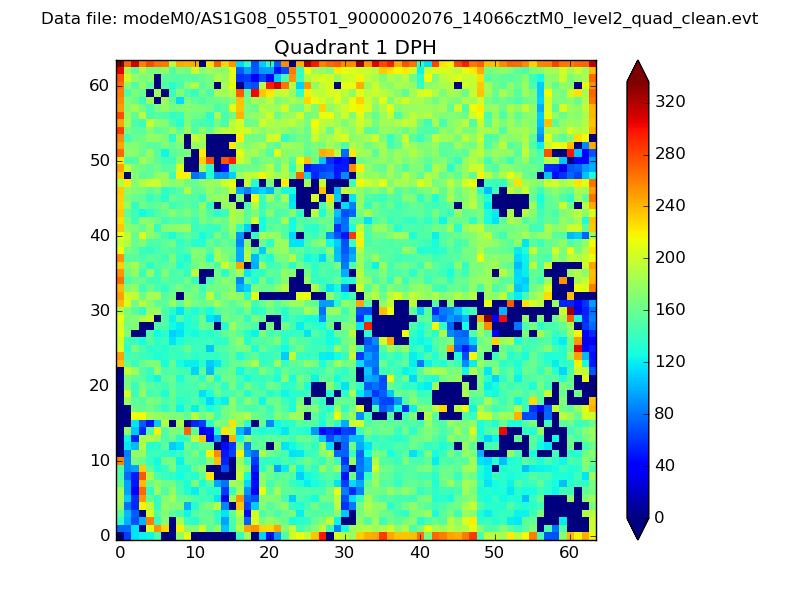 |
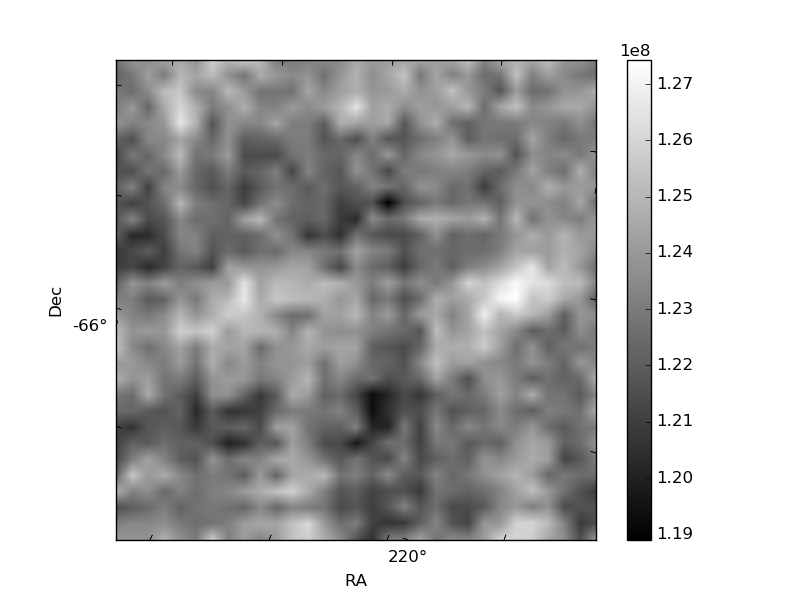
Quadrant B |
|---|---|---|---|
| Quadrant D |  |
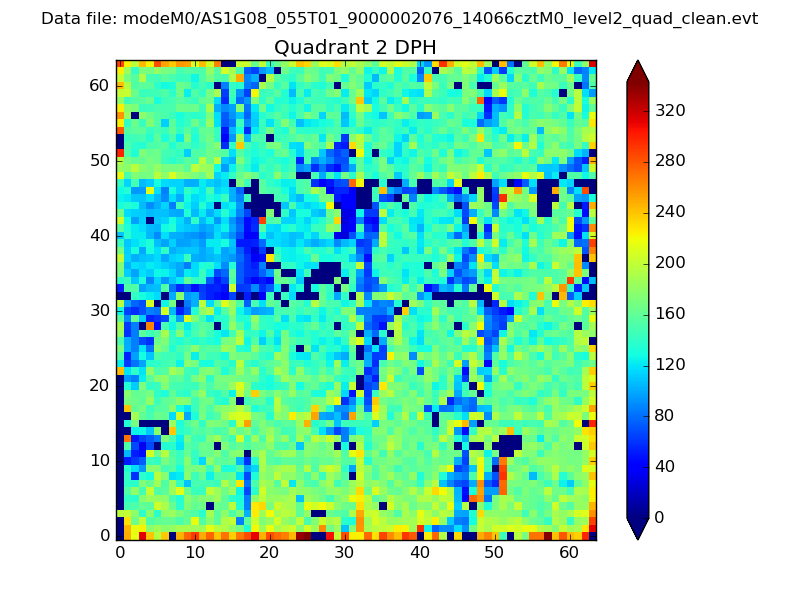 |
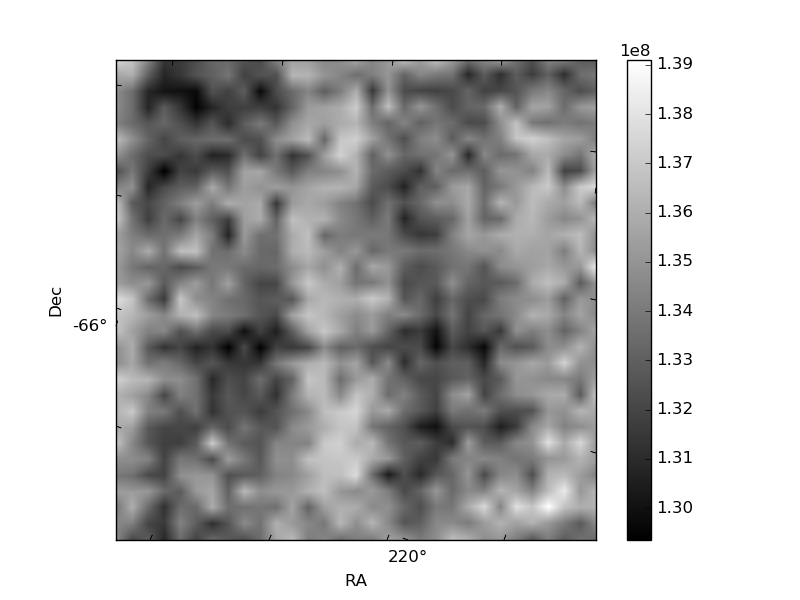
Quadrant C |
| Plot type | Count rate plots | Images |
|---|---|---|
| Comparison with Poisson distribution Blue bars denote a histogram of data divided into 1 sec bins. Red curve is a Poisson curve with rate = median count rate of data. |
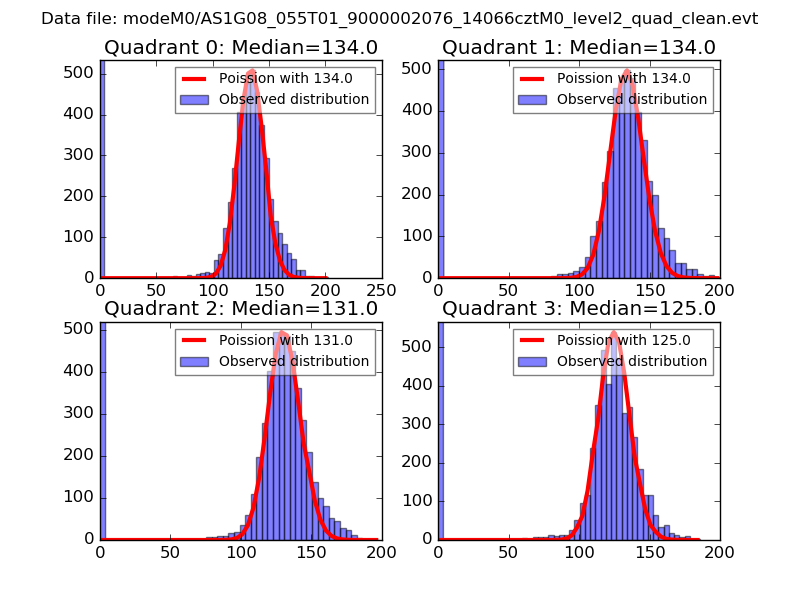 |
 |
| Quadrant-wise count rates Data is divided into 100 sec bins |
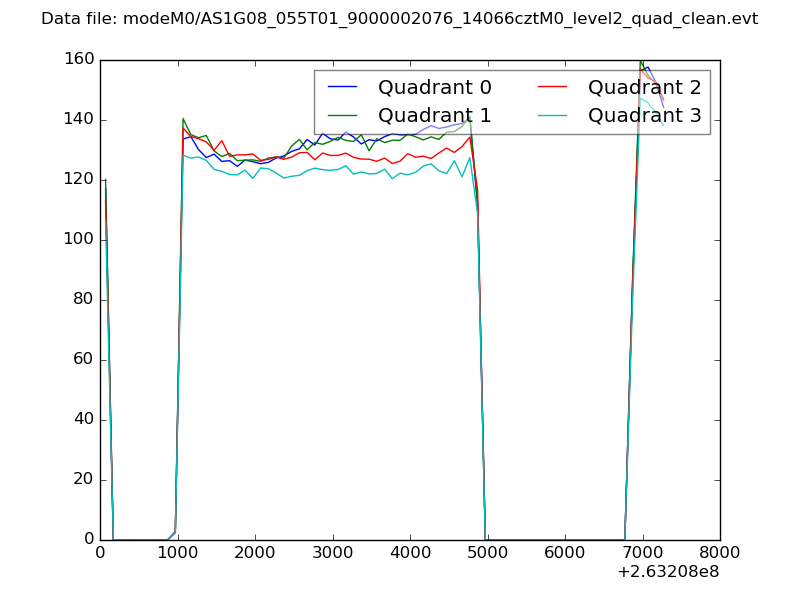 |
|
| Module-wise count rates for Quadrant A Data is divided into 100 sec bins |
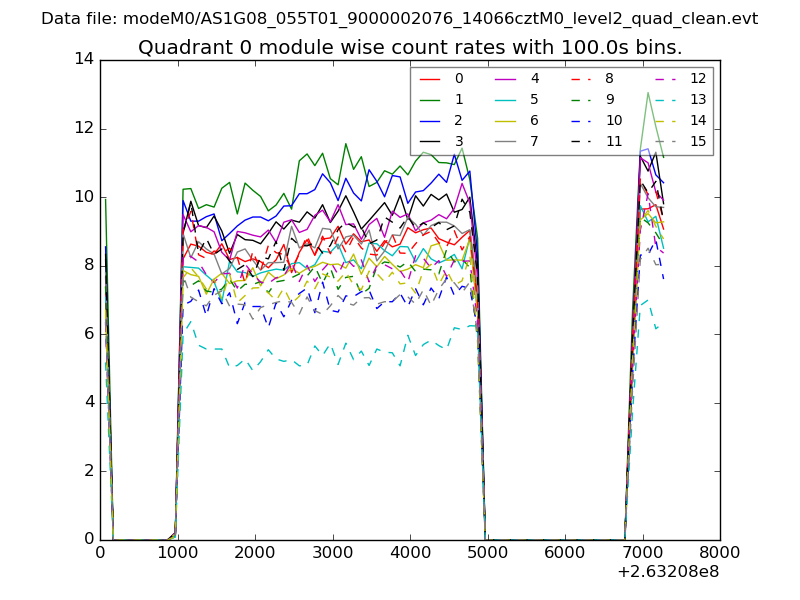 |
 |
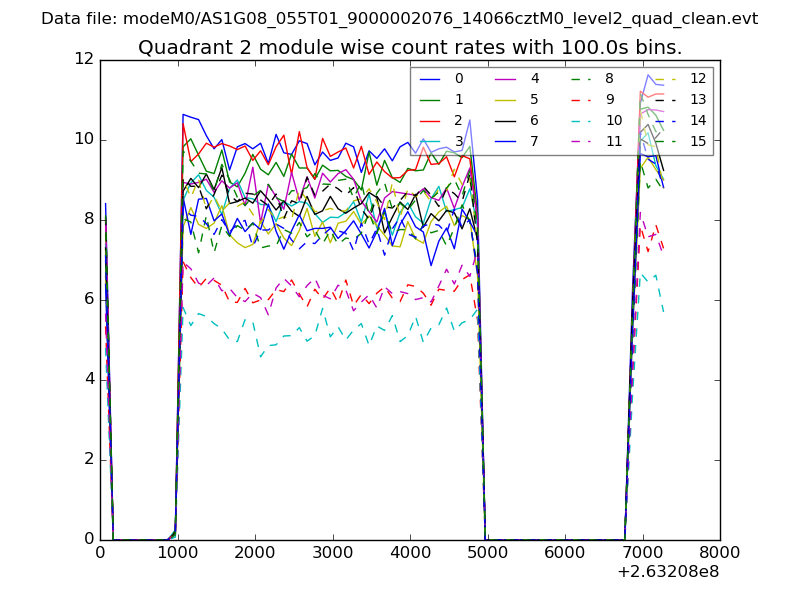
| Module-wise count rates for Quadrant B Data is divided into 100 sec bins |
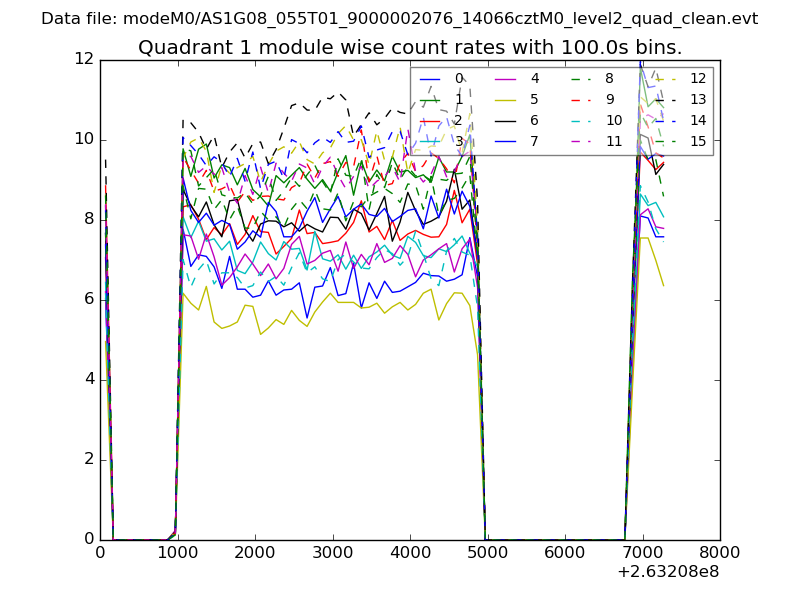 |
 |
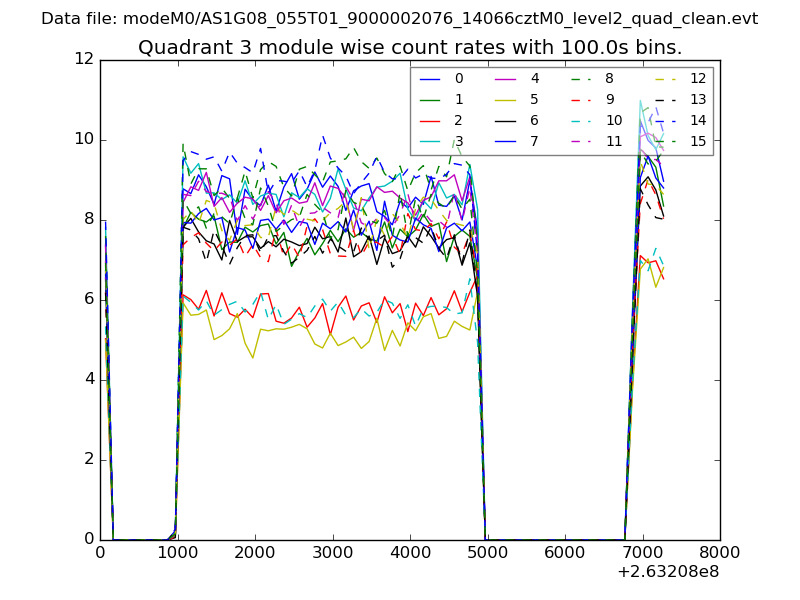
| Module-wise count rates for Quadrant C Data is divided into 100 sec bins |
 |
 |
| Module-wise count rates for Quadrant D Data is divided into 100 sec bins |
 |
 |
| Parameter | Plot |
|---|---|
| CZT HV Monitor | 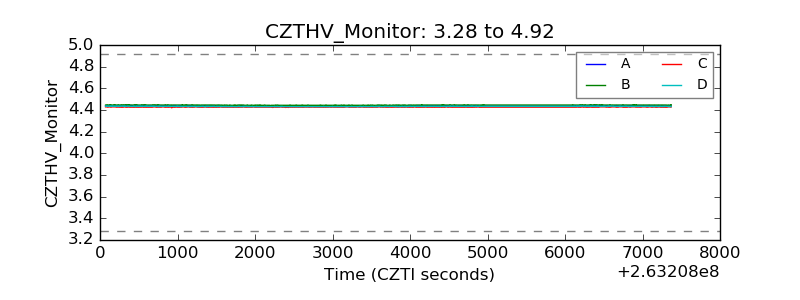 |
| D_VDD | 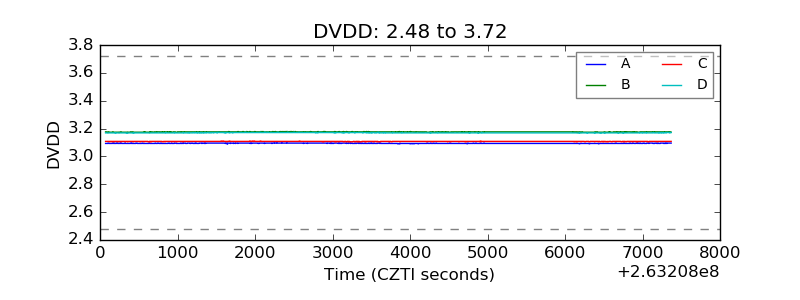 |
| Temperature 1 | 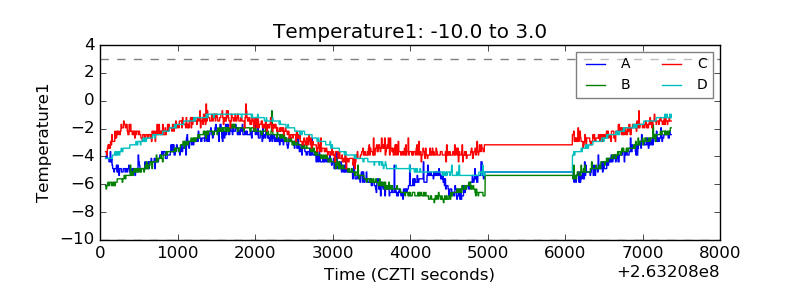 |
| Veto HV Monitor |  |
| Veto LLD | 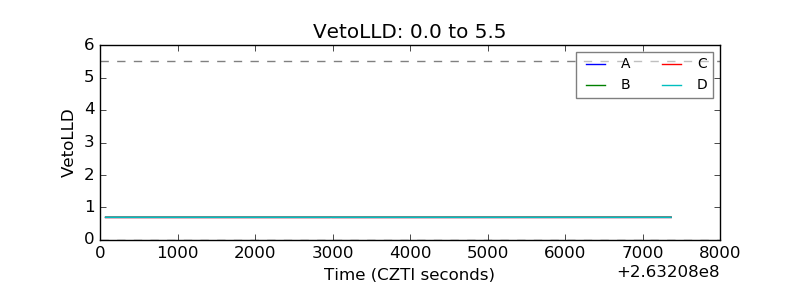 |
| Alpha Counter | 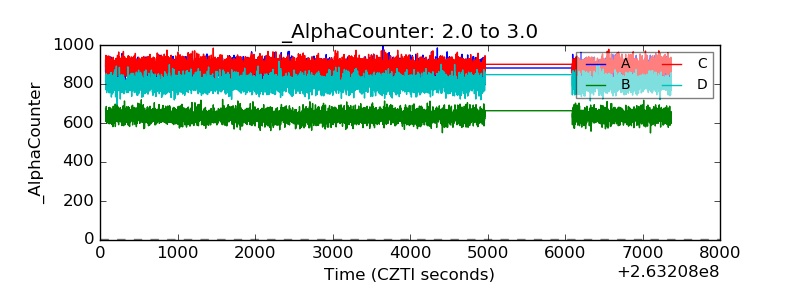 |
| _CPM_Rate |  |
| CZT Counter | 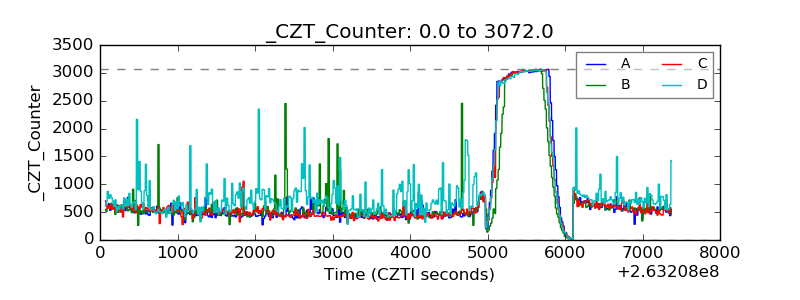 |
| +2.5 Volts monitor |  |
| +5 Volts monitor |  |
| _ROLL_ROT | 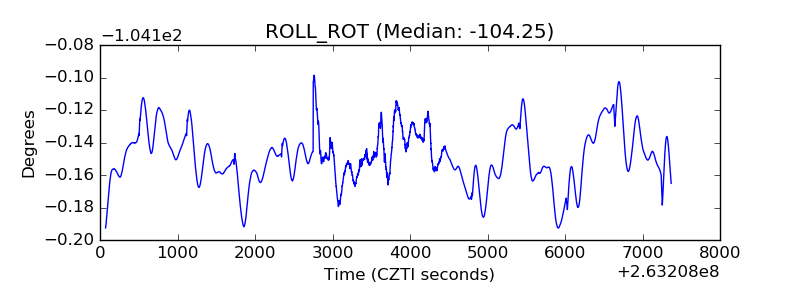 |
| _Roll_DEC | 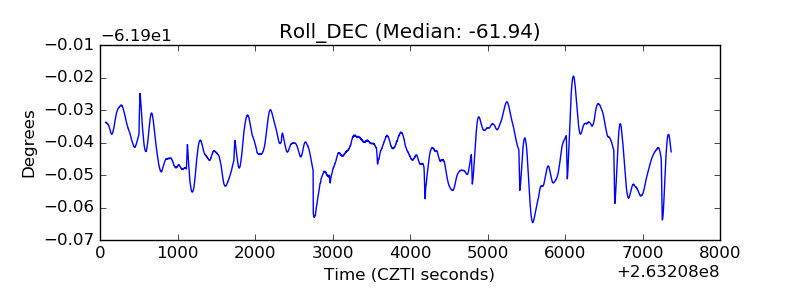 |
| _Roll_RA | 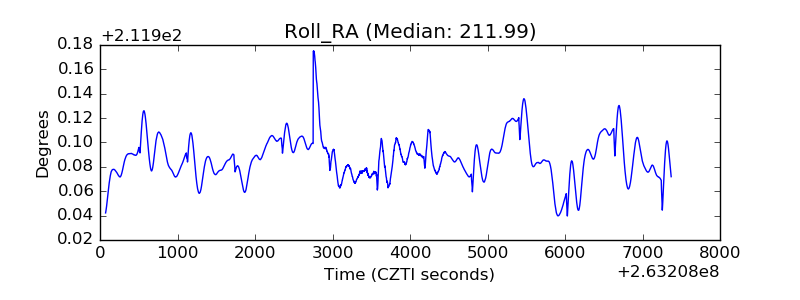 |
| Veto Counter | 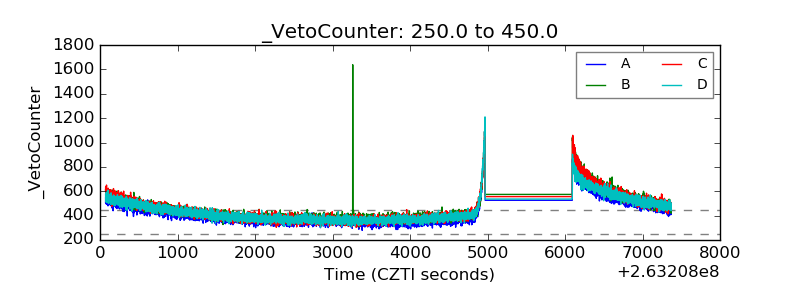 |