| Param | Original file | Final file |
|---|---|---|
| Filename | modeM0/AS1G08_055T01_9000002076_14068cztM0_level2.evt | modeM0/AS1G08_055T01_9000002076_14068cztM0_level2_quad_clean.evt |
| Size (bytes) | 539,409,600 | 135,901,440 |
| Size | 514.4 MB | 129.6 MB |
| Events in quadrant A | 3,210,618 | 952,466 |
| Events in quadrant B | 4,018,713 | 953,432 |
| Events in quadrant C | 3,181,495 | 915,978 |
| Events in quadrant D | 5,512,673 | 868,946 |
| Mode M9 | |||
|---|---|---|---|
| Quadrant | BADHDUFLAG | Total packets | Discarded packets |
| A | 0 | 14 | 0 |
| B | 0 | 14 | 0 |
| C | 0 | 14 | 0 |
| D | 0 | 14 | 0 |
| Mode SS | |||
|---|---|---|---|
| Quadrant | BADHDUFLAG | Total packets | Discarded packets |
| A | 0 | 122 | 0 |
| B | 0 | 122 | 0 |
| C | 0 | 122 | 0 |
| D | 0 | 122 | 0 |
| Mode M0 | |||
|---|---|---|---|
| Quadrant | BADHDUFLAG | Total packets | Discarded packets |
| A | 0 | 13460 | 2 |
| B | 0 | 15972 | 1 |
| C | 0 | 13388 | 1 |
| D | 0 | 20842 | 1 |
| Quadrant | Total seconds | Saturated seconds | Saturation percentage |
|---|---|---|---|
| A | 6101 | 89 | 1.458777% |
| B | 6101 | 248 | 4.064907% |
| C | 6101 | 84 | 1.376823% |
| D | 6101 | 198 | 3.245370% |
Noise dominated data is calculated using 1-second bins in cleaned event files. If a bin has >2000 counts, and if more than 50% of those come from <1% of pixels, then it is considered to be noise-dominated and hence unusable.
| Quadrant | # 1 sec bins | Bins with >0 counts | Bins with >2000 counts | High rate bins dominated by noise | Noise dominated (total time) | Noise dominated (detector-on time) | Marked lightcurve |
|---|---|---|---|---|---|---|---|
| A | 7407 | 6103 | 0 | 0 | 0.00% | 0.00% | 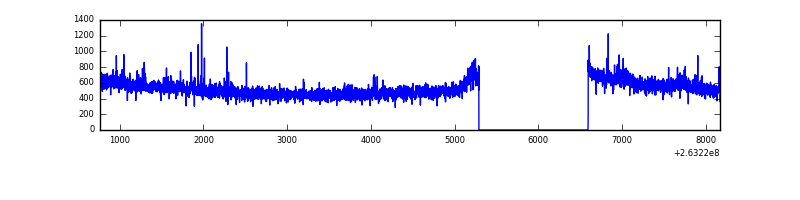 |
| B | 7407 | 6103 | 114 | 114 | 1.54% | 1.87% | 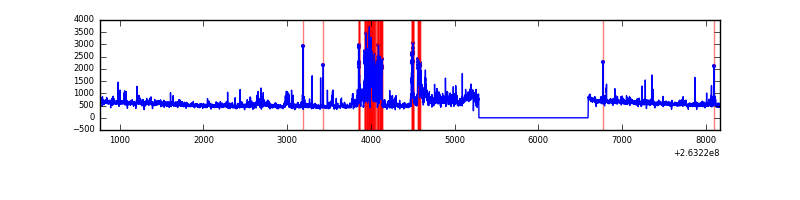 |
| C | 7407 | 6103 | 6 | 6 | 0.08% | 0.10% | 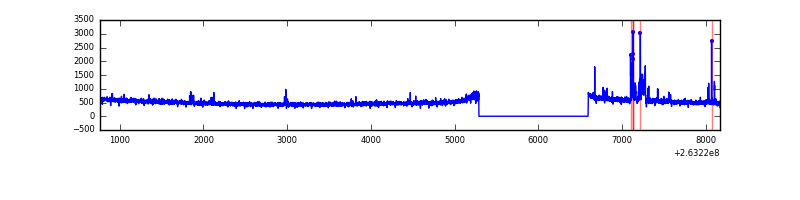 |
| D | 7407 | 6103 | 100 | 100 | 1.35% | 1.64% | 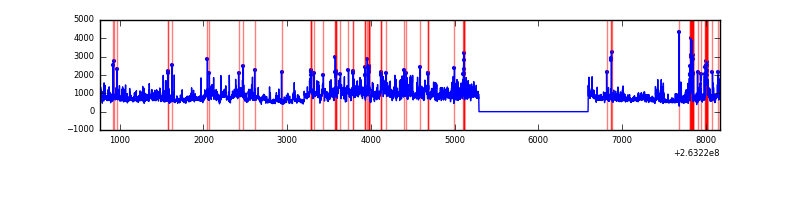 |
Top three noisy pixels from each quadrant. If the there are fewer than three noisy pixels in the level2.evt file, extra rows are filled as -1
| Pixel properties | Quadrant properties | ||||||
|---|---|---|---|---|---|---|---|
| Quadrant | DetID | PixID | Counts | Sigma | Mean | Median | Sigma |
| A | 12 | 189 | 68409 | 418.72 | 812 | 798 | 161.5 |
| A | 8 | 15 | 15419 | 90.55 | 812 | 798 | 161.5 |
| A | 0 | 226 | 7324 | 40.42 | 812 | 798 | 161.5 |
| B | 10 | 16 | 484121 | 3300.49 | 802 | 788 | 146.4 |
| B | 0 | 85 | 228063 | 1551.97 | 802 | 788 | 146.4 |
| B | 3 | 209 | 49894 | 335.33 | 802 | 788 | 146.4 |
| C | 0 | 207 | 128486 | 740.22 | 765 | 771 | 172.5 |
| C | 3 | 233 | 67927 | 389.23 | 765 | 771 | 172.5 |
| C | 13 | 61 | 5669 | 28.39 | 765 | 771 | 172.5 |
| D | 1 | 52 | 1246354 | 6994.83 | 761 | 744 | 178.1 |
| D | 13 | 104 | 528608 | 2964.26 | 761 | 744 | 178.1 |
| D | 12 | 110 | 178265 | 996.88 | 761 | 744 | 178.1 |
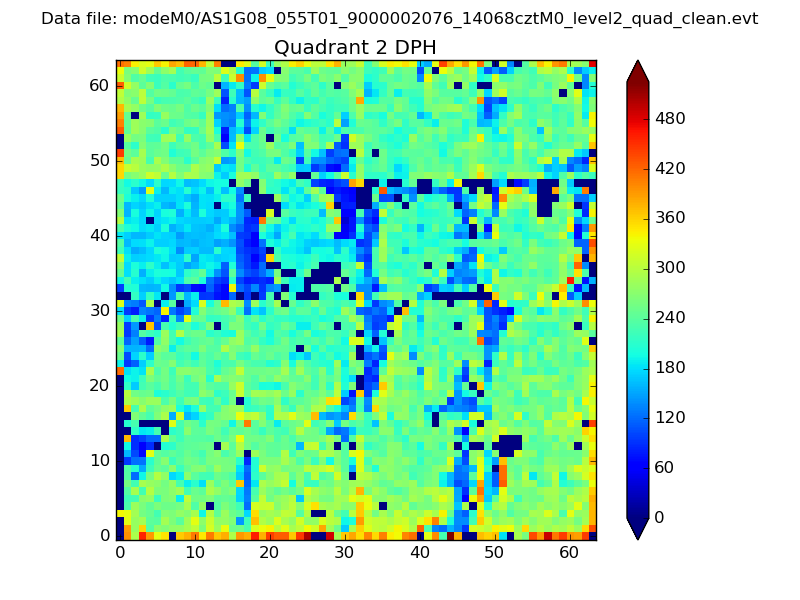
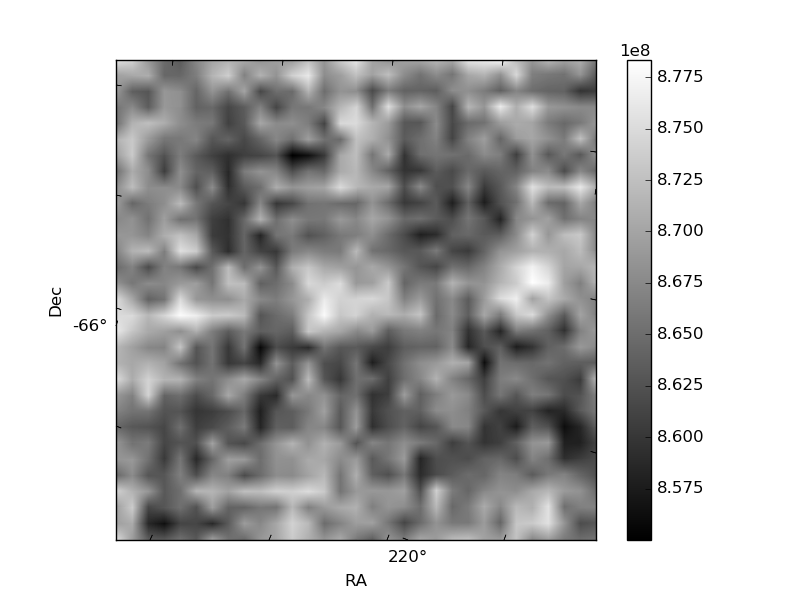
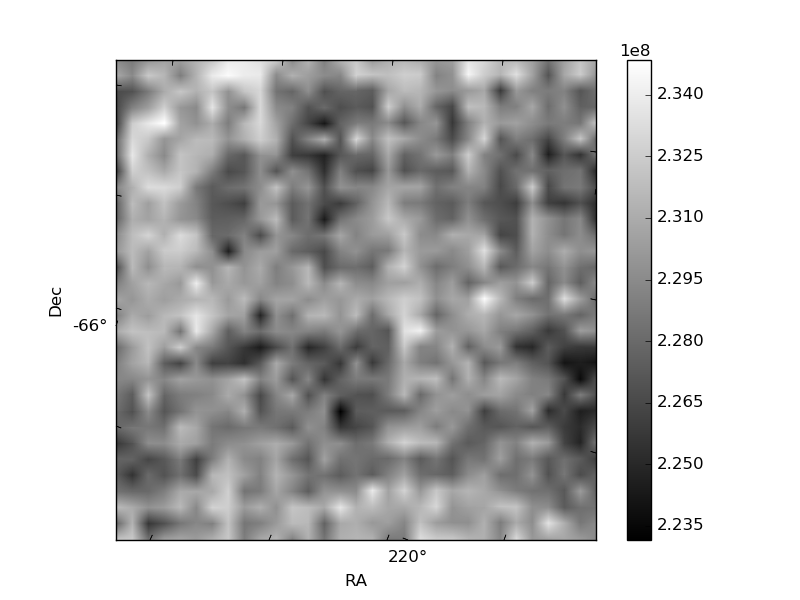
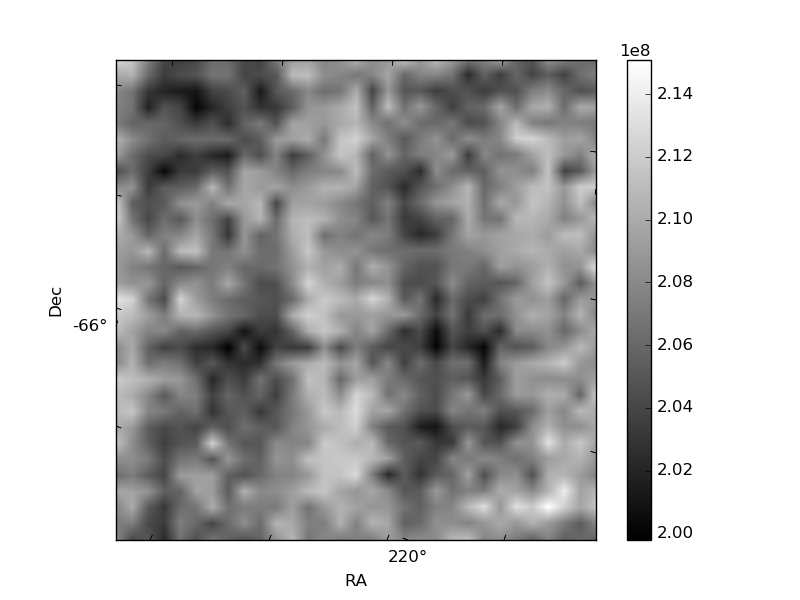
Histogram calculated using DETX and DETY for each event in the final _common_clean file
| Quadrant A | 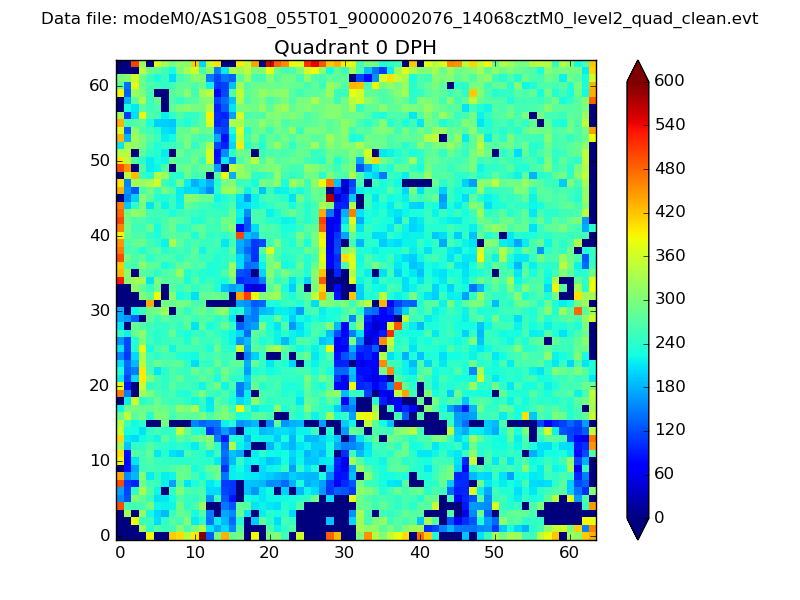 |
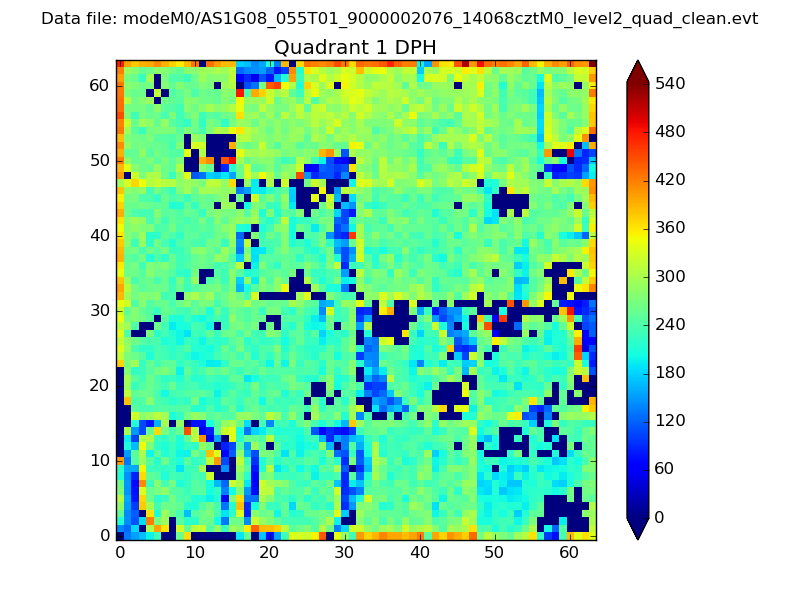 |
Quadrant B |
|---|---|---|---|
| Quadrant D | 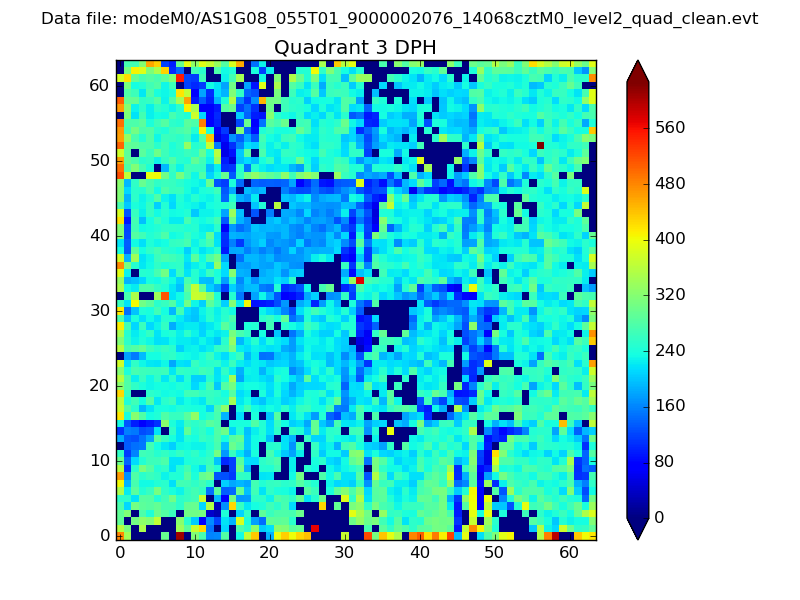 |
 |
Quadrant C |
| Plot type | Count rate plots | Images |
|---|---|---|
| Comparison with Poisson distribution Blue bars denote a histogram of data divided into 1 sec bins. Red curve is a Poisson curve with rate = median count rate of data. |
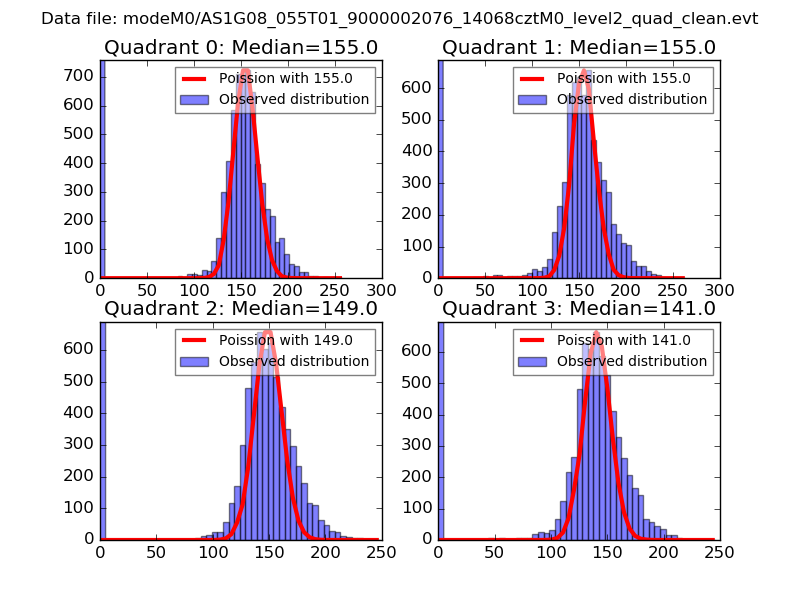 |
 |
| Quadrant-wise count rates Data is divided into 100 sec bins |
 |
|
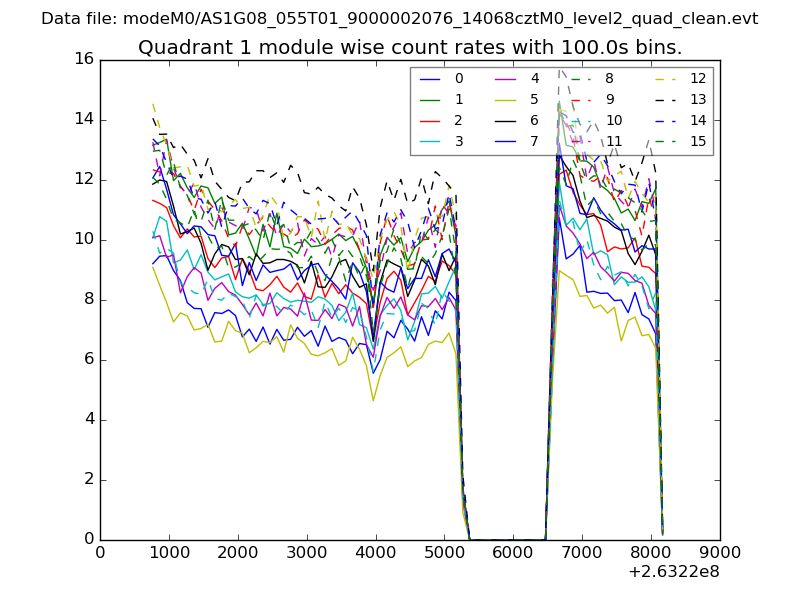
| Module-wise count rates for Quadrant A Data is divided into 100 sec bins |
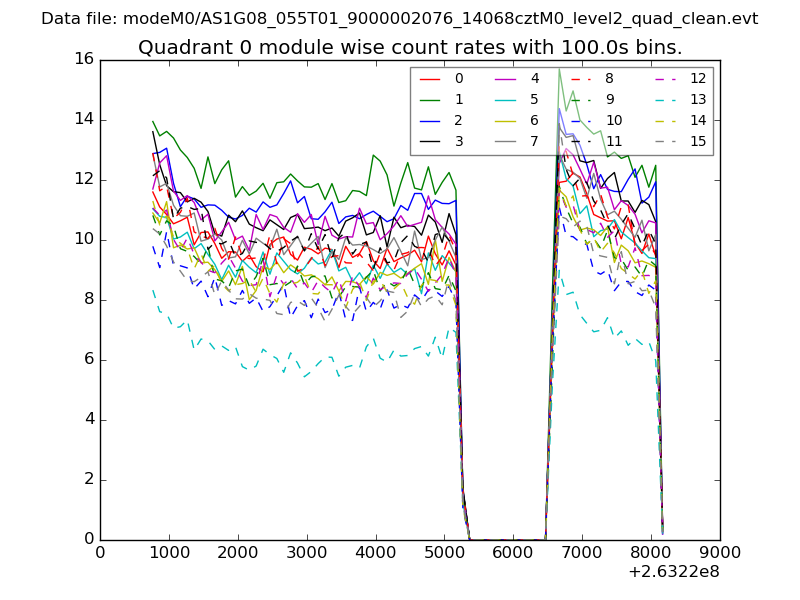 |
 |
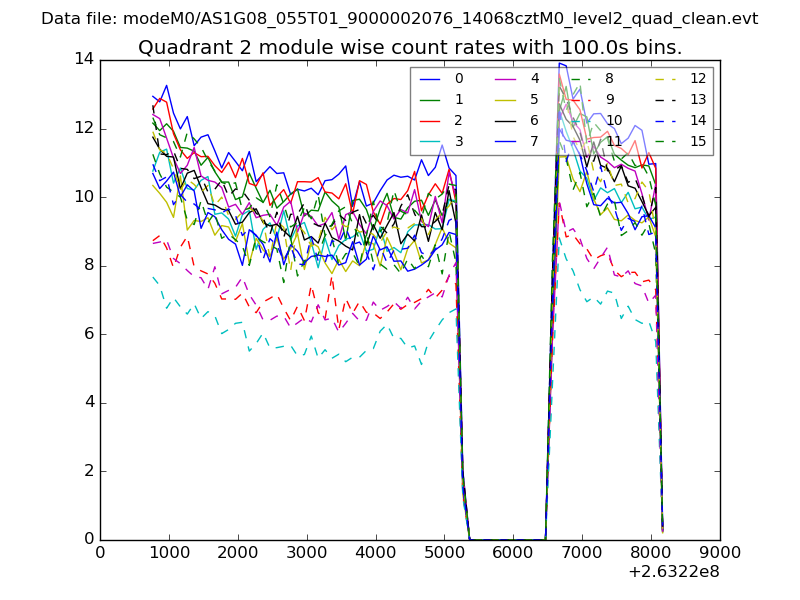
| Module-wise count rates for Quadrant B Data is divided into 100 sec bins |
 |
 |
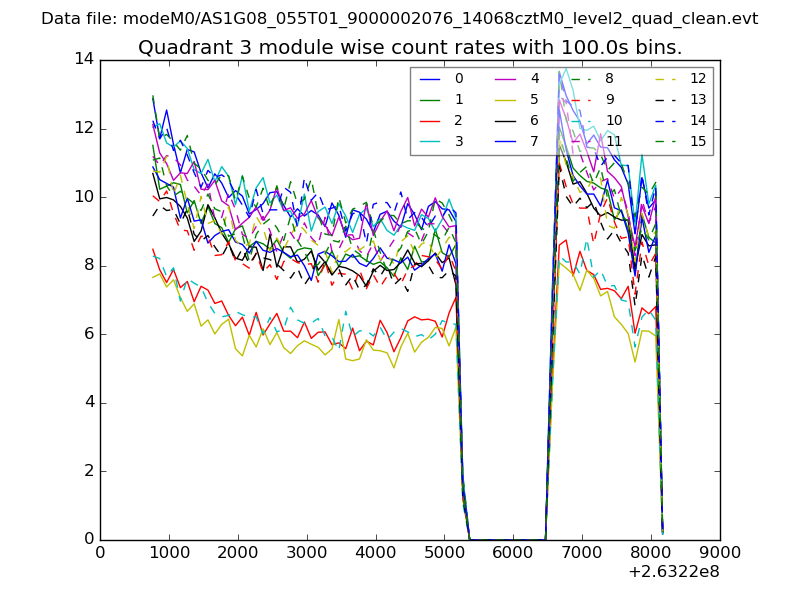
| Module-wise count rates for Quadrant C Data is divided into 100 sec bins |
 |
 |
| Module-wise count rates for Quadrant D Data is divided into 100 sec bins |
 |
 |
| Parameter | Plot |
|---|---|
| CZT HV Monitor | 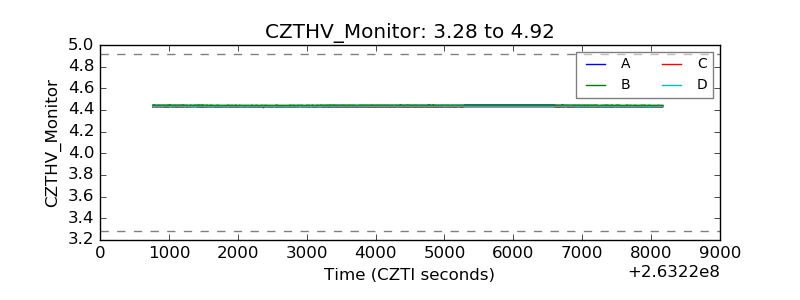 |
| D_VDD | 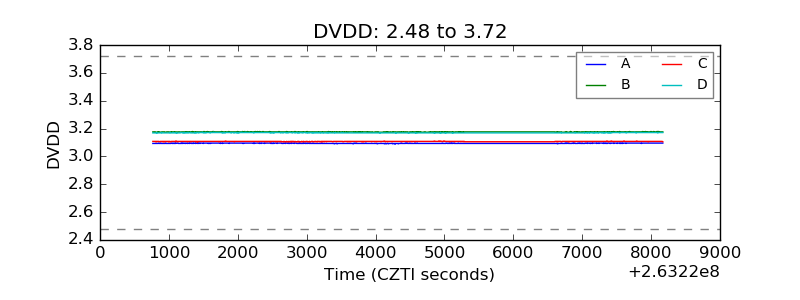 |
| Temperature 1 | 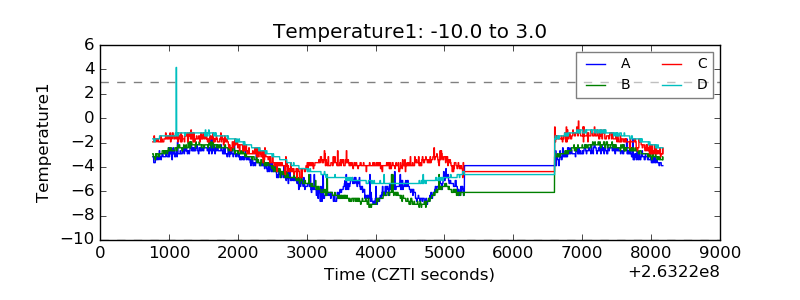 |
| Veto HV Monitor | 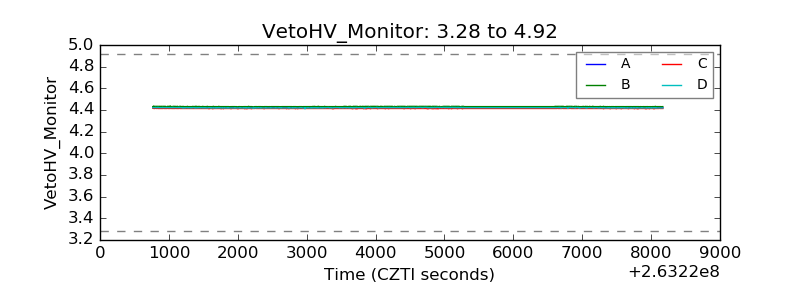 |
| Veto LLD | 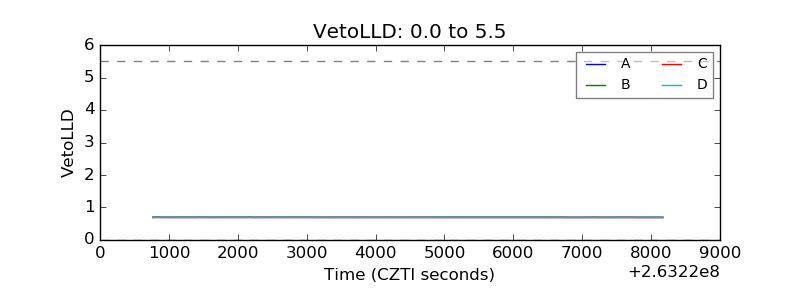 |
| Alpha Counter | 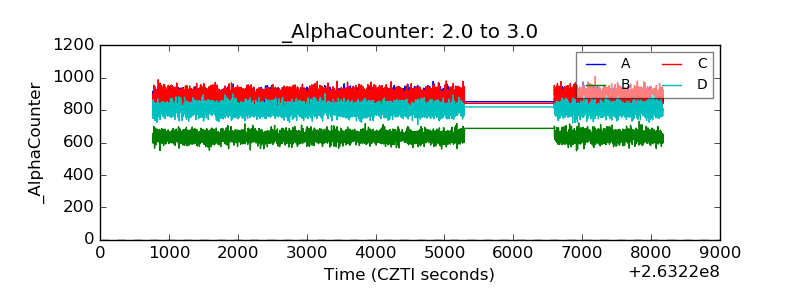 |
| _CPM_Rate | 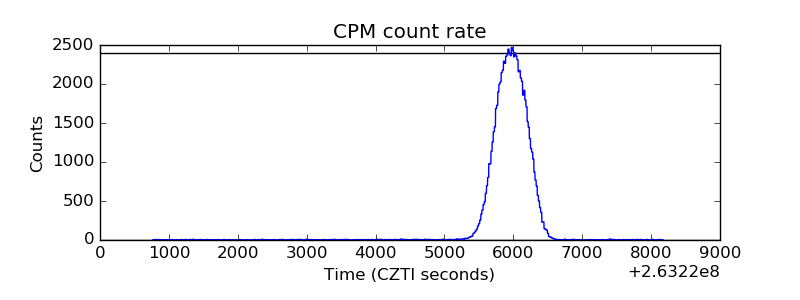 |
| CZT Counter | 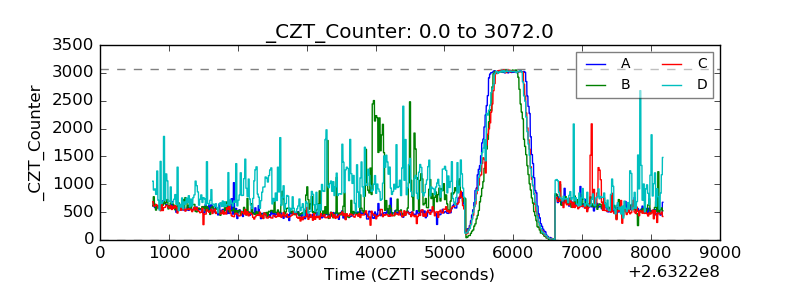 |
| +2.5 Volts monitor |  |
| +5 Volts monitor |  |
| _ROLL_ROT | 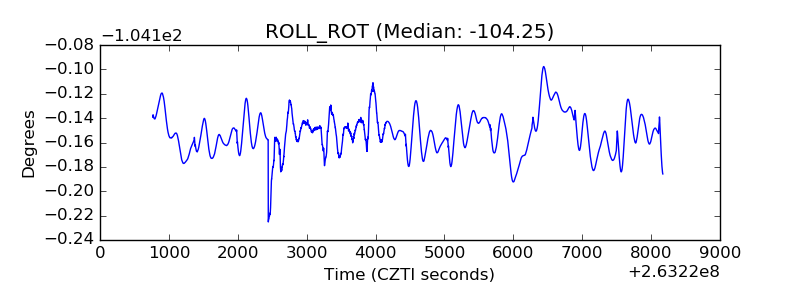 |
| _Roll_DEC | 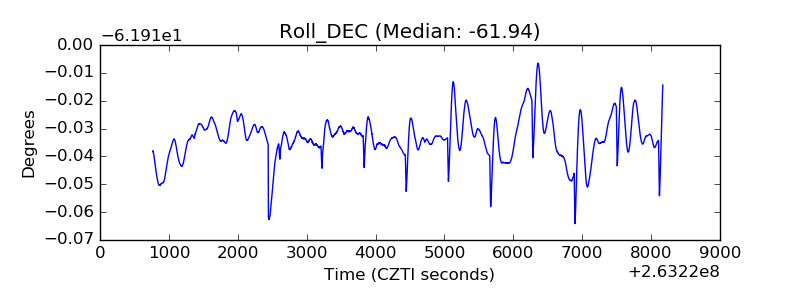 |
| _Roll_RA |  |
| Veto Counter | 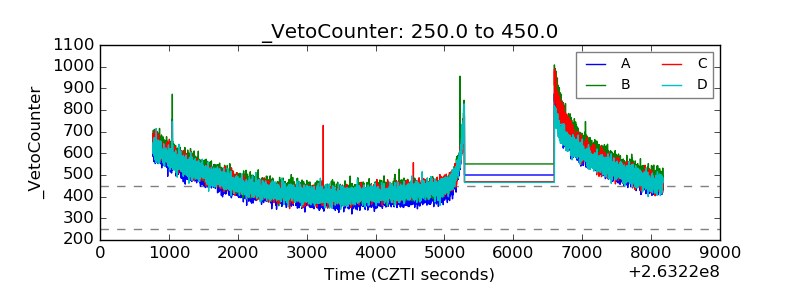 |