| Param | Original file | Final file |
|---|---|---|
| Filename | modeM0/AS1G08_055T01_9000002076_14069cztM0_level2.evt | modeM0/AS1G08_055T01_9000002076_14069cztM0_level2_quad_clean.evt |
| Size (bytes) | 485,360,640 | 130,916,160 |
| Size | 462.9 MB | 124.9 MB |
| Events in quadrant A | 3,111,283 | 917,487 |
| Events in quadrant B | 3,406,020 | 925,474 |
| Events in quadrant C | 3,052,373 | 878,891 |
| Events in quadrant D | 4,723,720 | 825,607 |
| Mode M9 | |||
|---|---|---|---|
| Quadrant | BADHDUFLAG | Total packets | Discarded packets |
| A | 0 | 14 | 0 |
| B | 0 | 14 | 0 |
| C | 0 | 14 | 0 |
| D | 0 | 14 | 0 |
| Mode SS | |||
|---|---|---|---|
| Quadrant | BADHDUFLAG | Total packets | Discarded packets |
| A | 0 | 122 | 0 |
| B | 0 | 122 | 0 |
| C | 0 | 122 | 0 |
| D | 0 | 122 | 0 |
| Mode M0 | |||
|---|---|---|---|
| Quadrant | BADHDUFLAG | Total packets | Discarded packets |
| A | 0 | 13044 | 2 |
| B | 0 | 13886 | 1 |
| C | 0 | 12911 | 1 |
| D | 0 | 18140 | 1 |
| Quadrant | Total seconds | Saturated seconds | Saturation percentage |
|---|---|---|---|
| A | 5981 | 57 | 0.953018% |
| B | 5981 | 100 | 1.671961% |
| C | 5981 | 49 | 0.819261% |
| D | 5981 | 261 | 4.363819% |
Noise dominated data is calculated using 1-second bins in cleaned event files. If a bin has >2000 counts, and if more than 50% of those come from <1% of pixels, then it is considered to be noise-dominated and hence unusable.
| Quadrant | # 1 sec bins | Bins with >0 counts | Bins with >2000 counts | High rate bins dominated by noise | Noise dominated (total time) | Noise dominated (detector-on time) | Marked lightcurve |
|---|---|---|---|---|---|---|---|
| A | 7342 | 5983 | 0 | 0 | 0.00% | 0.00% | 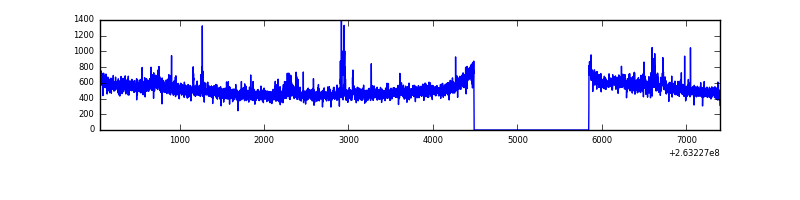 |
| B | 7342 | 5983 | 26 | 26 | 0.35% | 0.43% | 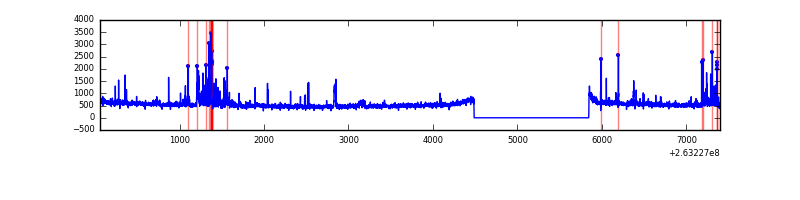 |
| C | 7342 | 5983 | 8 | 8 | 0.11% | 0.13% | 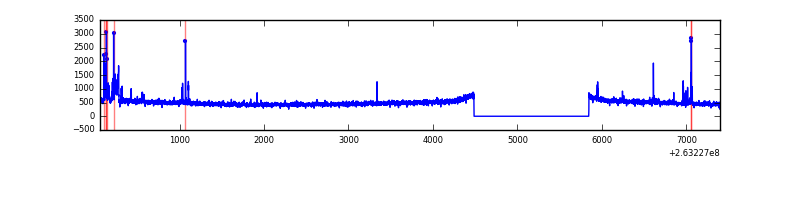 |
| D | 7342 | 5983 | 212 | 212 | 2.89% | 3.54% | 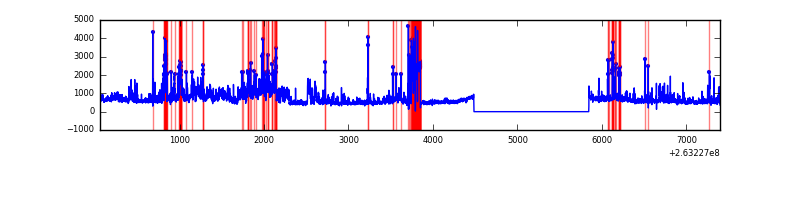 |
Top three noisy pixels from each quadrant. If the there are fewer than three noisy pixels in the level2.evt file, extra rows are filled as -1
| Pixel properties | Quadrant properties | ||||||
|---|---|---|---|---|---|---|---|
| Quadrant | DetID | PixID | Counts | Sigma | Mean | Median | Sigma |
| A | 12 | 189 | 102990 | 664.57 | 775 | 764 | 153.8 |
| A | 8 | 15 | 18788 | 117.17 | 775 | 764 | 153.8 |
| A | 0 | 226 | 7051 | 40.87 | 775 | 764 | 153.8 |
| B | 4 | 48 | 188748 | 1331.03 | 771 | 757 | 141.2 |
| B | 3 | 209 | 57814 | 403.98 | 771 | 757 | 141.2 |
| B | 0 | 219 | 46588 | 324.5 | 771 | 757 | 141.2 |
| C | 0 | 207 | 147753 | 891.2 | 732 | 736 | 165.0 |
| C | 3 | 233 | 49373 | 294.83 | 732 | 736 | 165.0 |
| C | 13 | 61 | 5428 | 28.44 | 732 | 736 | 165.0 |
| D | 1 | 52 | 656846 | 3898.86 | 713 | 697 | 168.3 |
| D | 10 | 172 | 426963 | 2532.89 | 713 | 697 | 168.3 |
| D | 13 | 104 | 291261 | 1726.54 | 713 | 697 | 168.3 |
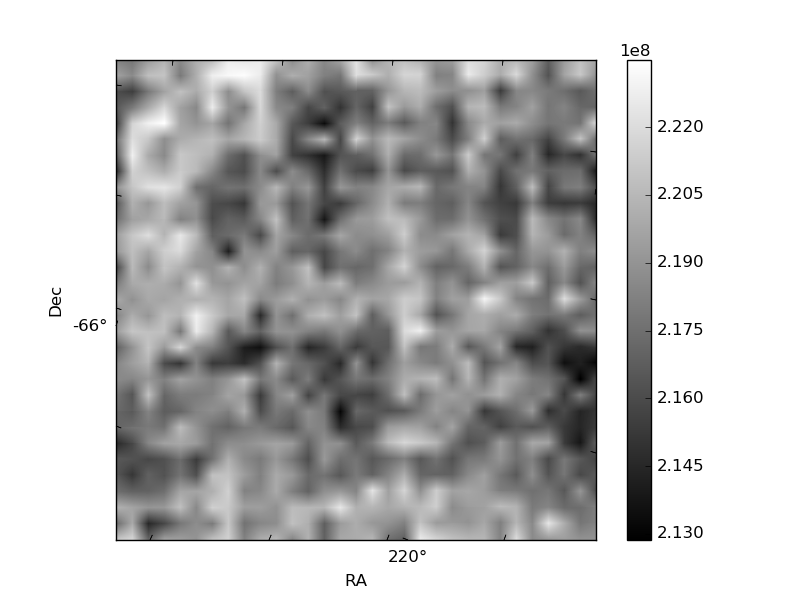
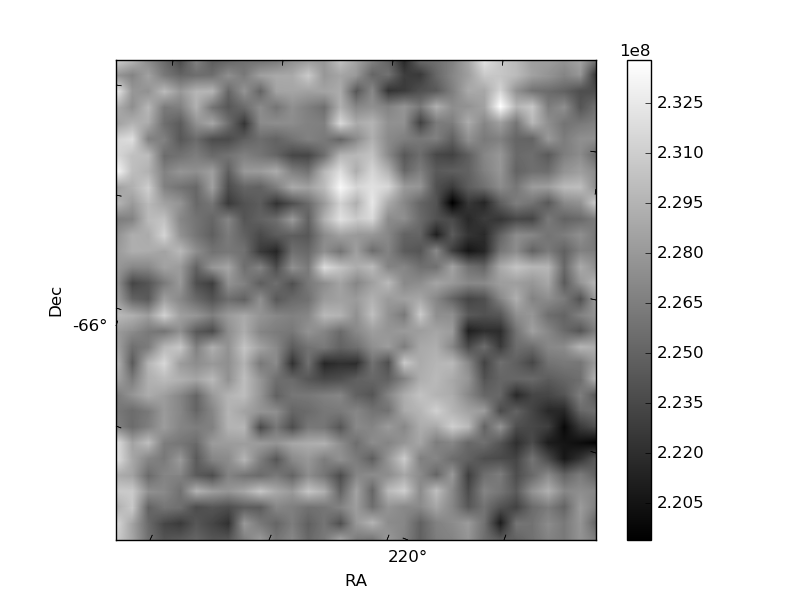
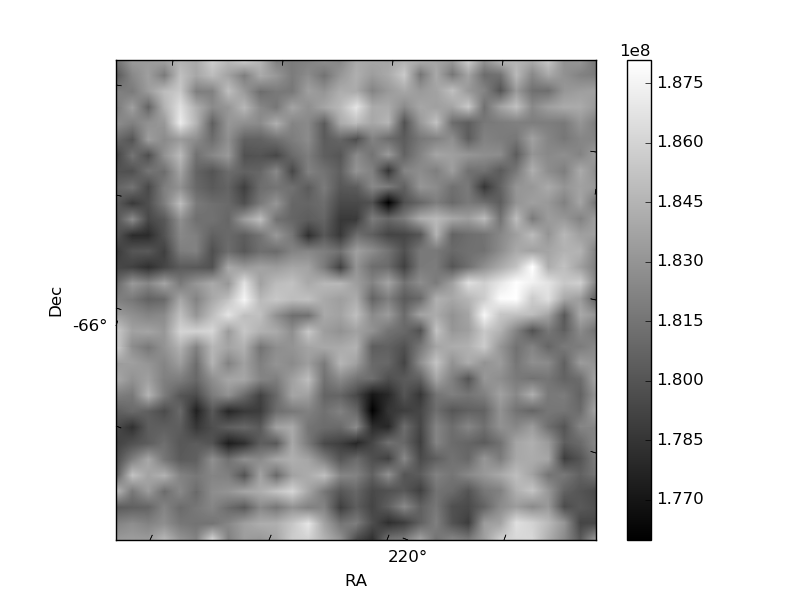
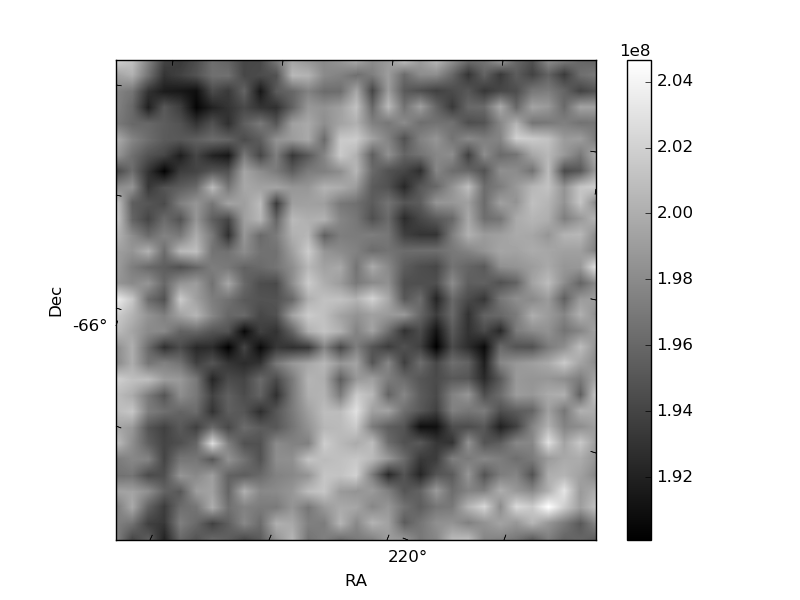
Histogram calculated using DETX and DETY for each event in the final _common_clean file
| Quadrant A | 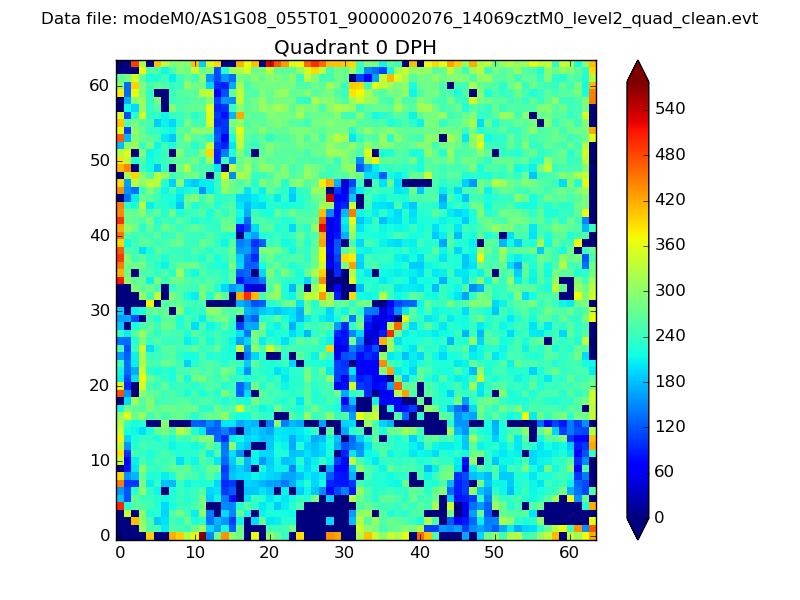 |
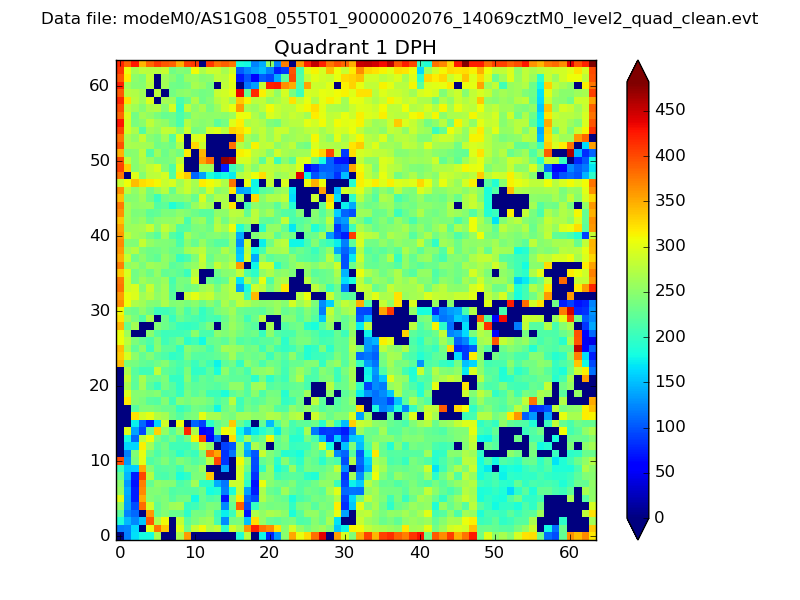 |
Quadrant B |
|---|---|---|---|
| Quadrant D | 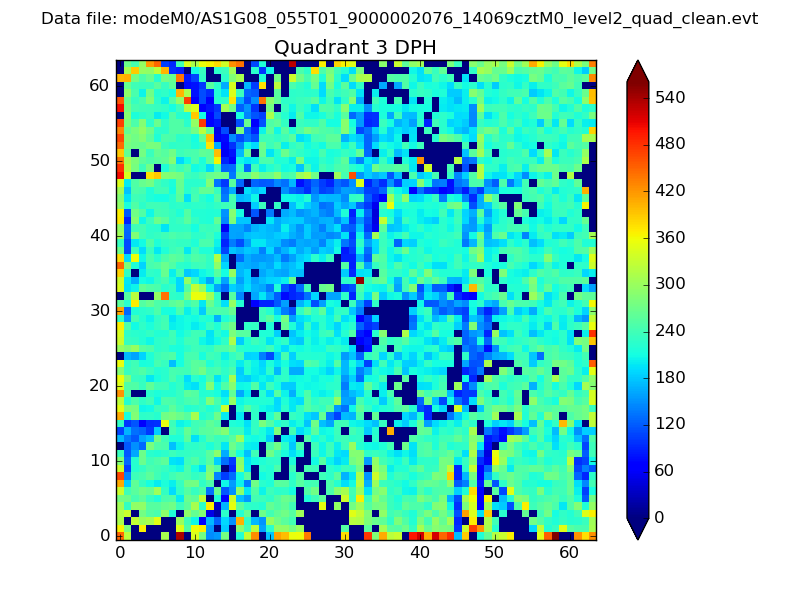 |
 |
Quadrant C |
| Plot type | Count rate plots | Images |
|---|---|---|
| Comparison with Poisson distribution Blue bars denote a histogram of data divided into 1 sec bins. Red curve is a Poisson curve with rate = median count rate of data. |
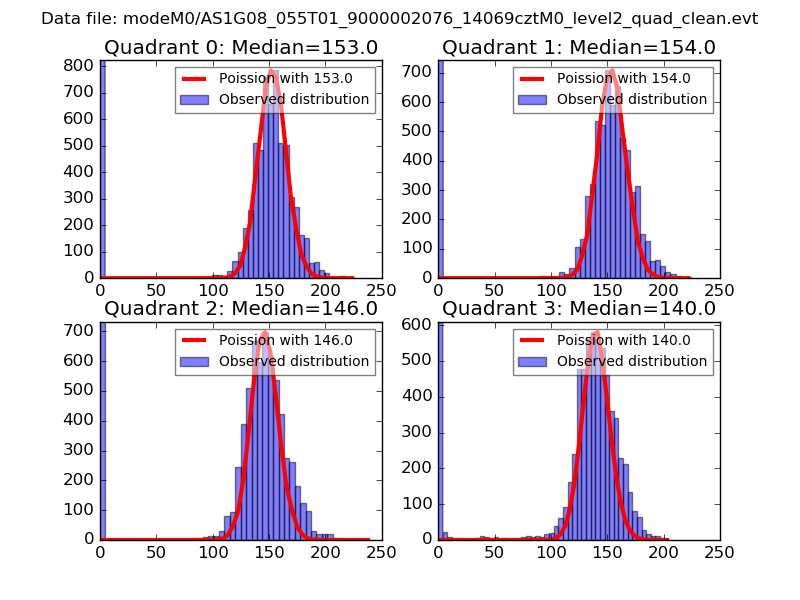 |
 |
| Quadrant-wise count rates Data is divided into 100 sec bins |
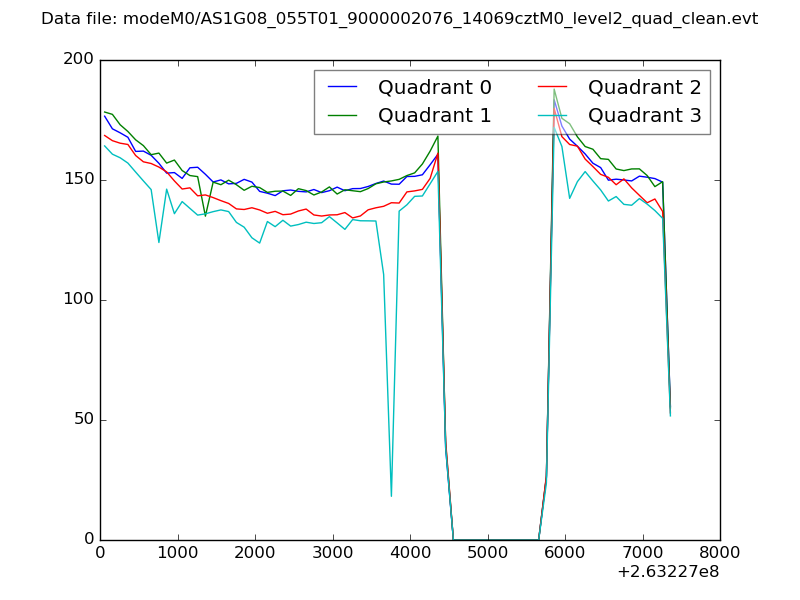 |
|
| Module-wise count rates for Quadrant A Data is divided into 100 sec bins |
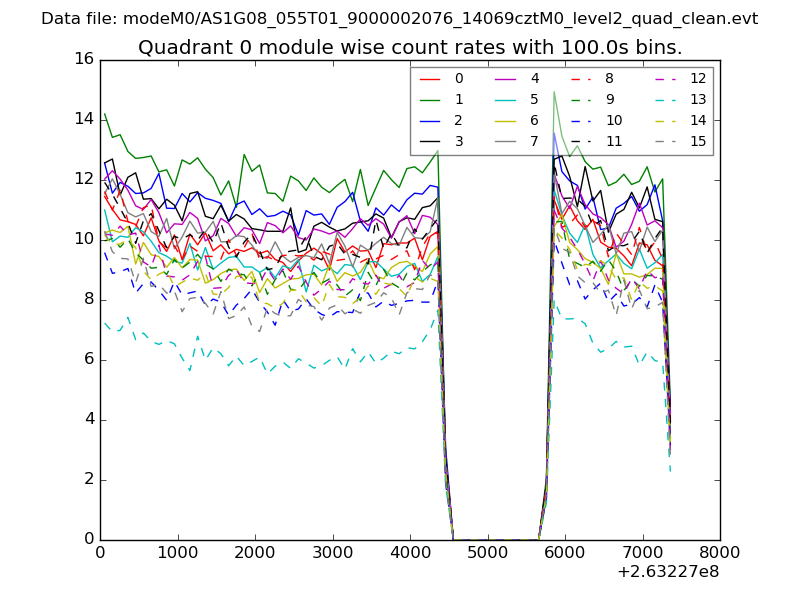 |
 |
| Module-wise count rates for Quadrant B Data is divided into 100 sec bins |
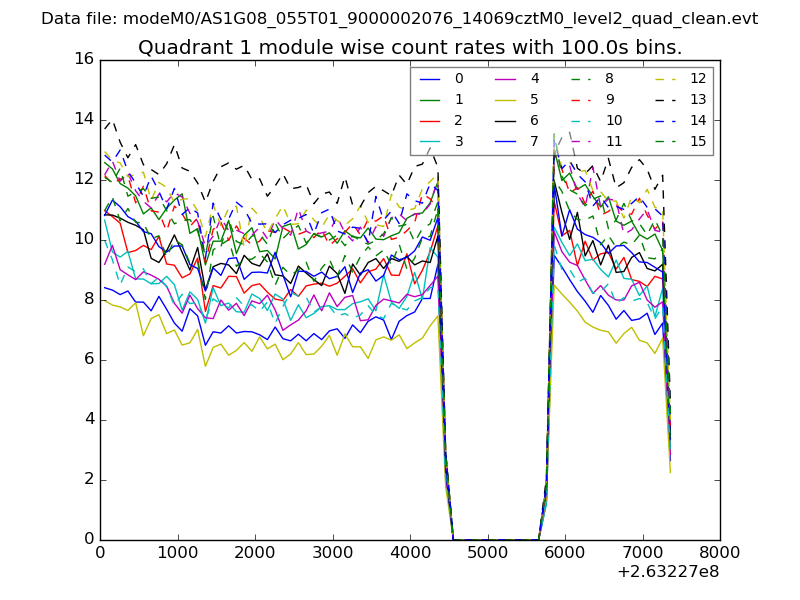 |
 |
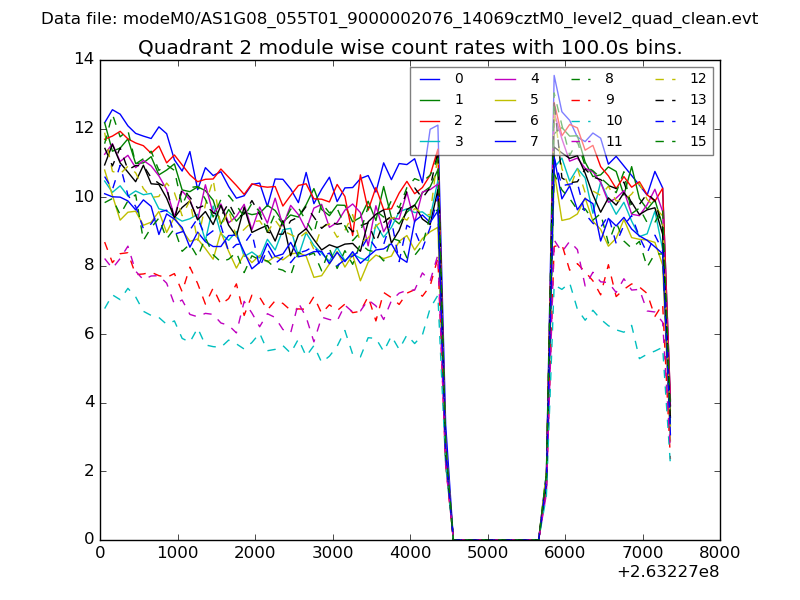
| Module-wise count rates for Quadrant C Data is divided into 100 sec bins |
 |
 |
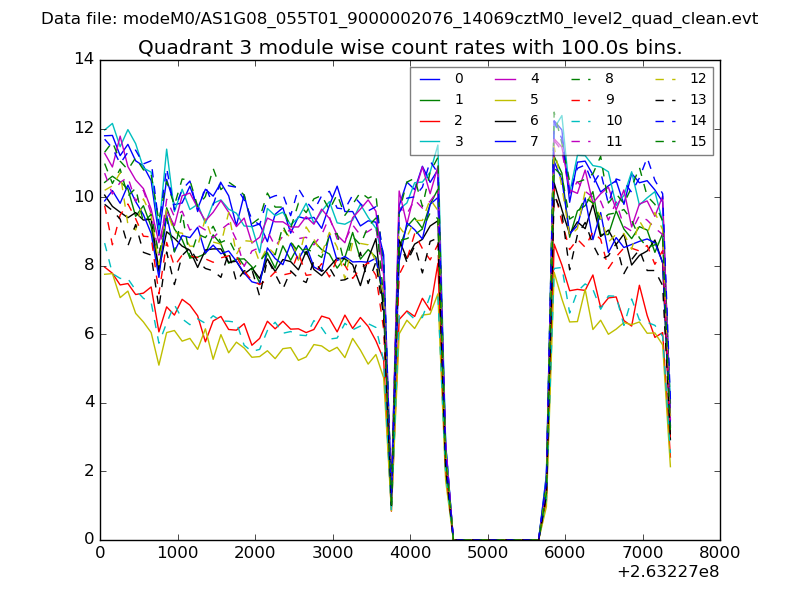
| Module-wise count rates for Quadrant D Data is divided into 100 sec bins |
 |
 |
| Parameter | Plot |
|---|---|
| CZT HV Monitor | 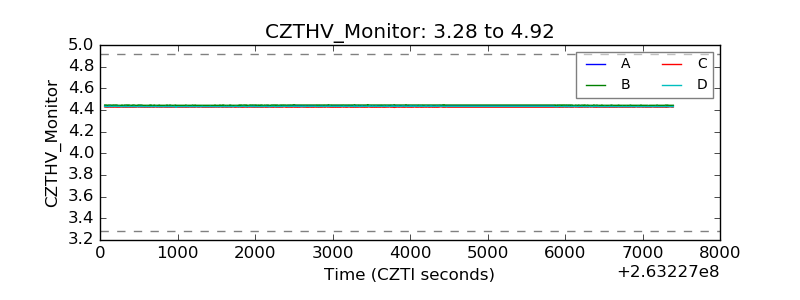 |
| D_VDD | 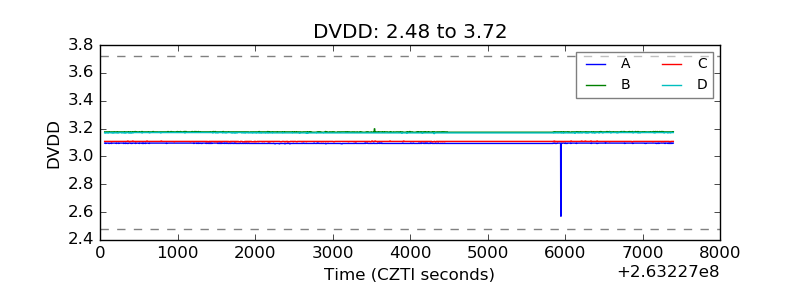 |
| Temperature 1 | 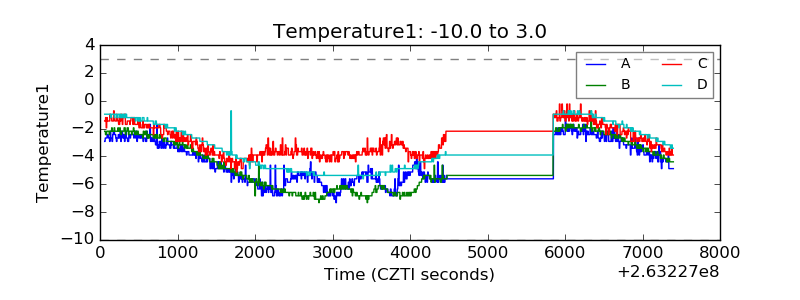 |
| Veto HV Monitor | 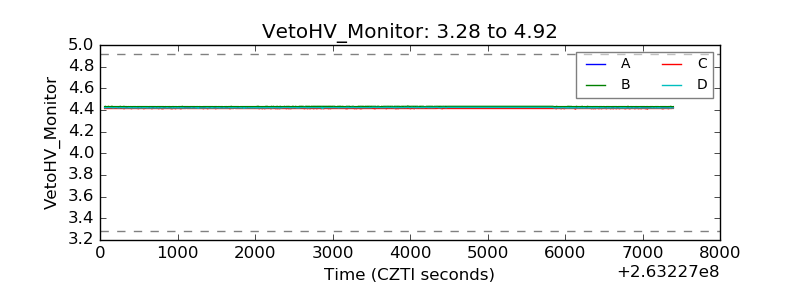 |
| Veto LLD | 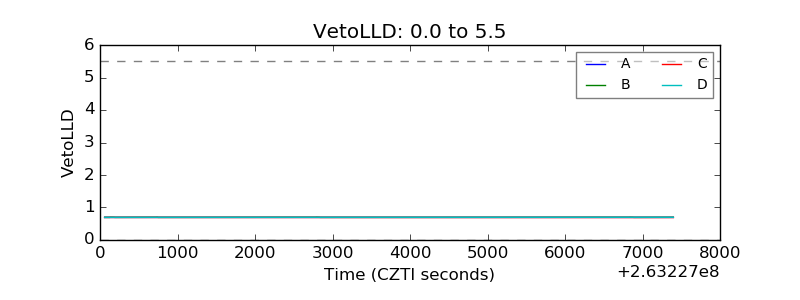 |
| Alpha Counter | 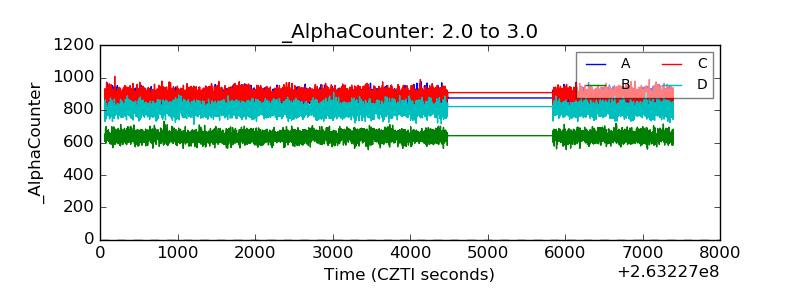 |
| _CPM_Rate | 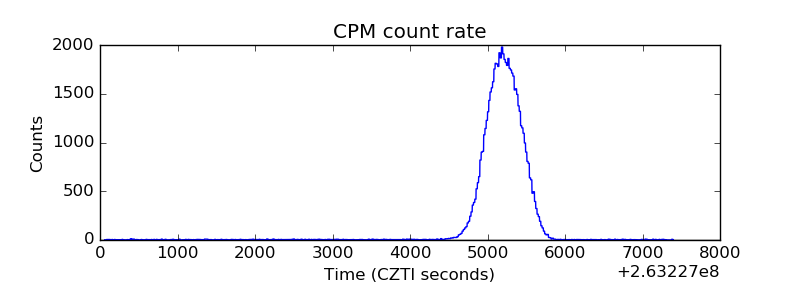 |
| CZT Counter | 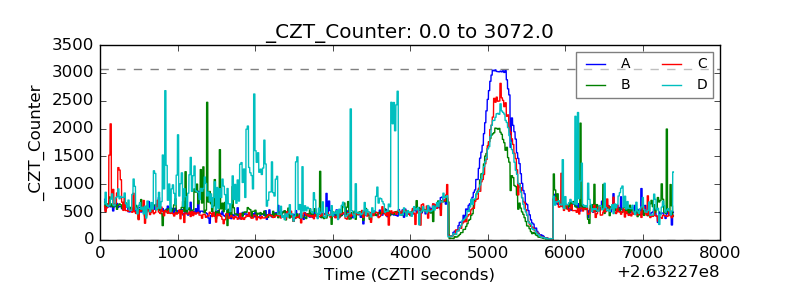 |
| +2.5 Volts monitor |  |
| +5 Volts monitor | 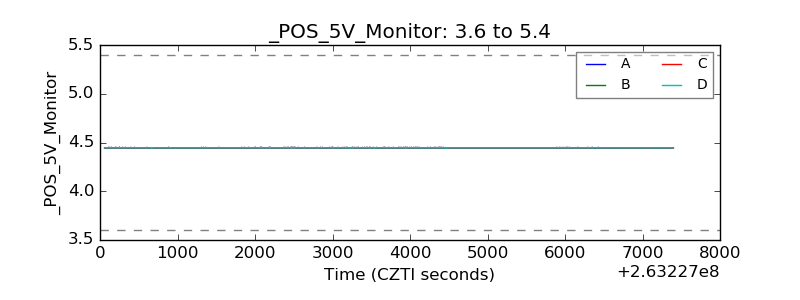 |
| _ROLL_ROT | 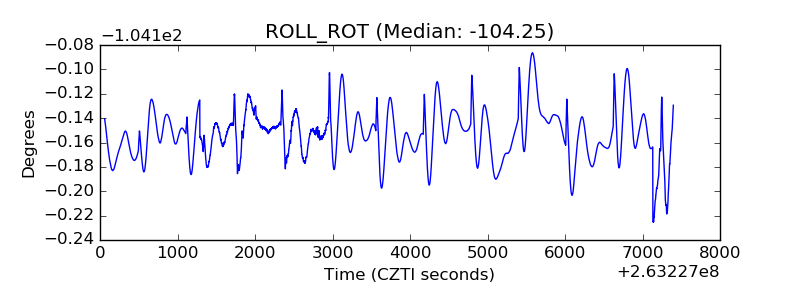 |
| _Roll_DEC | 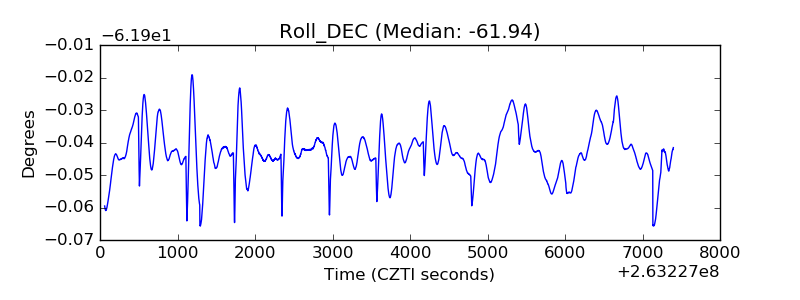 |
| _Roll_RA |  |
| Veto Counter | 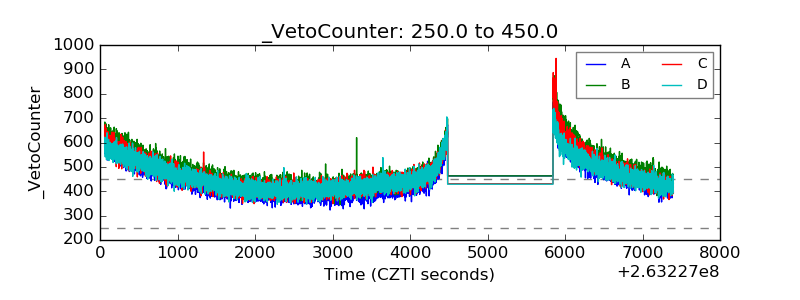 |