| Param | Original file | Final file |
|---|---|---|
| Filename | modeM0/AS1G08_055T01_9000002076_14070cztM0_level2.evt | modeM0/AS1G08_055T01_9000002076_14070cztM0_level2_quad_clean.evt |
| Size (bytes) | 494,524,800 | 126,299,520 |
| Size | 471.6 MB | 120.4 MB |
| Events in quadrant A | 3,270,346 | 871,553 |
| Events in quadrant B | 3,719,544 | 882,390 |
| Events in quadrant C | 3,108,384 | 836,151 |
| Events in quadrant D | 4,442,539 | 787,322 |
| Mode M9 | |||
|---|---|---|---|
| Quadrant | BADHDUFLAG | Total packets | Discarded packets |
| A | 0 | 13 | 0 |
| B | 0 | 13 | 0 |
| C | 0 | 13 | 0 |
| D | 0 | 14 | 0 |
| Mode SS | |||
|---|---|---|---|
| Quadrant | BADHDUFLAG | Total packets | Discarded packets |
| A | 0 | 130 | 0 |
| B | 0 | 130 | 0 |
| C | 0 | 130 | 0 |
| D | 0 | 130 | 0 |
| Mode M0 | |||
|---|---|---|---|
| Quadrant | BADHDUFLAG | Total packets | Discarded packets |
| A | 0 | 13906 | 3 |
| B | 0 | 15158 | 2 |
| C | 0 | 13508 | 2 |
| D | 0 | 17520 | 2 |
| Quadrant | Total seconds | Saturated seconds | Saturation percentage |
|---|---|---|---|
| A | 6423 | 85 | 1.323369% |
| B | 6423 | 137 | 2.132960% |
| C | 6423 | 35 | 0.544917% |
| D | 6423 | 342 | 5.324615% |
Noise dominated data is calculated using 1-second bins in cleaned event files. If a bin has >2000 counts, and if more than 50% of those come from <1% of pixels, then it is considered to be noise-dominated and hence unusable.
| Quadrant | # 1 sec bins | Bins with >0 counts | Bins with >2000 counts | High rate bins dominated by noise | Noise dominated (total time) | Noise dominated (detector-on time) | Marked lightcurve |
|---|---|---|---|---|---|---|---|
| A | 7679 | 6425 | 0 | 0 | 0.00% | 0.00% | 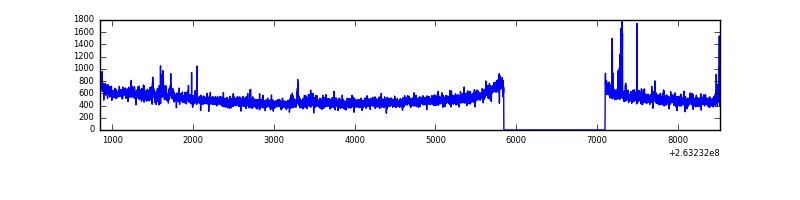 |
| B | 7679 | 6425 | 37 | 37 | 0.48% | 0.58% | 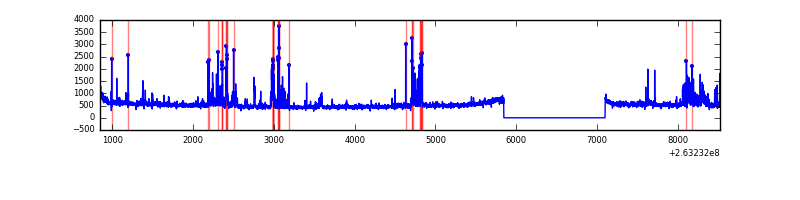 |
| C | 7679 | 6425 | 2 | 2 | 0.03% | 0.03% | 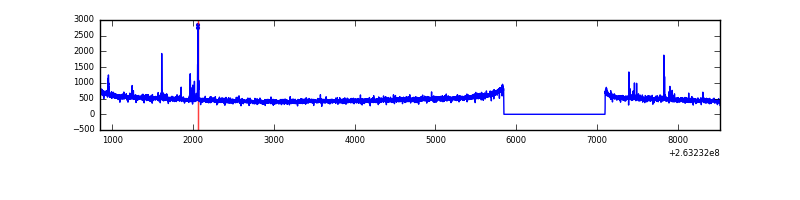 |
| D | 7679 | 6425 | 242 | 242 | 3.15% | 3.77% | 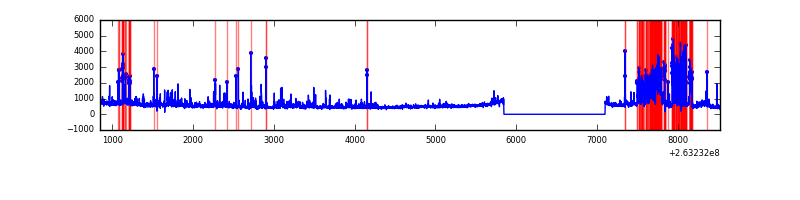 |
Top three noisy pixels from each quadrant. If the there are fewer than three noisy pixels in the level2.evt file, extra rows are filled as -1
| Pixel properties | Quadrant properties | ||||||
|---|---|---|---|---|---|---|---|
| Quadrant | DetID | PixID | Counts | Sigma | Mean | Median | Sigma |
| A | 12 | 189 | 74035 | 452.65 | 814 | 801 | 161.8 |
| A | 15 | 222 | 40145 | 243.18 | 814 | 801 | 161.8 |
| A | 8 | 15 | 19771 | 117.25 | 814 | 801 | 161.8 |
| B | 4 | 48 | 263253 | 1749.99 | 816 | 799 | 150.0 |
| B | 15 | 201 | 90649 | 599.1 | 816 | 799 | 150.0 |
| B | 3 | 209 | 41059 | 268.44 | 816 | 799 | 150.0 |
| C | 3 | 233 | 47136 | 262.81 | 773 | 776 | 176.4 |
| C | 0 | 207 | 46945 | 261.72 | 773 | 776 | 176.4 |
| C | 13 | 61 | 5573 | 27.19 | 773 | 776 | 176.4 |
| D | 10 | 172 | 815594 | 4553.64 | 755 | 738 | 178.9 |
| D | 1 | 52 | 293961 | 1638.61 | 755 | 738 | 178.9 |
| D | 8 | 195 | 126398 | 702.22 | 755 | 738 | 178.9 |
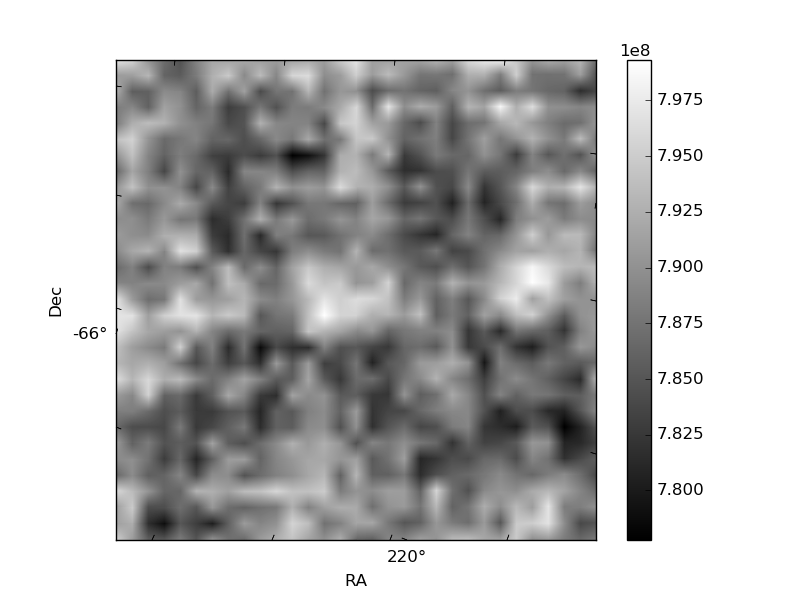
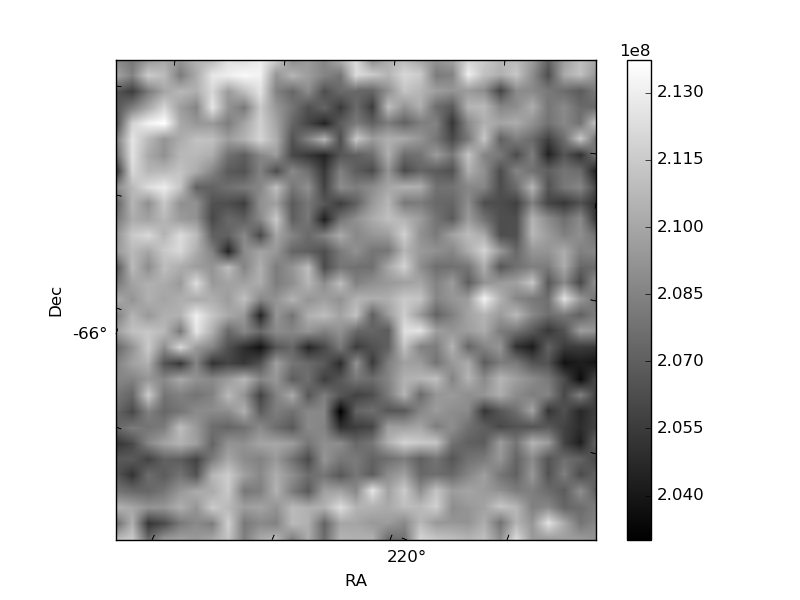
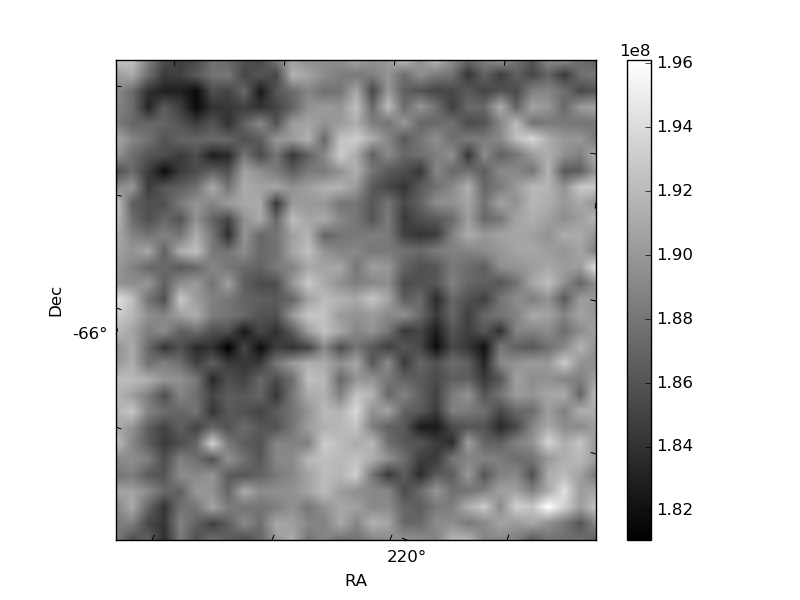
Histogram calculated using DETX and DETY for each event in the final _common_clean file
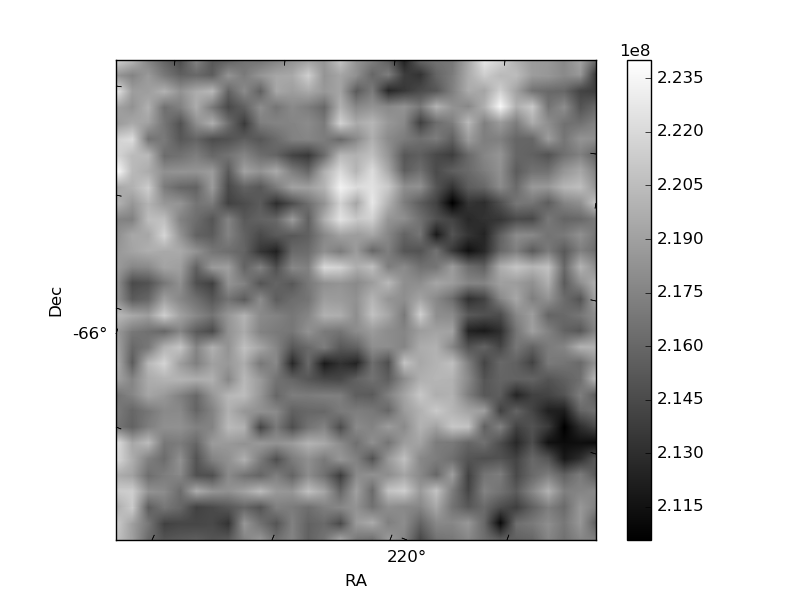
| Quadrant A | 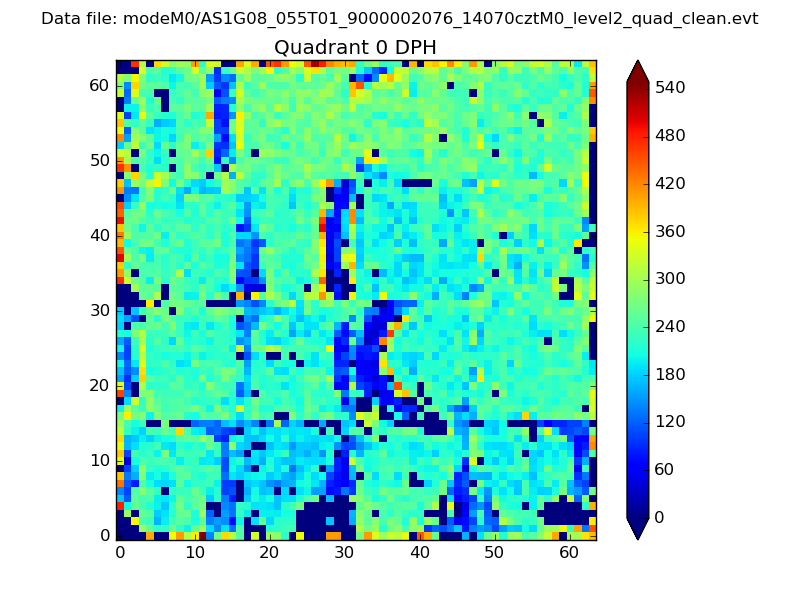 |
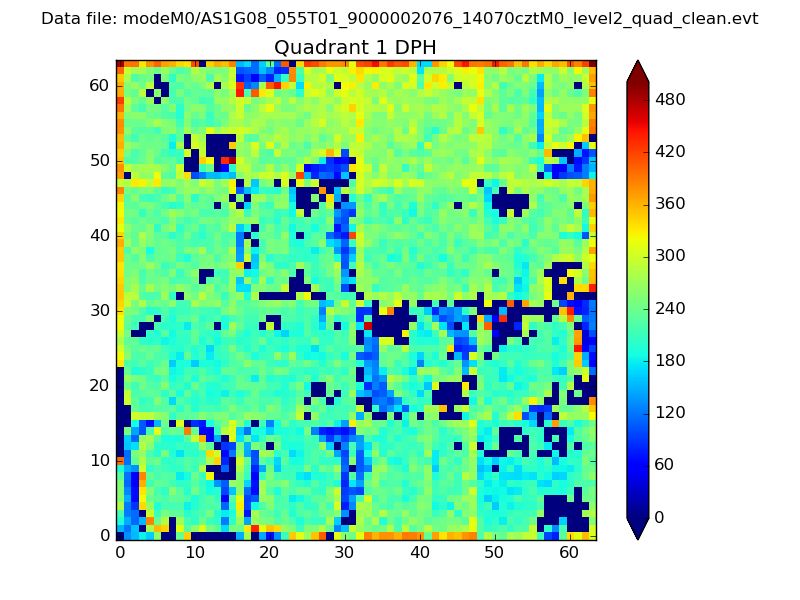 |
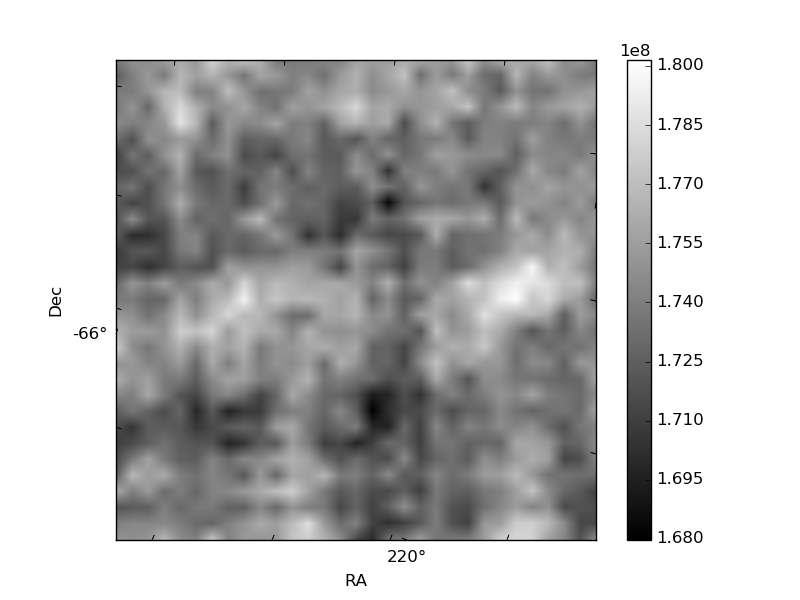
Quadrant B |
|---|---|---|---|
| Quadrant D | 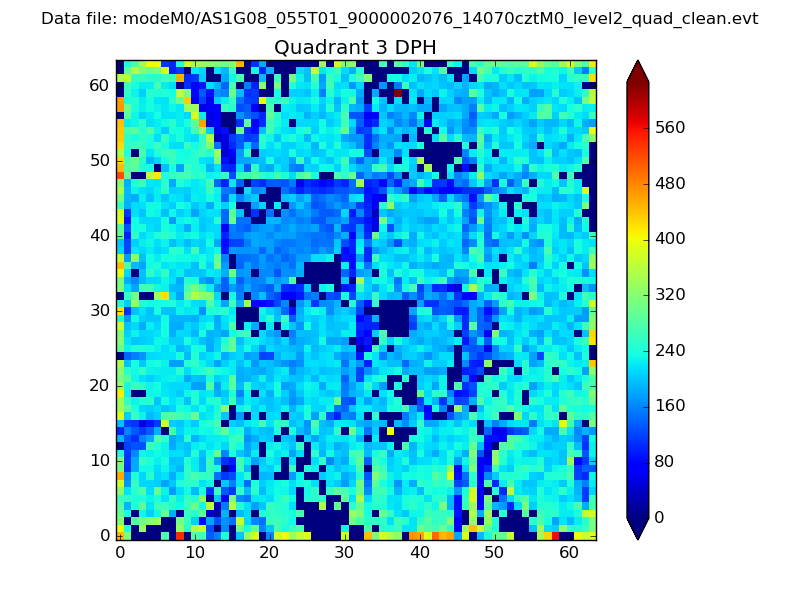 |
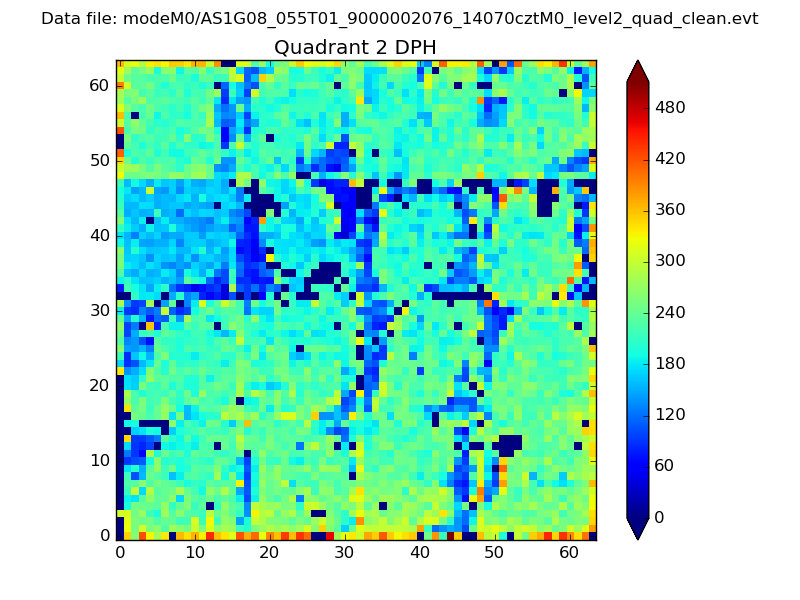 |
Quadrant C |
| Plot type | Count rate plots | Images |
|---|---|---|
| Comparison with Poisson distribution Blue bars denote a histogram of data divided into 1 sec bins. Red curve is a Poisson curve with rate = median count rate of data. |
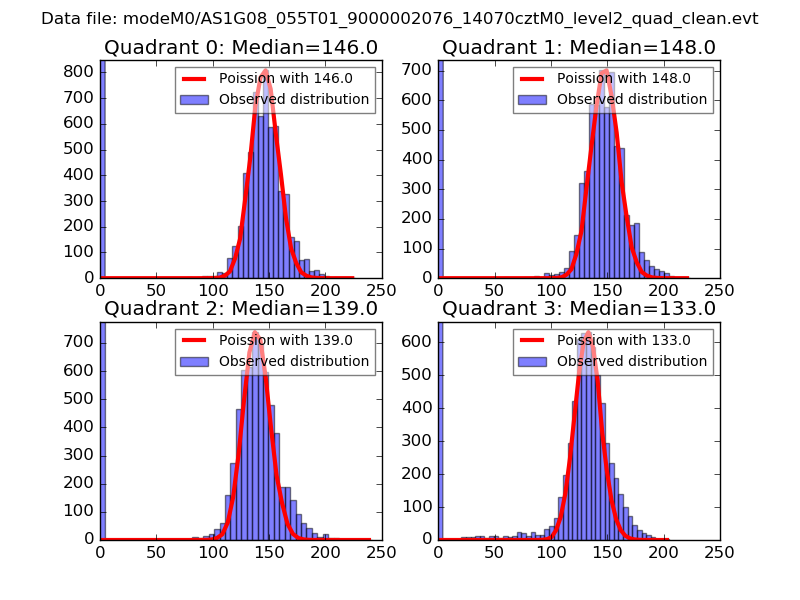 |
 |
| Quadrant-wise count rates Data is divided into 100 sec bins |
 |
|
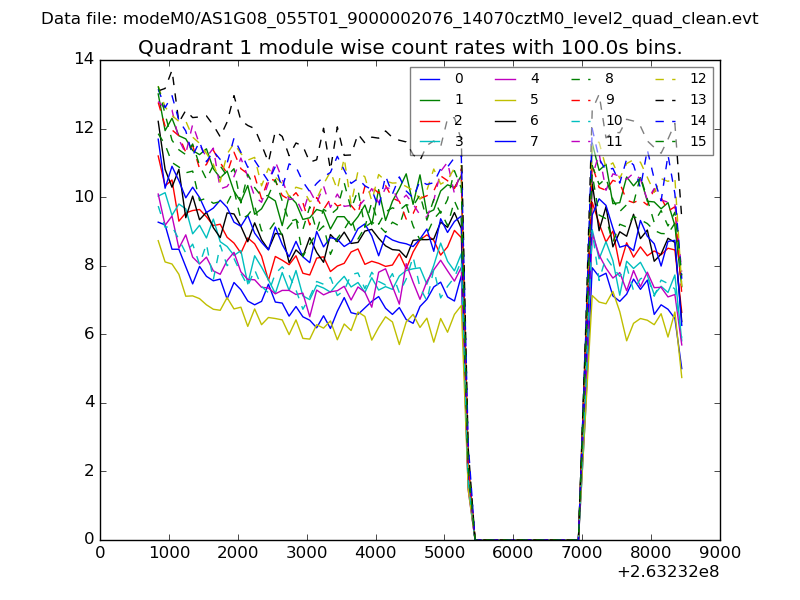
| Module-wise count rates for Quadrant A Data is divided into 100 sec bins |
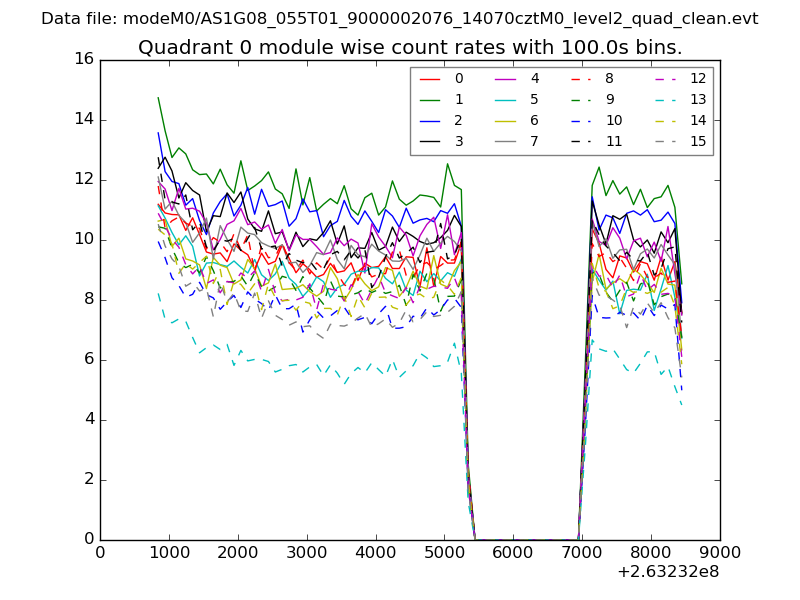 |
 |
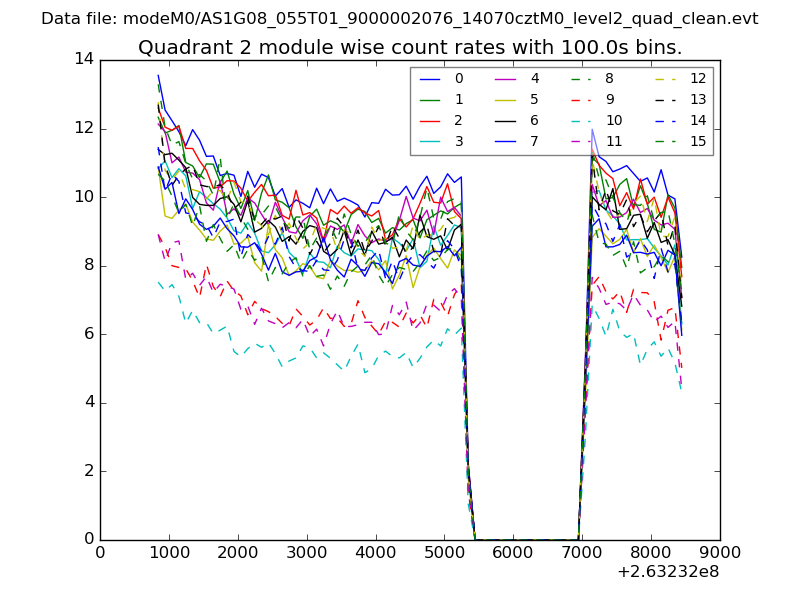
| Module-wise count rates for Quadrant B Data is divided into 100 sec bins |
 |
 |
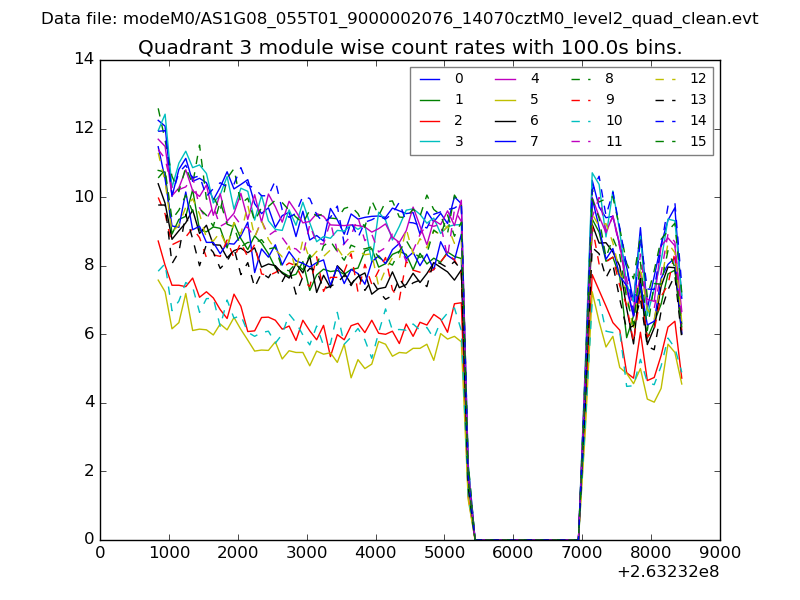
| Module-wise count rates for Quadrant C Data is divided into 100 sec bins |
 |
 |
| Module-wise count rates for Quadrant D Data is divided into 100 sec bins |
 |
 |
| Parameter | Plot |
|---|---|
| CZT HV Monitor | 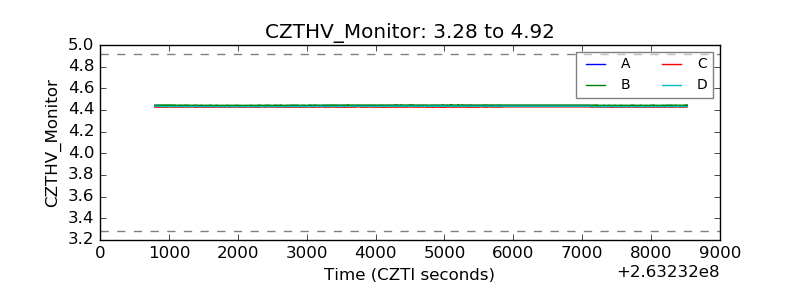 |
| D_VDD | 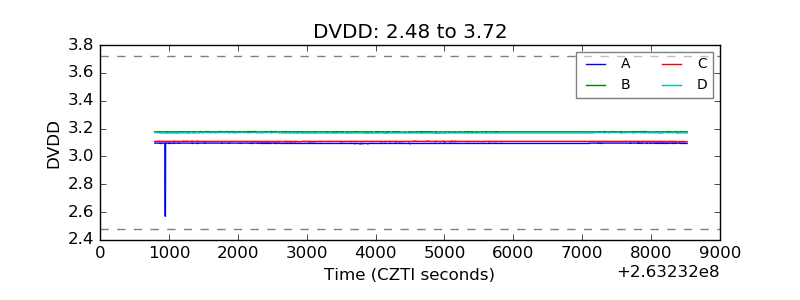 |
| Temperature 1 | 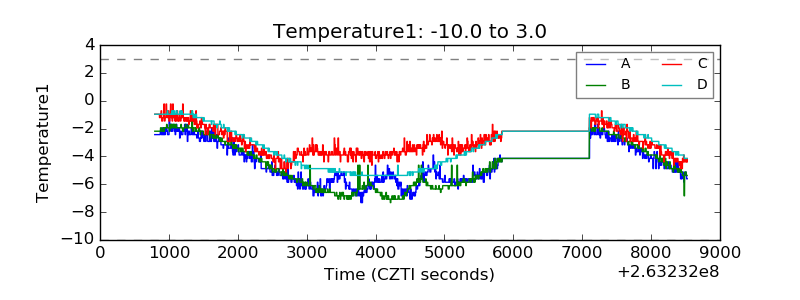 |
| Veto HV Monitor | 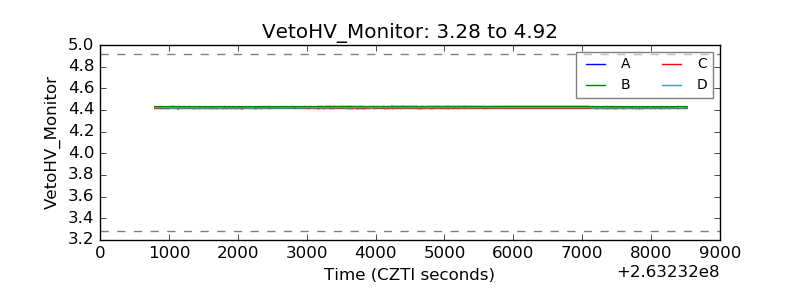 |
| Veto LLD | 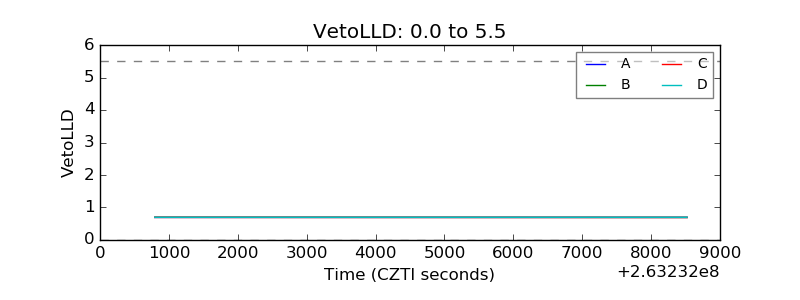 |
| Alpha Counter | 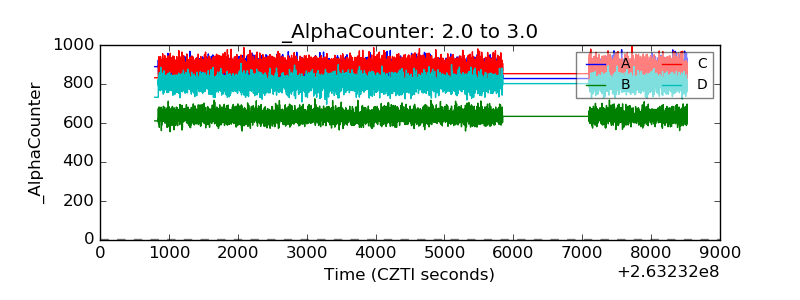 |
| _CPM_Rate | 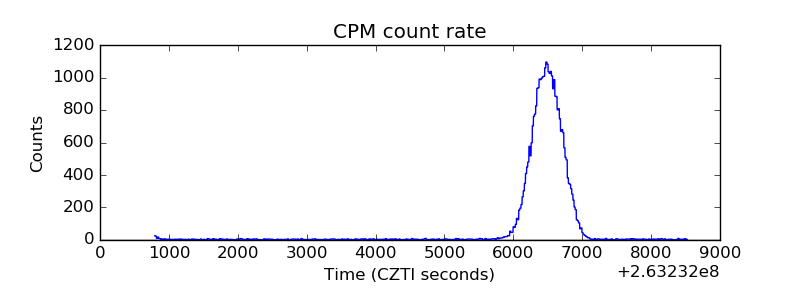 |
| CZT Counter | 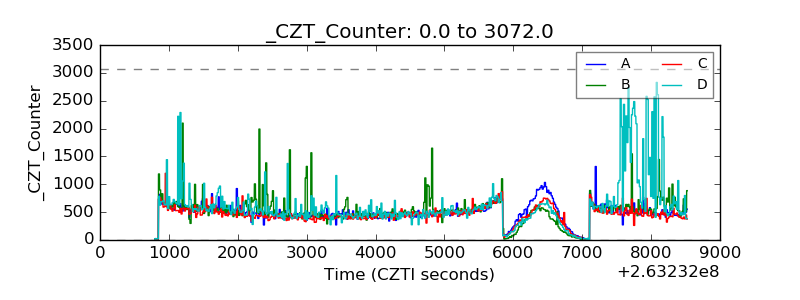 |
| +2.5 Volts monitor |  |
| +5 Volts monitor |  |
| _ROLL_ROT | 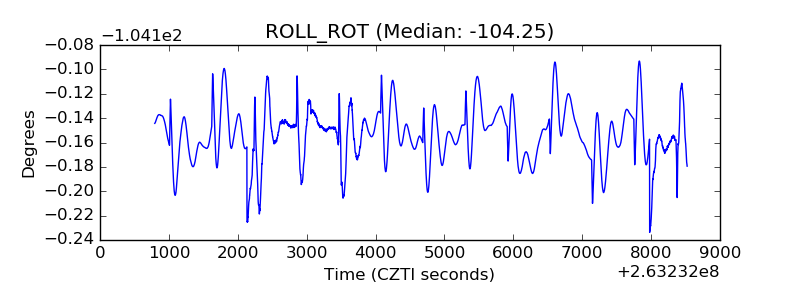 |
| _Roll_DEC | 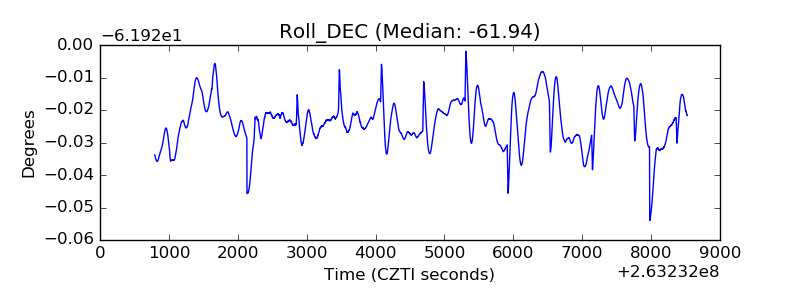 |
| _Roll_RA |  |
| Veto Counter | 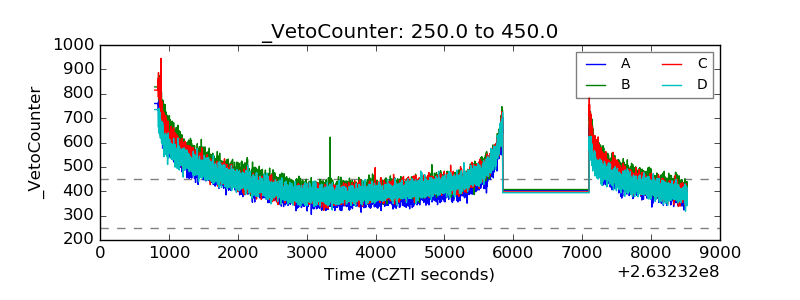 |