| Param | Original file | Final file |
|---|---|---|
| Filename | modeM0/AS1G08_055T01_9000002076_14071cztM0_level2.evt | modeM0/AS1G08_055T01_9000002076_14071cztM0_level2_quad_clean.evt |
| Size (bytes) | 527,604,480 | 108,927,360 |
| Size | 503.2 MB | 103.9 MB |
| Events in quadrant A | 3,868,325 | 718,036 |
| Events in quadrant B | 3,400,305 | 756,458 |
| Events in quadrant C | 2,965,467 | 718,047 |
| Events in quadrant D | 5,313,630 | 662,983 |
| Mode SS | |||
|---|---|---|---|
| Quadrant | BADHDUFLAG | Total packets | Discarded packets |
| A | 0 | 130 | 0 |
| B | 0 | 130 | 0 |
| C | 0 | 130 | 0 |
| D | 0 | 130 | 0 |
| Mode M0 | |||
|---|---|---|---|
| Quadrant | BADHDUFLAG | Total packets | Discarded packets |
| A | 0 | 15883 | 233 |
| B | 0 | 14238 | 1 |
| C | 0 | 13148 | 1 |
| D | 0 | 20246 | 1 |
| Quadrant | Total seconds | Saturated seconds | Saturation percentage |
|---|---|---|---|
| A | 6264 | 266 | 4.246488% |
| B | 6378 | 50 | 0.783945% |
| C | 6378 | 14 | 0.219505% |
| D | 6378 | 465 | 7.290687% |
Noise dominated data is calculated using 1-second bins in cleaned event files. If a bin has >2000 counts, and if more than 50% of those come from <1% of pixels, then it is considered to be noise-dominated and hence unusable.
| Quadrant | # 1 sec bins | Bins with >0 counts | Bins with >2000 counts | High rate bins dominated by noise | Noise dominated (total time) | Noise dominated (detector-on time) | Marked lightcurve |
|---|---|---|---|---|---|---|---|
| A | 7384 | 6269 | 194 | 194 | 2.63% | 3.09% | 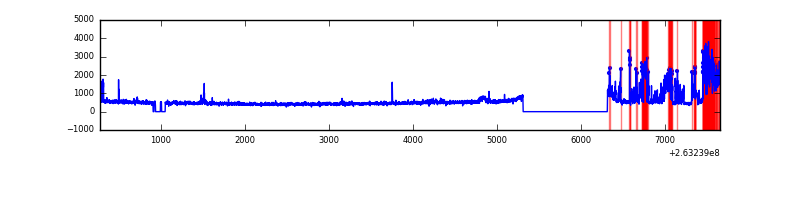 |
| B | 7384 | 6380 | 5 | 5 | 0.07% | 0.08% | 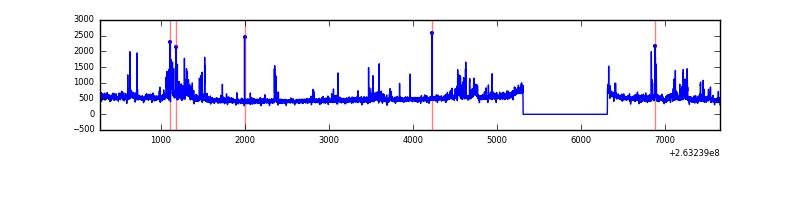 |
| C | 7384 | 6380 | 4 | 4 | 0.05% | 0.06% | 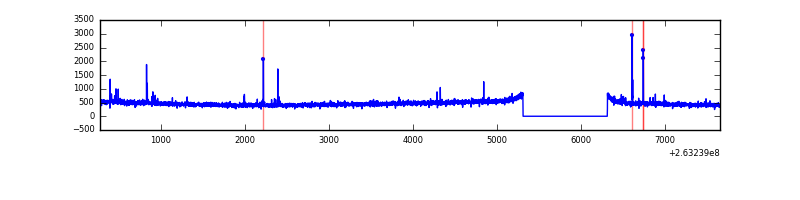 |
| D | 7384 | 6380 | 352 | 352 | 4.77% | 5.52% | 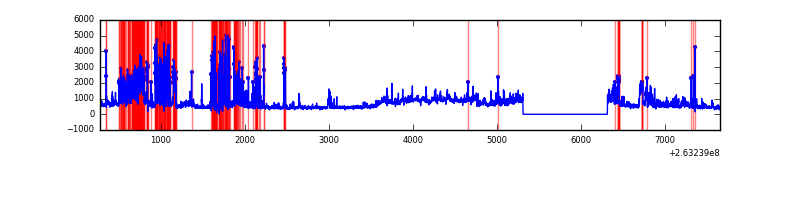 |
Top three noisy pixels from each quadrant. If the there are fewer than three noisy pixels in the level2.evt file, extra rows are filled as -1
| Pixel properties | Quadrant properties | ||||||
|---|---|---|---|---|---|---|---|
| Quadrant | DetID | PixID | Counts | Sigma | Mean | Median | Sigma |
| A | 15 | 222 | 919047 | 6123.03 | 747 | 733 | 150.0 |
| A | 12 | 189 | 57698 | 379.82 | 747 | 733 | 150.0 |
| A | 8 | 15 | 11508 | 71.84 | 747 | 733 | 150.0 |
| B | 4 | 48 | 116494 | 805.85 | 773 | 757 | 143.6 |
| B | 0 | 85 | 93449 | 645.39 | 773 | 757 | 143.6 |
| B | 3 | 209 | 45841 | 313.91 | 773 | 757 | 143.6 |
| C | 3 | 233 | 48487 | 282.58 | 737 | 740 | 169.0 |
| C | 0 | 207 | 23039 | 131.97 | 737 | 740 | 169.0 |
| C | 12 | 4 | 15347 | 86.45 | 737 | 740 | 169.0 |
| D | 10 | 172 | 1341191 | 7465.24 | 706 | 689 | 179.6 |
| D | 15 | 0 | 478897 | 2663.13 | 706 | 689 | 179.6 |
| D | 1 | 52 | 300060 | 1667.19 | 706 | 689 | 179.6 |
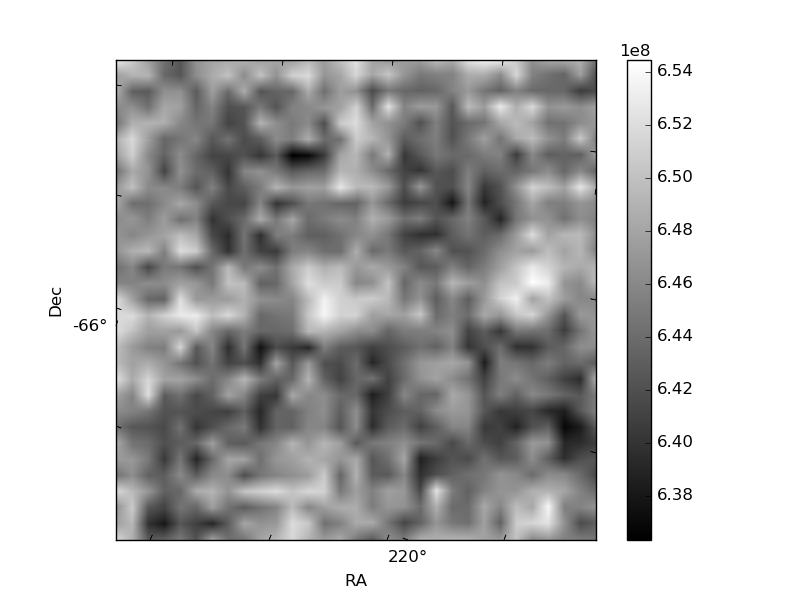
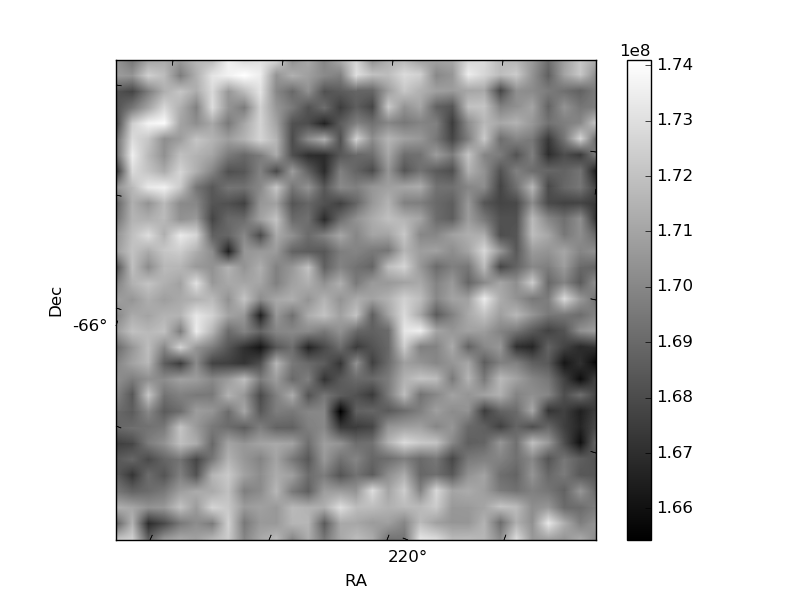
Histogram calculated using DETX and DETY for each event in the final _common_clean file
| Quadrant A | 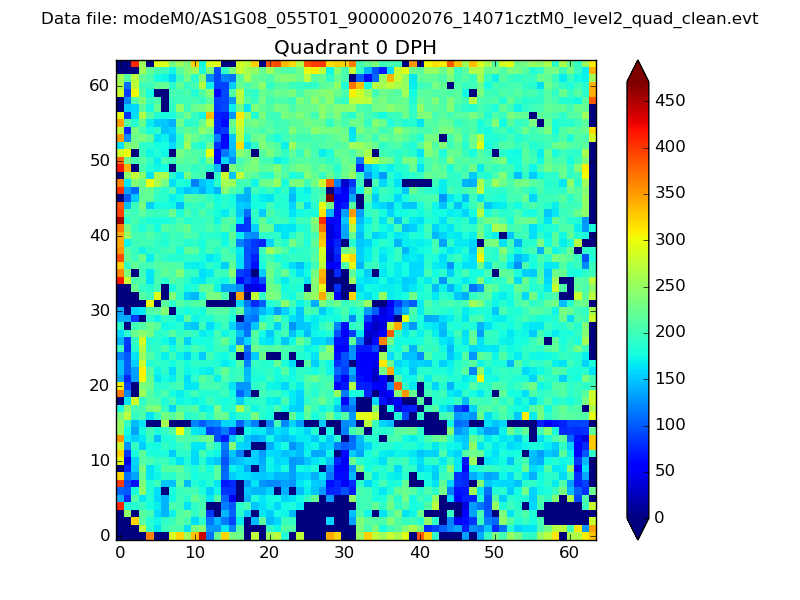 |
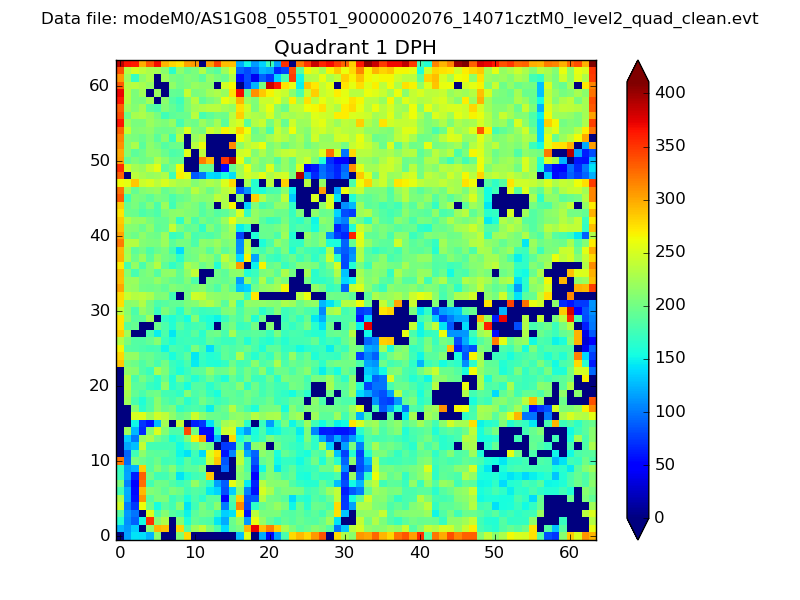 |
Quadrant B |
|---|---|---|---|
| Quadrant D |  |
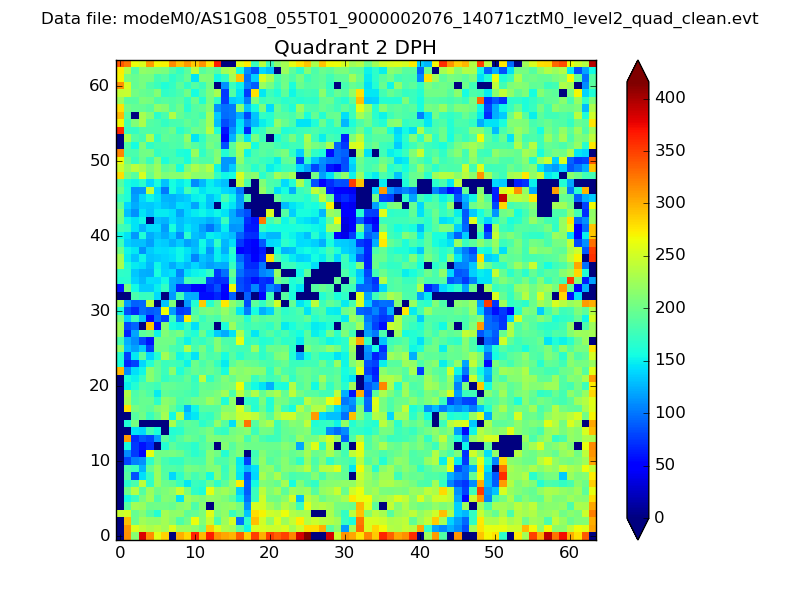 |
Quadrant C |
| Plot type | Count rate plots | Images |
|---|---|---|
| Comparison with Poisson distribution Blue bars denote a histogram of data divided into 1 sec bins. Red curve is a Poisson curve with rate = median count rate of data. |
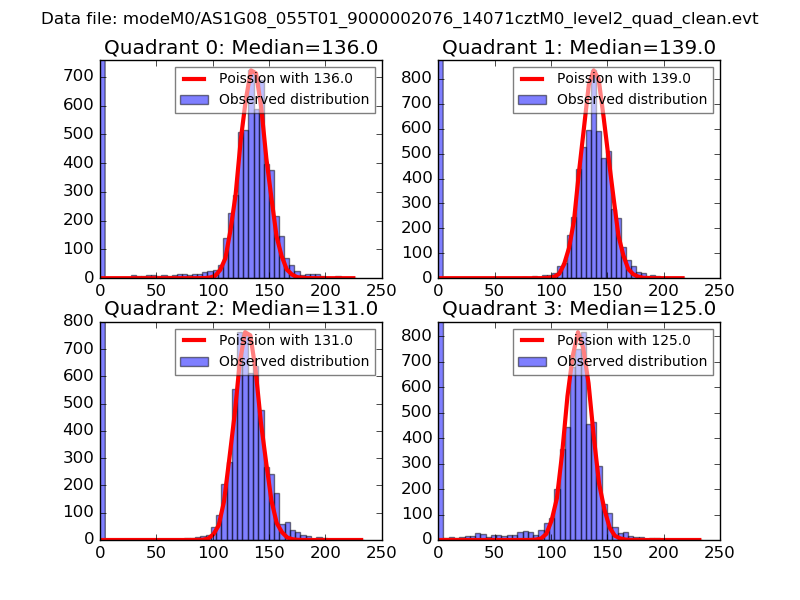 |
 |
| Quadrant-wise count rates Data is divided into 100 sec bins |
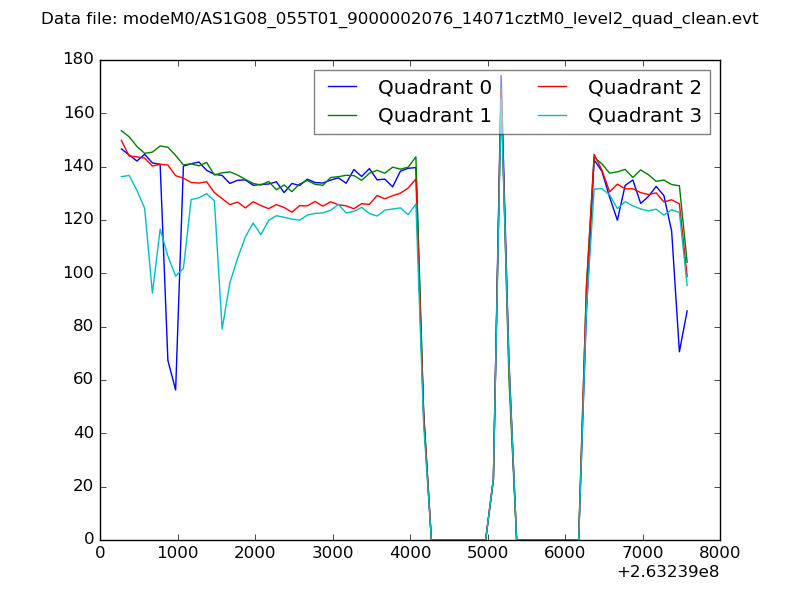 |
|
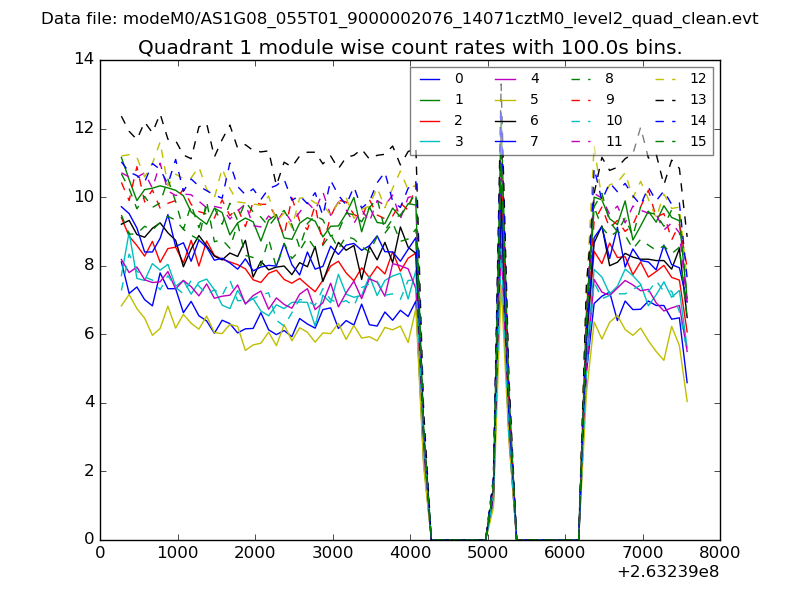
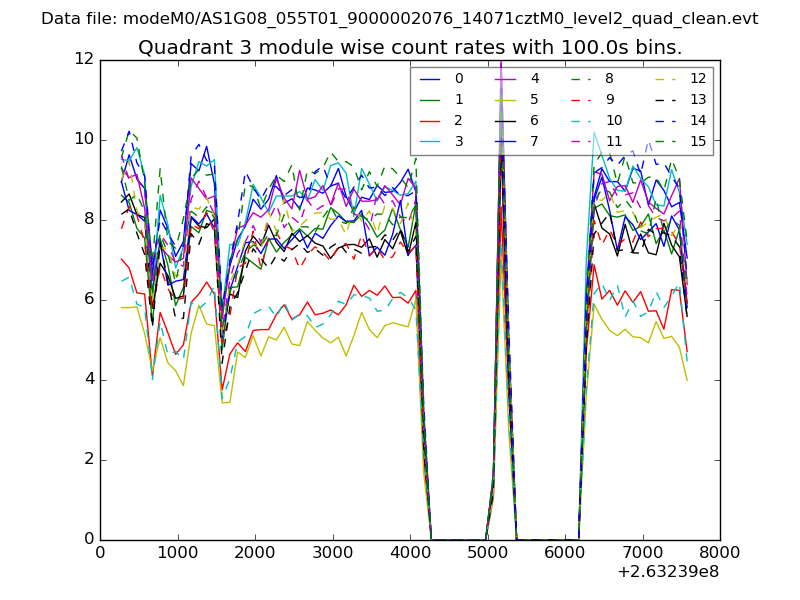
| Module-wise count rates for Quadrant A Data is divided into 100 sec bins |
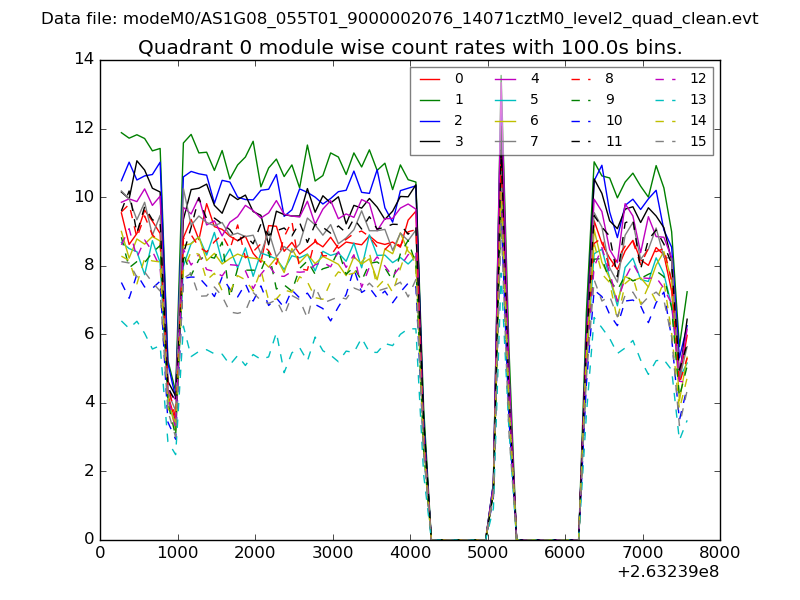 |
 |
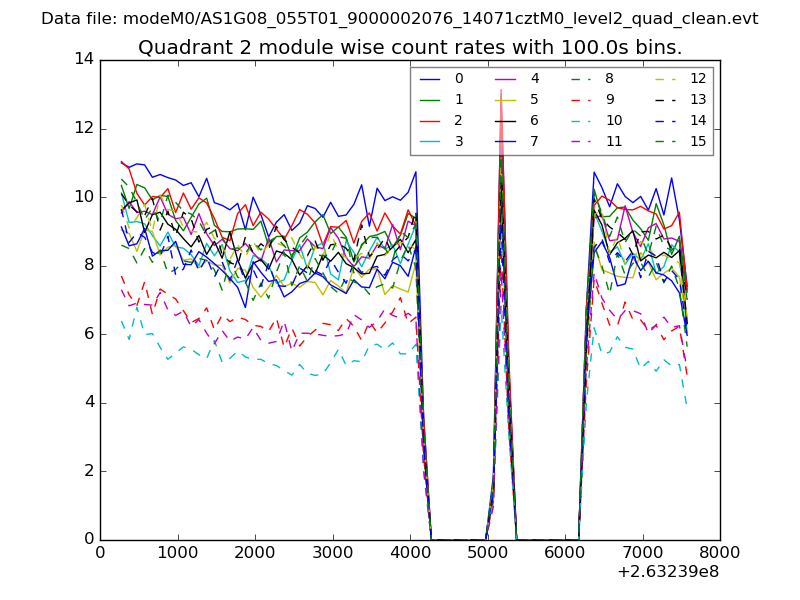
| Module-wise count rates for Quadrant B Data is divided into 100 sec bins |
 |
 |
| Module-wise count rates for Quadrant C Data is divided into 100 sec bins |
 |
 |
| Module-wise count rates for Quadrant D Data is divided into 100 sec bins |
 |
 |
| Parameter | Plot |
|---|---|
| CZT HV Monitor | 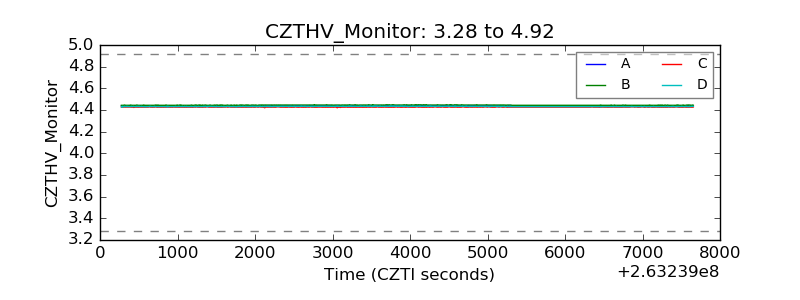 |
| D_VDD | 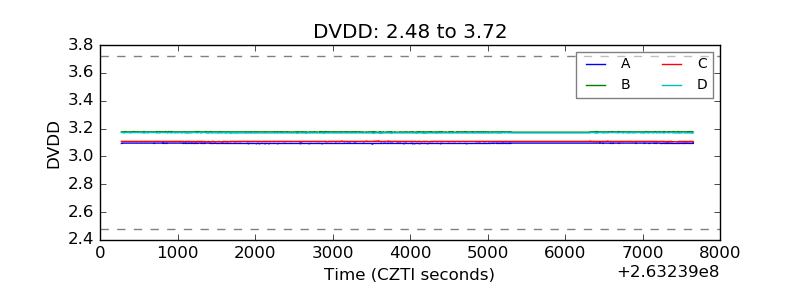 |
| Temperature 1 | 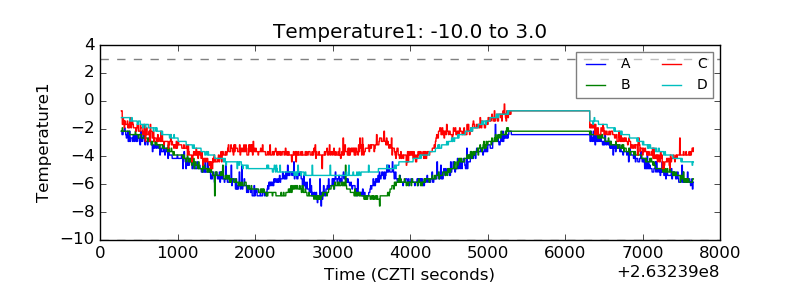 |
| Veto HV Monitor | 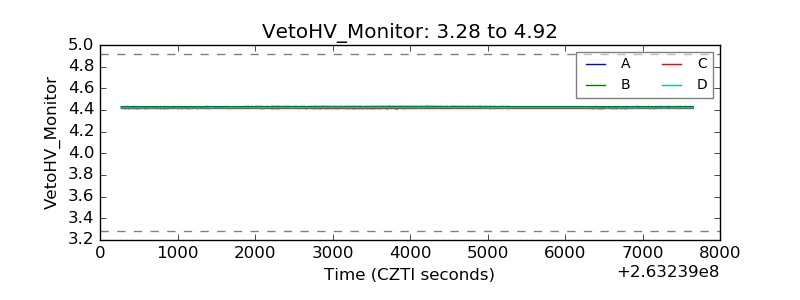 |
| Veto LLD | 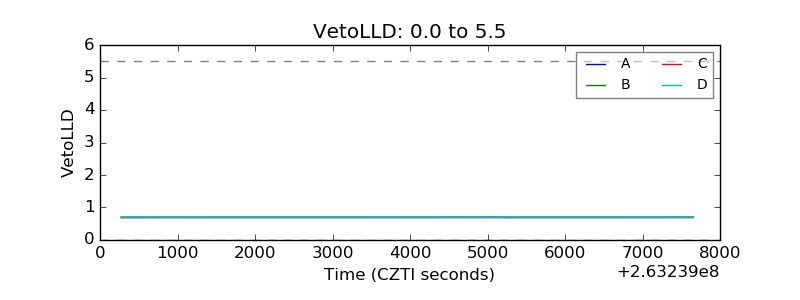 |
| Alpha Counter | 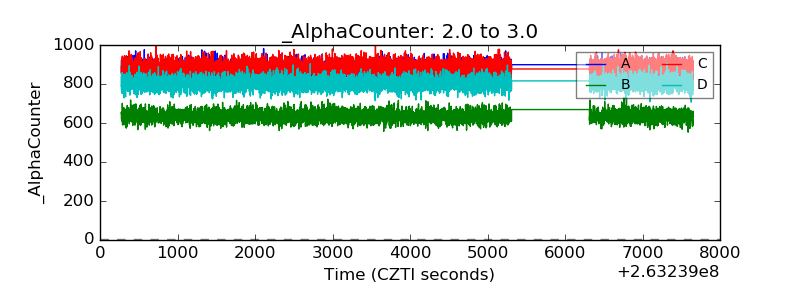 |
| _CPM_Rate | 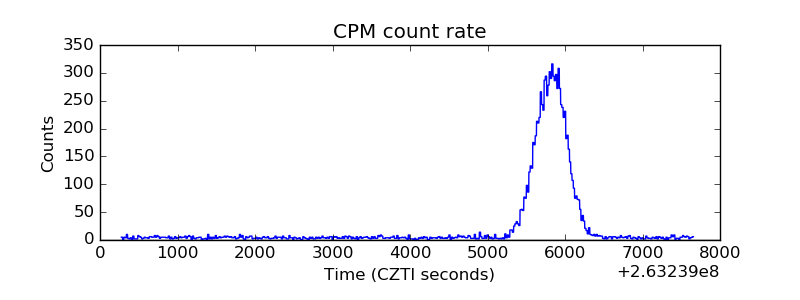 |
| CZT Counter |  |
| +2.5 Volts monitor |  |
| +5 Volts monitor |  |
| _ROLL_ROT | 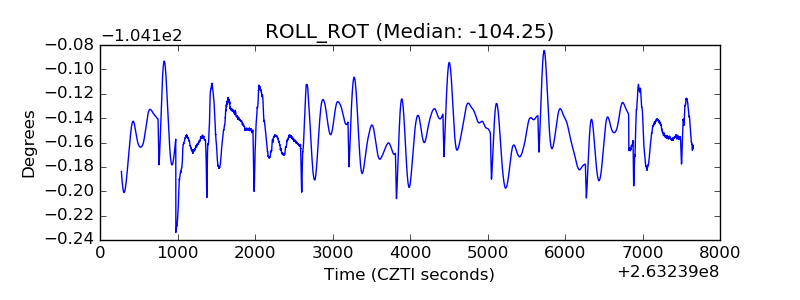 |
| _Roll_DEC | 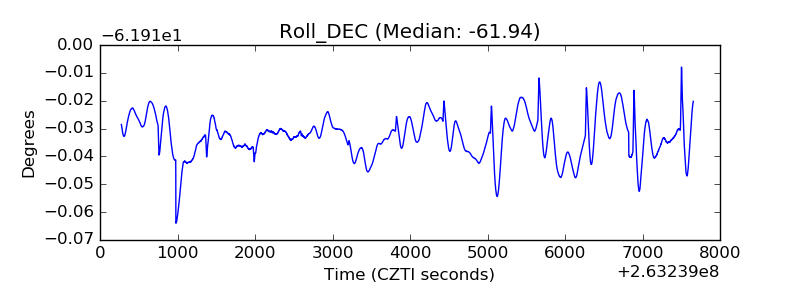 |
| _Roll_RA |  |
| Veto Counter | 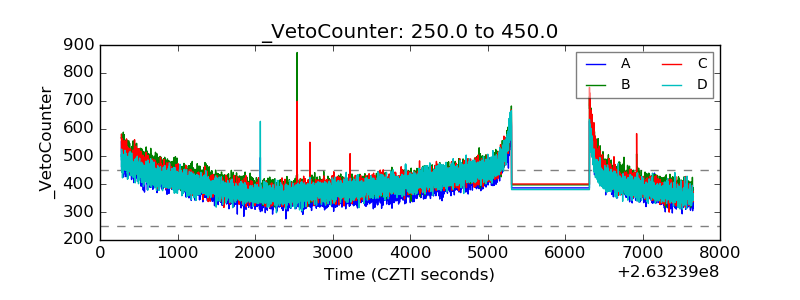 |