| Param | Original file | Final file |
|---|---|---|
| Filename | modeM0/AS1G08_055T01_9000002076_14072cztM0_level2.evt | modeM0/AS1G08_055T01_9000002076_14072cztM0_level2_quad_clean.evt |
| Size (bytes) | 625,481,280 | 120,288,960 |
| Size | 596.5 MB | 114.7 MB |
| Events in quadrant A | 6,043,070 | 775,263 |
| Events in quadrant B | 3,817,111 | 825,654 |
| Events in quadrant C | 3,268,960 | 791,266 |
| Events in quadrant D | 5,331,548 | 754,711 |
| Mode M9 | |||
|---|---|---|---|
| Quadrant | BADHDUFLAG | Total packets | Discarded packets |
| A | 0 | 12 | 0 |
| B | 0 | 12 | 0 |
| C | 0 | 12 | 0 |
| D | 0 | 13 | 0 |
| Mode SS | |||
|---|---|---|---|
| Quadrant | BADHDUFLAG | Total packets | Discarded packets |
| A | 0 | 144 | 0 |
| B | 0 | 144 | 0 |
| C | 0 | 144 | 0 |
| D | 0 | 144 | 0 |
| Mode M0 | |||
|---|---|---|---|
| Quadrant | BADHDUFLAG | Total packets | Discarded packets |
| A | 0 | 22879 | 3 |
| B | 0 | 16024 | 2 |
| C | 0 | 14618 | 2 |
| D | 0 | 20873 | 2 |
| Quadrant | Total seconds | Saturated seconds | Saturation percentage |
|---|---|---|---|
| A | 7124 | 782 | 10.976979% |
| B | 7124 | 96 | 1.347558% |
| C | 7124 | 13 | 0.182482% |
| D | 7124 | 255 | 3.579450% |
Noise dominated data is calculated using 1-second bins in cleaned event files. If a bin has >2000 counts, and if more than 50% of those come from <1% of pixels, then it is considered to be noise-dominated and hence unusable.
| Quadrant | # 1 sec bins | Bins with >0 counts | Bins with >2000 counts | High rate bins dominated by noise | Noise dominated (total time) | Noise dominated (detector-on time) | Marked lightcurve |
|---|---|---|---|---|---|---|---|
| A | 7695 | 7126 | 642 | 642 | 8.34% | 9.01% | 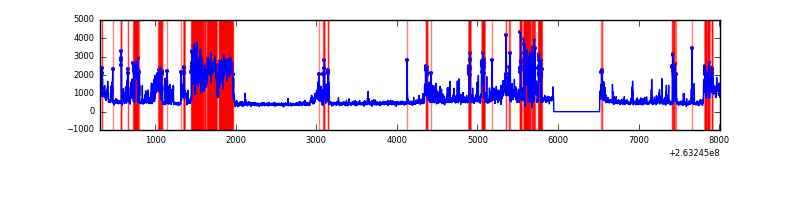 |
| B | 7695 | 7126 | 22 | 22 | 0.29% | 0.31% | 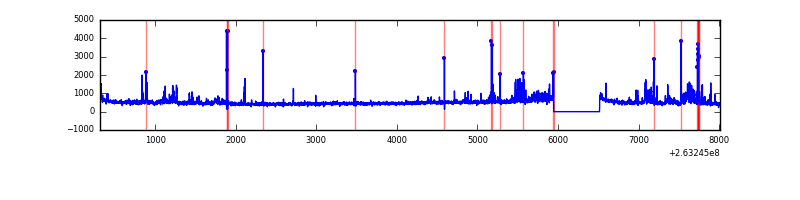 |
| C | 7695 | 7126 | 4 | 4 | 0.05% | 0.06% | 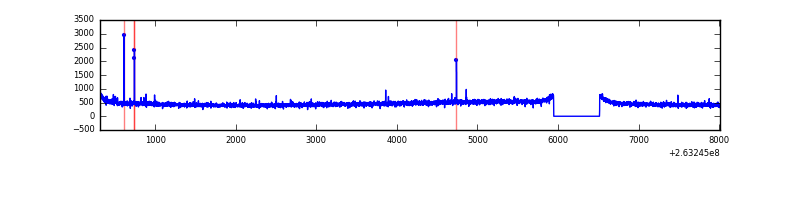 |
| D | 7695 | 7126 | 128 | 128 | 1.66% | 1.80% | 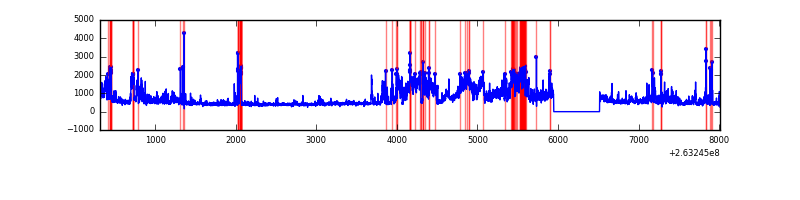 |
Top three noisy pixels from each quadrant. If the there are fewer than three noisy pixels in the level2.evt file, extra rows are filled as -1
| Pixel properties | Quadrant properties | ||||||
|---|---|---|---|---|---|---|---|
| Quadrant | DetID | PixID | Counts | Sigma | Mean | Median | Sigma |
| A | 15 | 222 | 2770732 | 16746.25 | 817 | 798 | 165.4 |
| A | 12 | 189 | 64749 | 386.63 | 817 | 798 | 165.4 |
| A | 9 | 143 | 38186 | 226.04 | 817 | 798 | 165.4 |
| B | 10 | 16 | 124276 | 774.71 | 849 | 831 | 159.3 |
| B | 0 | 189 | 81891 | 508.71 | 849 | 831 | 159.3 |
| B | 3 | 209 | 61514 | 380.83 | 849 | 831 | 159.3 |
| C | 3 | 233 | 74611 | 393.79 | 813 | 816 | 187.4 |
| C | 14 | 234 | 12033 | 59.85 | 813 | 816 | 187.4 |
| C | 0 | 207 | 11778 | 58.49 | 813 | 816 | 187.4 |
| D | 12 | 110 | 1267617 | 6008.36 | 794 | 776 | 210.8 |
| D | 1 | 52 | 311566 | 1474.01 | 794 | 776 | 210.8 |
| D | 10 | 172 | 183645 | 867.31 | 794 | 776 | 210.8 |
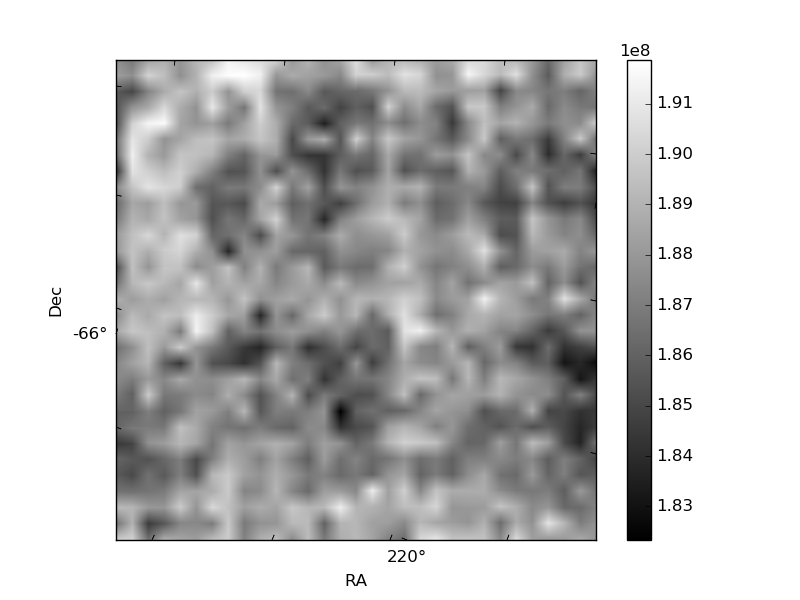
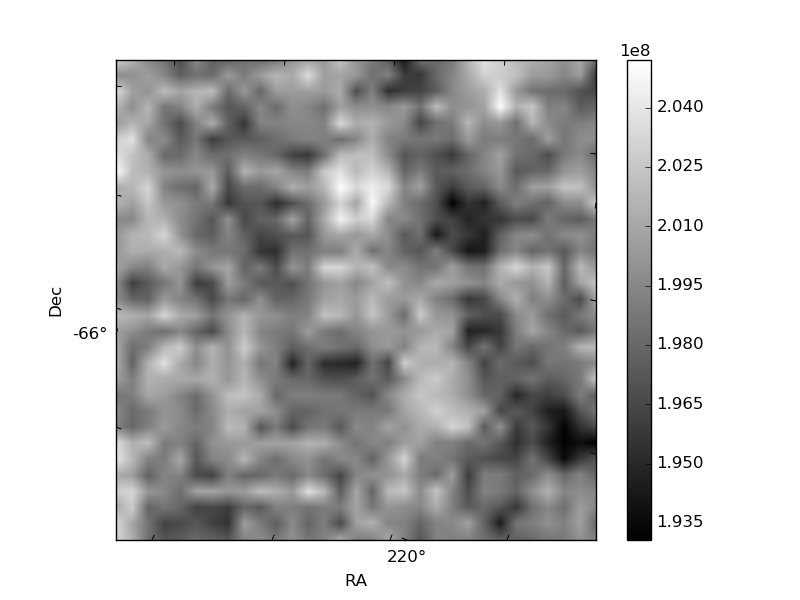
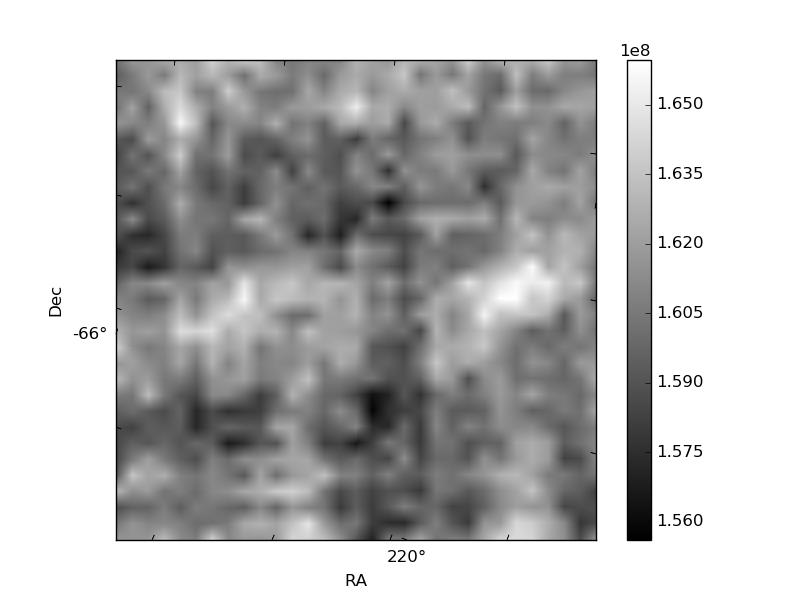
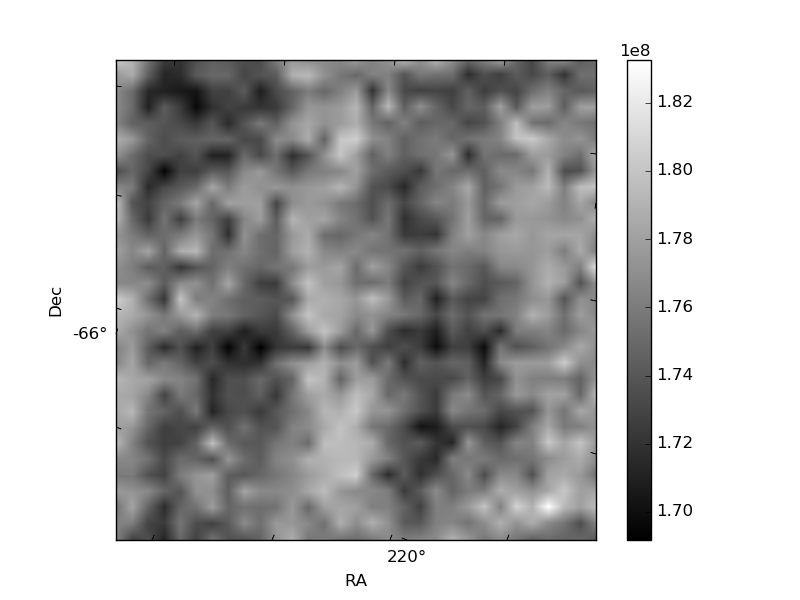
Histogram calculated using DETX and DETY for each event in the final _common_clean file
| Quadrant A | 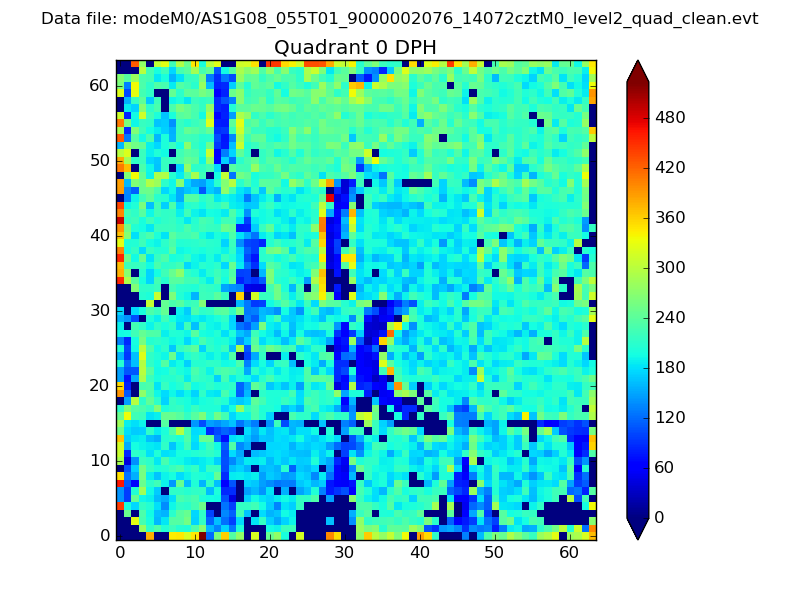 |
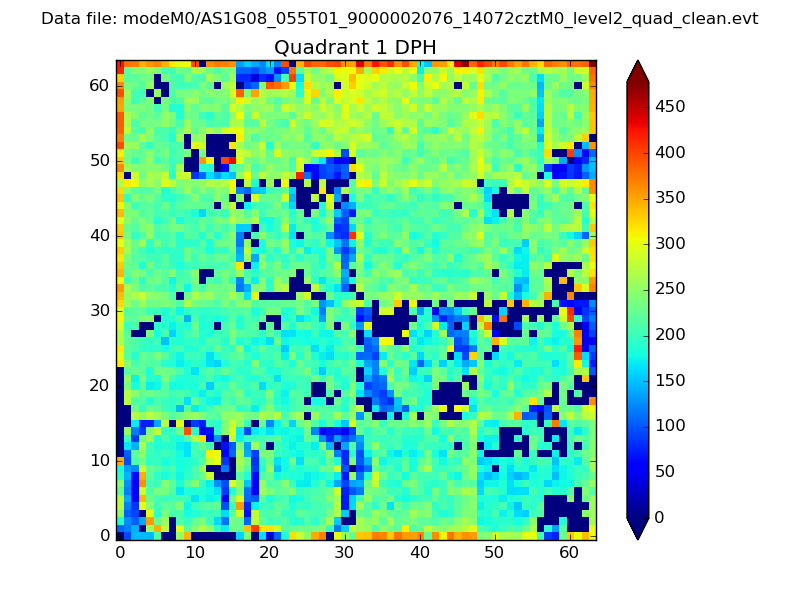 |
Quadrant B |
|---|---|---|---|
| Quadrant D | 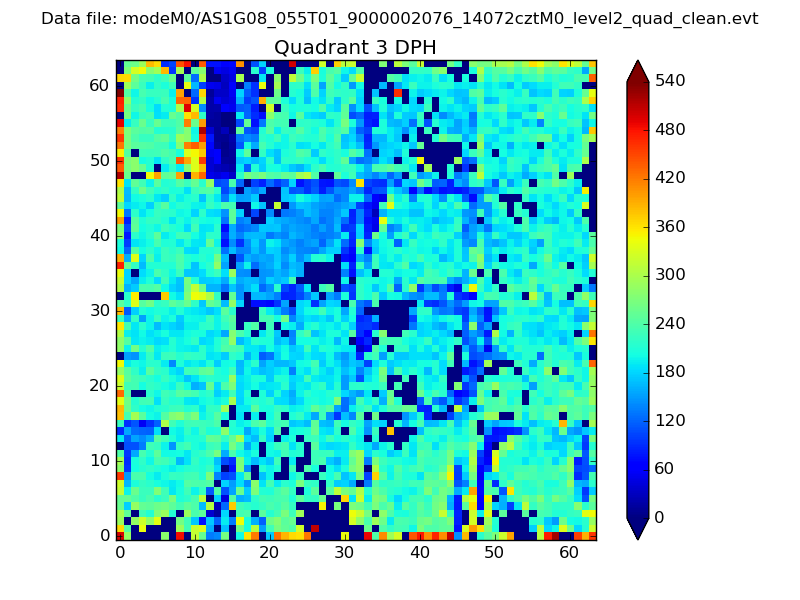 |
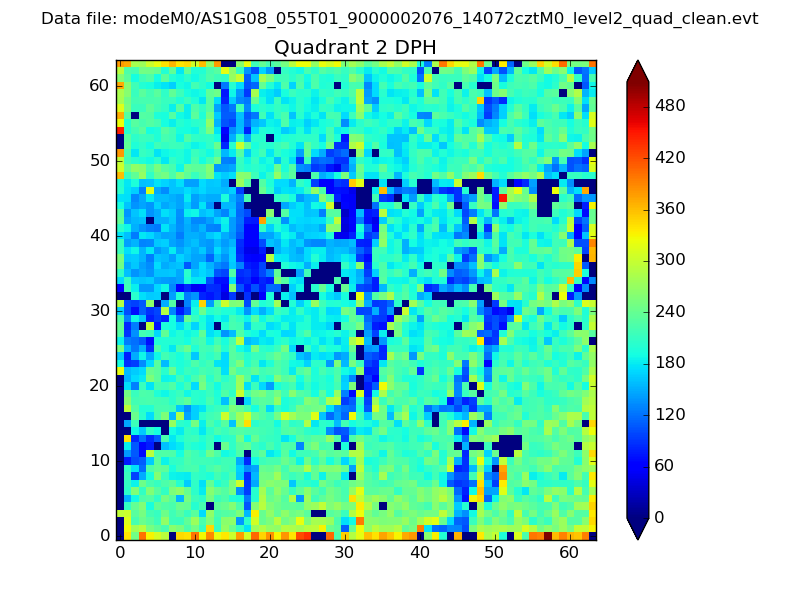 |
Quadrant C |
| Plot type | Count rate plots | Images |
|---|---|---|
| Comparison with Poisson distribution Blue bars denote a histogram of data divided into 1 sec bins. Red curve is a Poisson curve with rate = median count rate of data. |
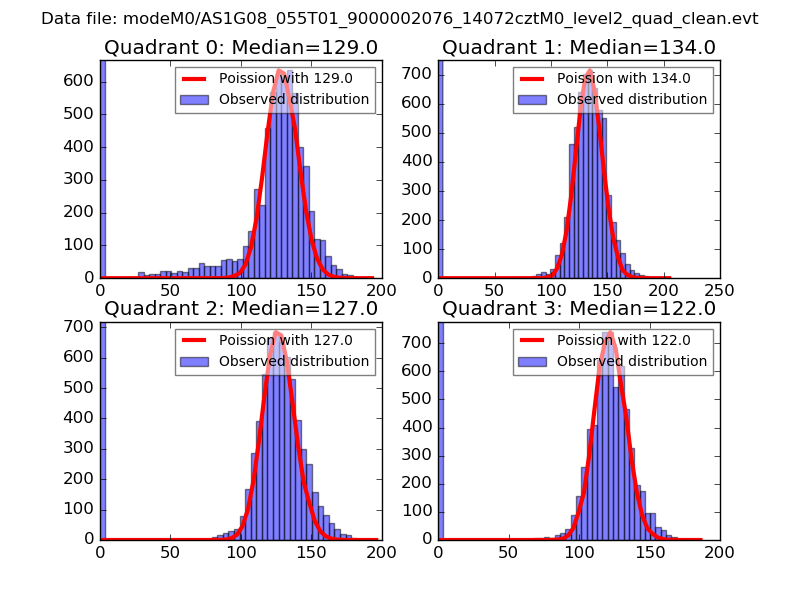 |
 |
| Quadrant-wise count rates Data is divided into 100 sec bins |
 |
|
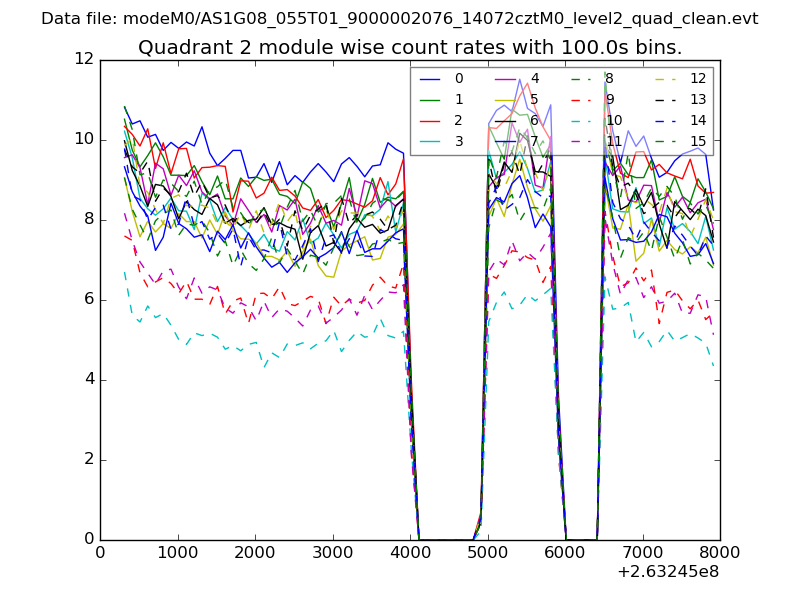
| Module-wise count rates for Quadrant A Data is divided into 100 sec bins |
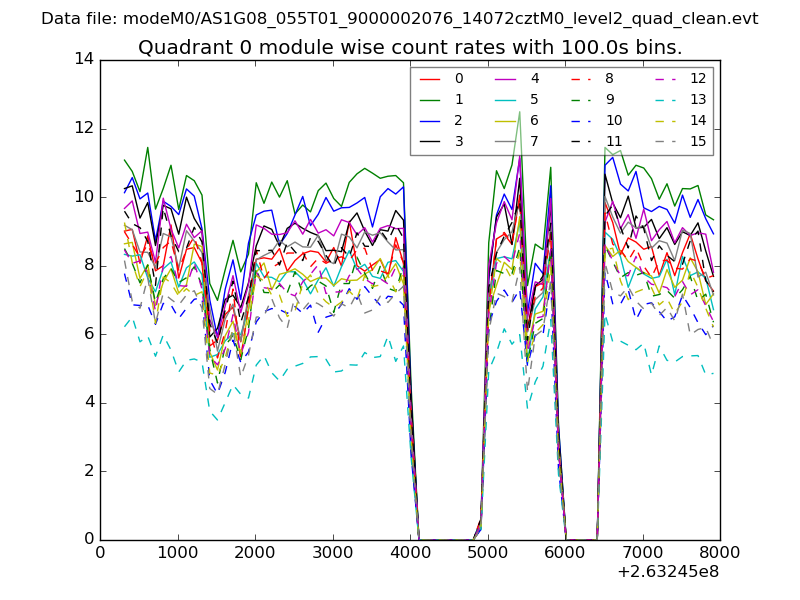 |
 |
| Module-wise count rates for Quadrant B Data is divided into 100 sec bins |
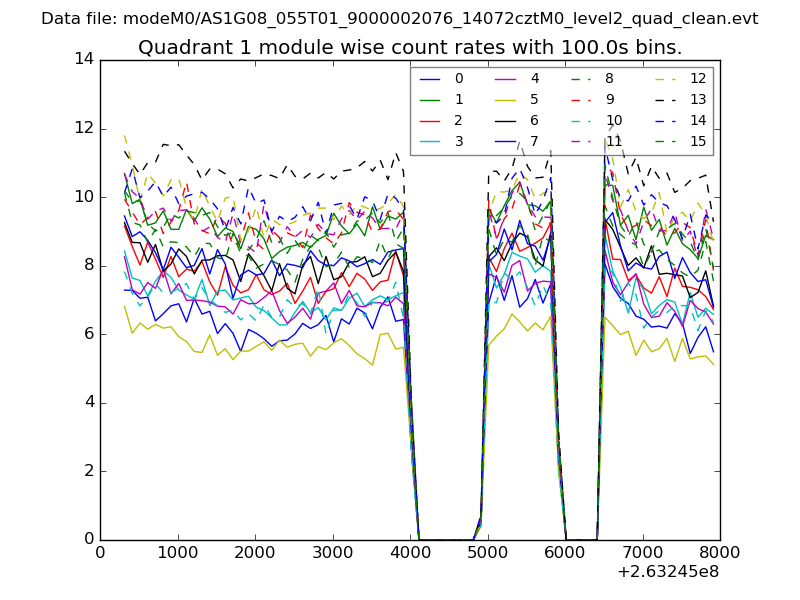 |
 |
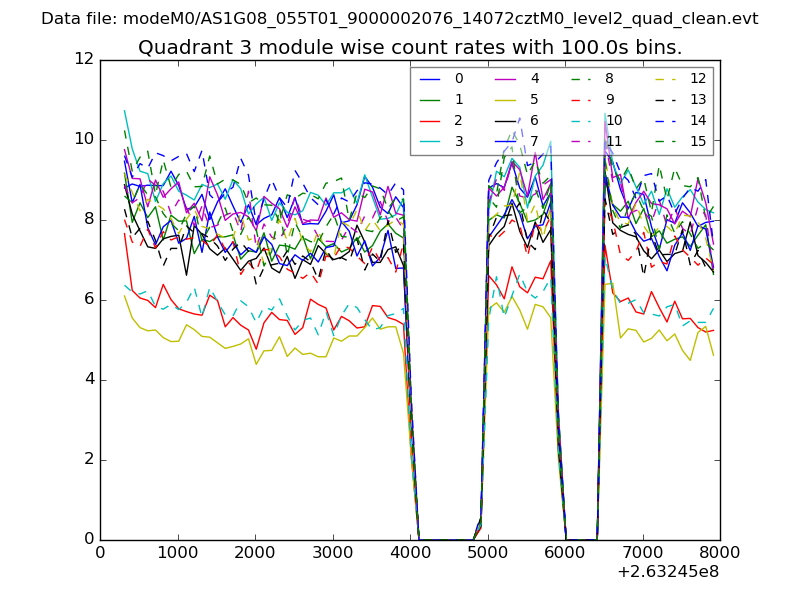
| Module-wise count rates for Quadrant C Data is divided into 100 sec bins |
 |
 |
| Module-wise count rates for Quadrant D Data is divided into 100 sec bins |
 |
 |
| Parameter | Plot |
|---|---|
| CZT HV Monitor | 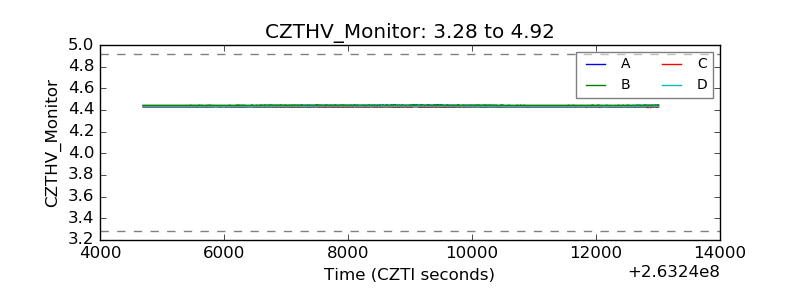 |
| D_VDD | 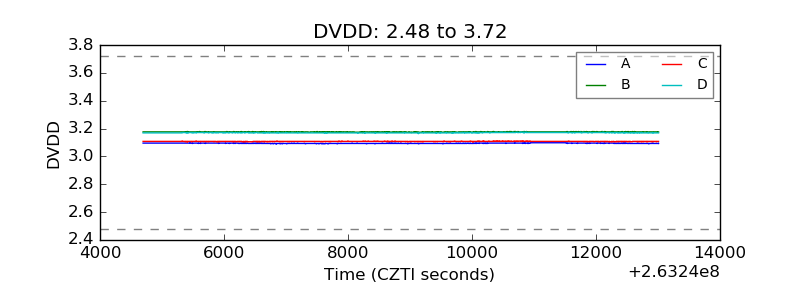 |
| Temperature 1 | 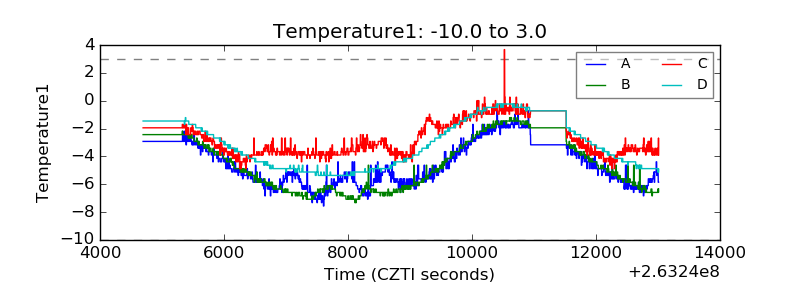 |
| Veto HV Monitor | 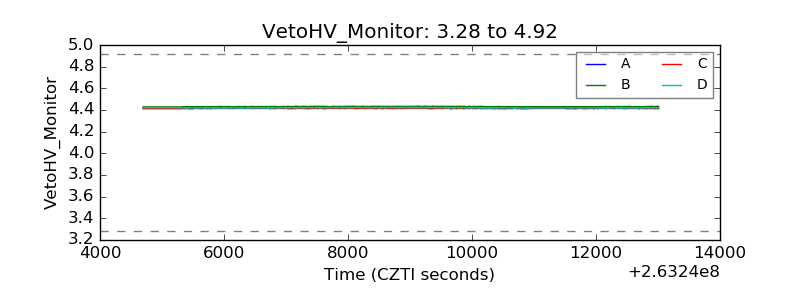 |
| Veto LLD | 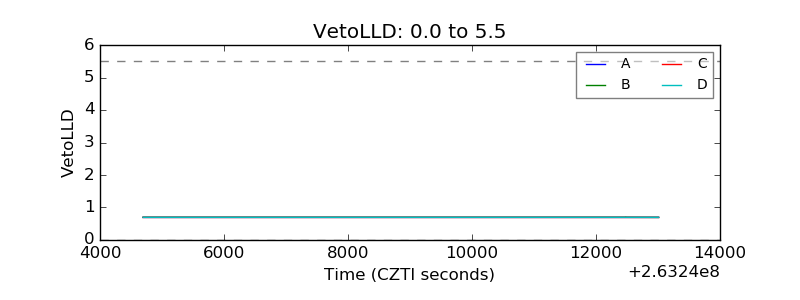 |
| Alpha Counter | 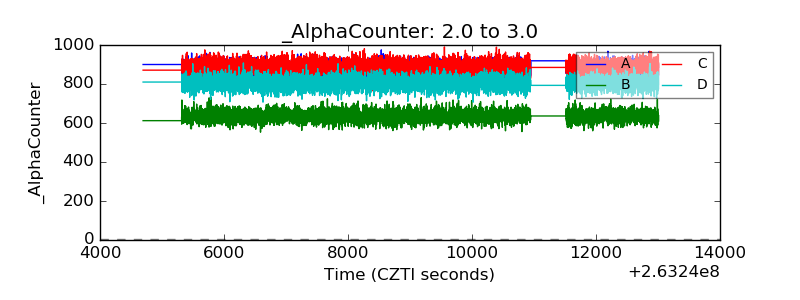 |
| _CPM_Rate | 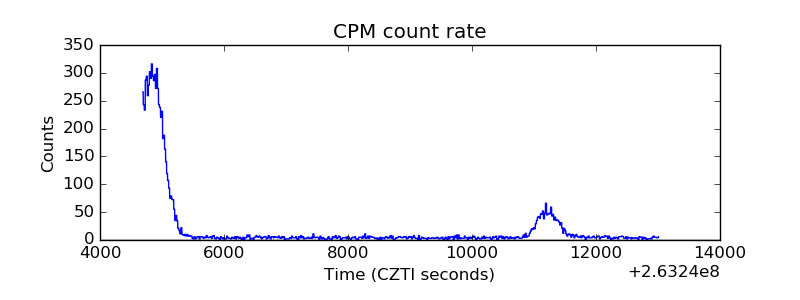 |
| CZT Counter |  |
| +2.5 Volts monitor |  |
| +5 Volts monitor |  |
| _ROLL_ROT | 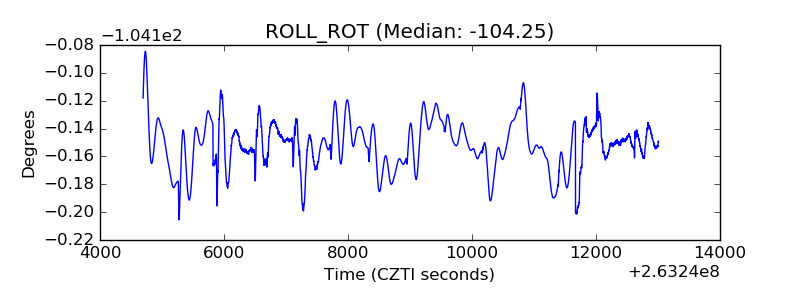 |
| _Roll_DEC | 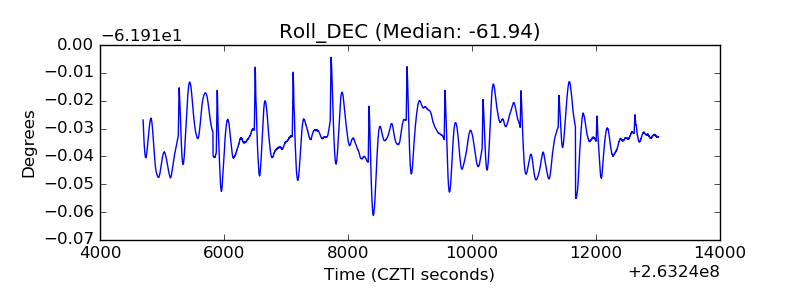 |
| _Roll_RA |  |
| Veto Counter | 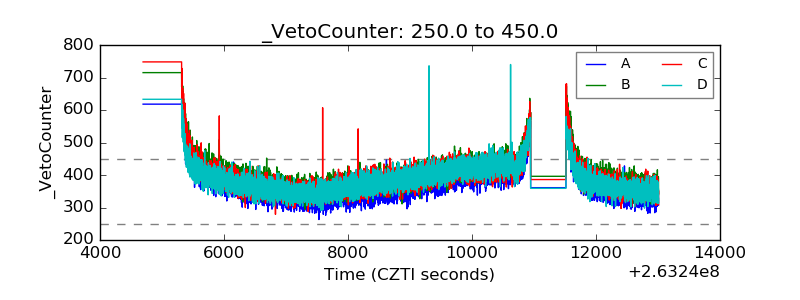 |