| Param | Original file | Final file |
|---|---|---|
| Filename | modeM0/AS1G08_055T01_9000002076_14073cztM0_level2.evt | modeM0/AS1G08_055T01_9000002076_14073cztM0_level2_quad_clean.evt |
| Size (bytes) | 603,607,680 | 132,765,120 |
| Size | 575.6 MB | 126.6 MB |
| Events in quadrant A | 5,579,171 | 878,382 |
| Events in quadrant B | 4,175,840 | 900,479 |
| Events in quadrant C | 3,574,067 | 866,416 |
| Events in quadrant D | 4,423,165 | 833,949 |
| Mode M9 | |||
|---|---|---|---|
| Quadrant | BADHDUFLAG | Total packets | Discarded packets |
| A | 0 | 8 | 0 |
| B | 0 | 8 | 0 |
| C | 0 | 8 | 0 |
| D | 0 | 8 | 0 |
| Mode SS | |||
|---|---|---|---|
| Quadrant | BADHDUFLAG | Total packets | Discarded packets |
| A | 0 | 158 | 0 |
| B | 0 | 158 | 0 |
| C | 0 | 158 | 0 |
| D | 0 | 158 | 0 |
| Mode M0 | |||
|---|---|---|---|
| Quadrant | BADHDUFLAG | Total packets | Discarded packets |
| A | 0 | 21917 | 3 |
| B | 0 | 17631 | 2 |
| C | 0 | 16033 | 2 |
| D | 0 | 18599 | 2 |
| Quadrant | Total seconds | Saturated seconds | Saturation percentage |
|---|---|---|---|
| A | 7801 | 202 | 2.589412% |
| B | 7801 | 137 | 1.756185% |
| C | 7801 | 26 | 0.333291% |
| D | 7801 | 74 | 0.948596% |
Noise dominated data is calculated using 1-second bins in cleaned event files. If a bin has >2000 counts, and if more than 50% of those come from <1% of pixels, then it is considered to be noise-dominated and hence unusable.
| Quadrant | # 1 sec bins | Bins with >0 counts | Bins with >2000 counts | High rate bins dominated by noise | Noise dominated (total time) | Noise dominated (detector-on time) | Marked lightcurve |
|---|---|---|---|---|---|---|---|
| A | 8593 | 7805 | 97 | 97 | 1.13% | 1.24% | 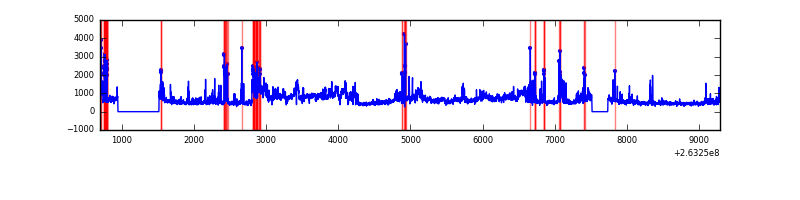 |
| B | 8593 | 7805 | 29 | 29 | 0.34% | 0.37% | 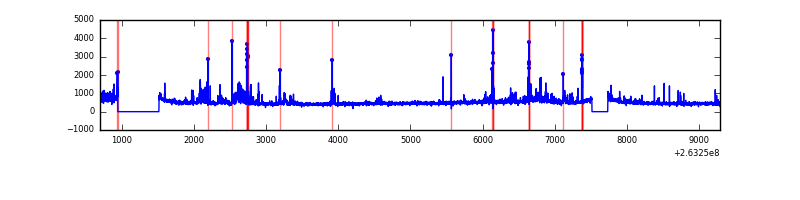 |
| C | 8593 | 7805 | 1 | 1 | 0.01% | 0.01% |  |
| D | 8593 | 7805 | 29 | 29 | 0.34% | 0.37% | 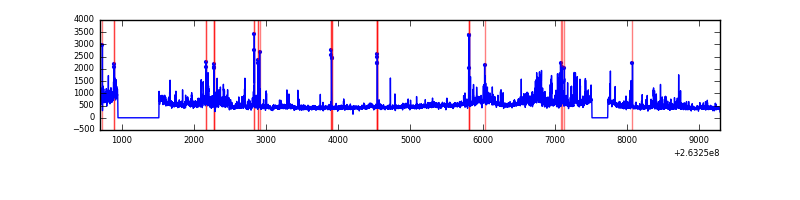 |
Top three noisy pixels from each quadrant. If the there are fewer than three noisy pixels in the level2.evt file, extra rows are filled as -1
| Pixel properties | Quadrant properties | ||||||
|---|---|---|---|---|---|---|---|
| Quadrant | DetID | PixID | Counts | Sigma | Mean | Median | Sigma |
| A | 15 | 222 | 1870391 | 10027.27 | 923 | 905 | 186.4 |
| A | 12 | 189 | 66205 | 350.25 | 923 | 905 | 186.4 |
| A | 12 | 96 | 41807 | 219.38 | 923 | 905 | 186.4 |
| B | 10 | 16 | 152978 | 868.04 | 933 | 911 | 175.2 |
| B | 0 | 189 | 109414 | 619.36 | 933 | 911 | 175.2 |
| B | 4 | 80 | 49392 | 276.74 | 933 | 911 | 175.2 |
| C | 3 | 233 | 61033 | 289.74 | 894 | 895 | 207.6 |
| C | 0 | 207 | 13379 | 60.15 | 894 | 895 | 207.6 |
| C | 15 | 176 | 12223 | 54.58 | 894 | 895 | 207.6 |
| D | 10 | 172 | 418512 | 1903.34 | 882 | 859 | 219.4 |
| D | 2 | 152 | 159453 | 722.75 | 882 | 859 | 219.4 |
| D | 8 | 195 | 120938 | 547.23 | 882 | 859 | 219.4 |
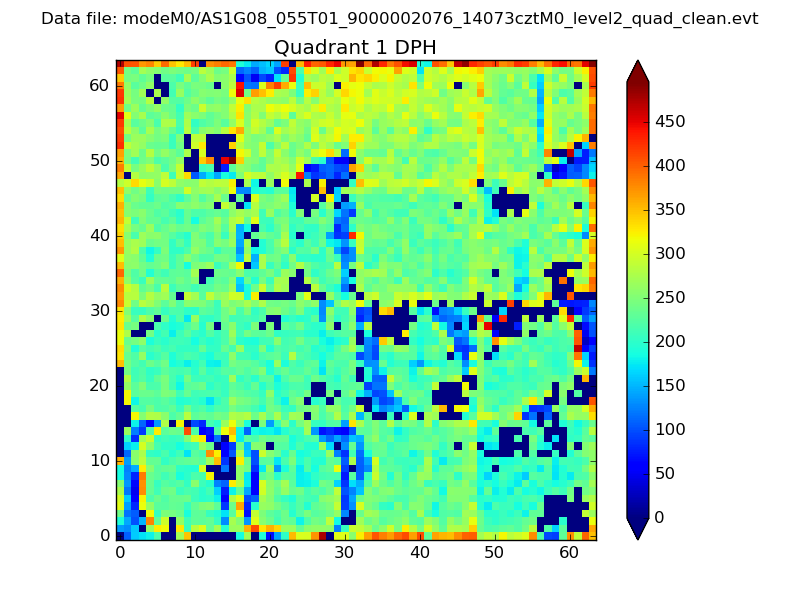
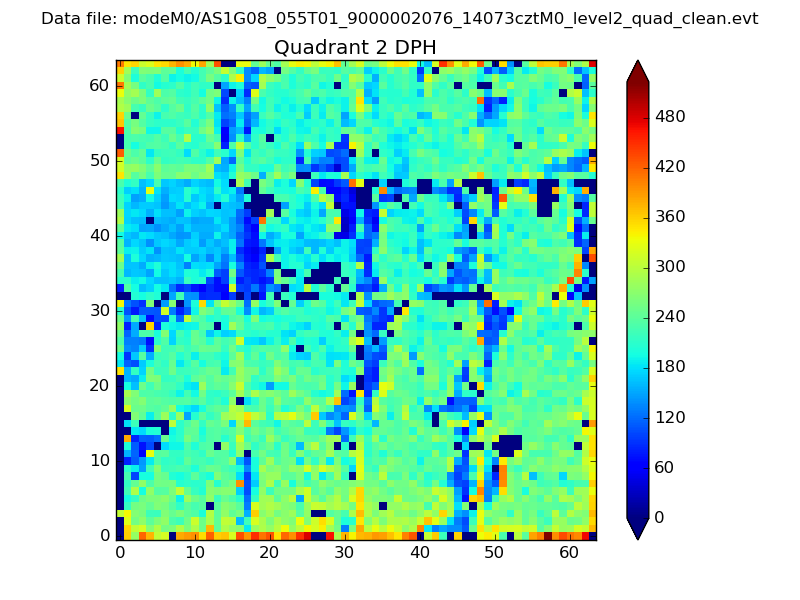
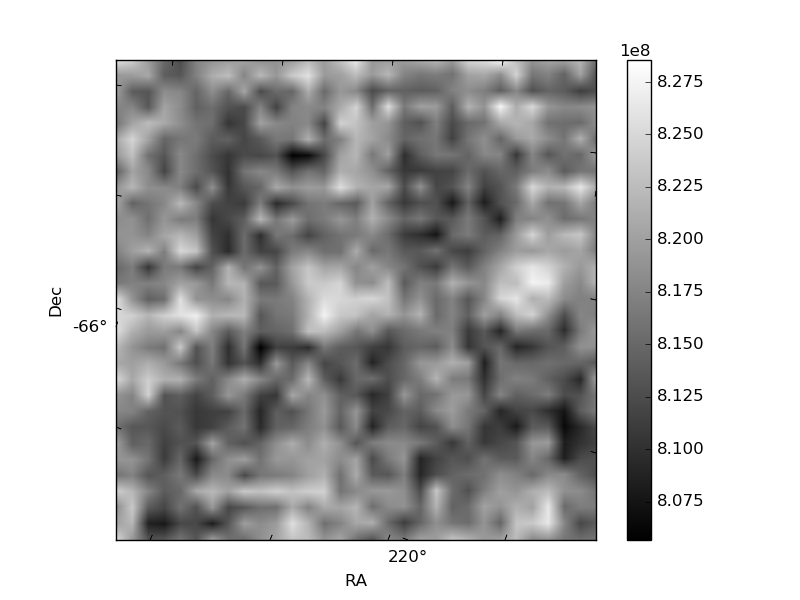
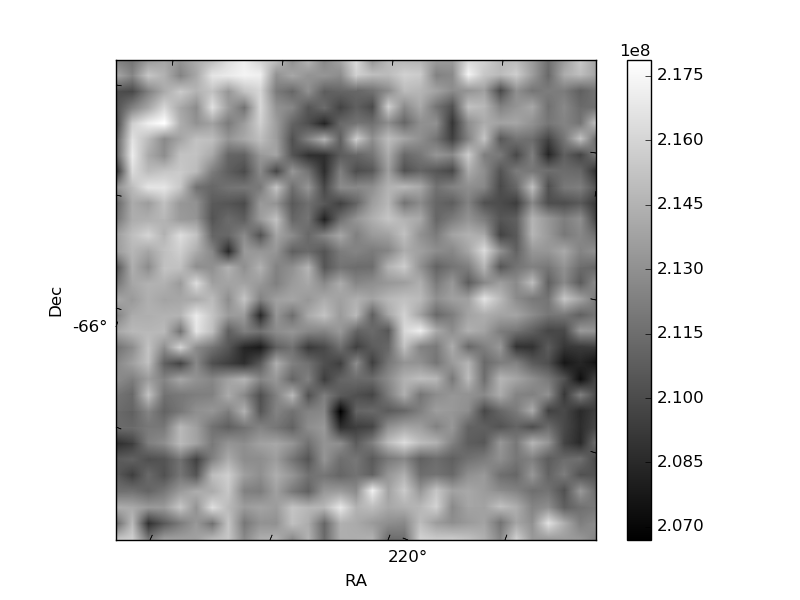
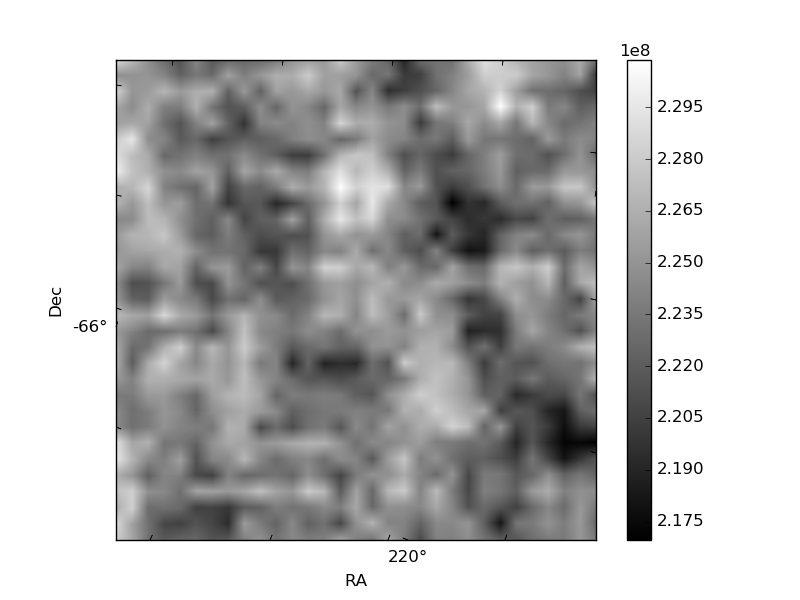
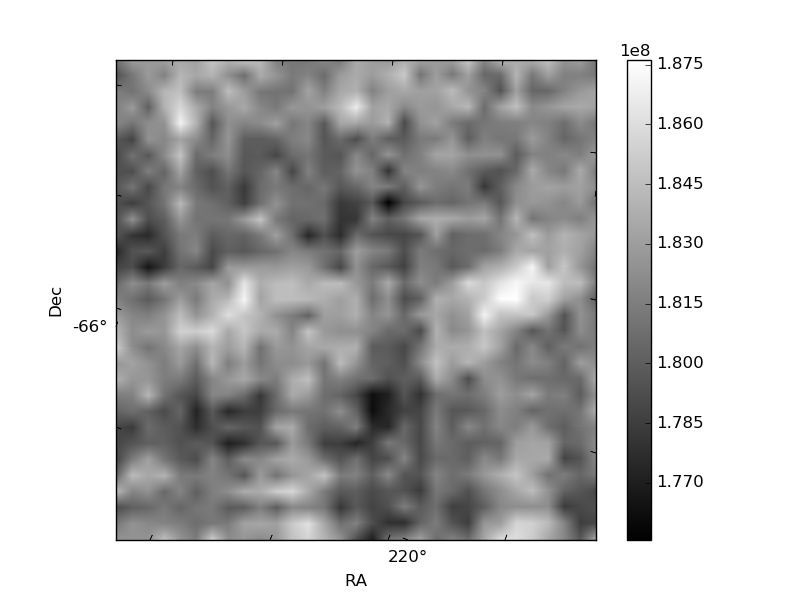
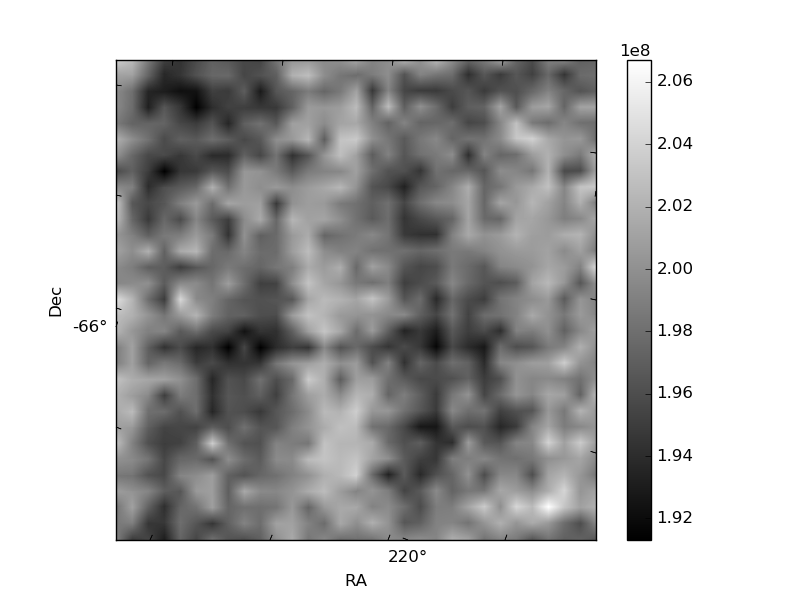
Histogram calculated using DETX and DETY for each event in the final _common_clean file
| Quadrant A | 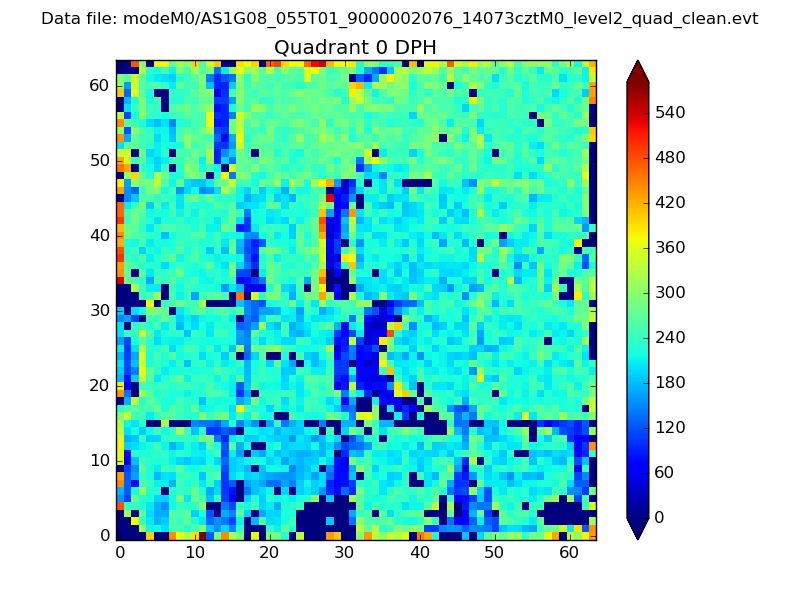 |
 |
Quadrant B |
|---|---|---|---|
| Quadrant D | 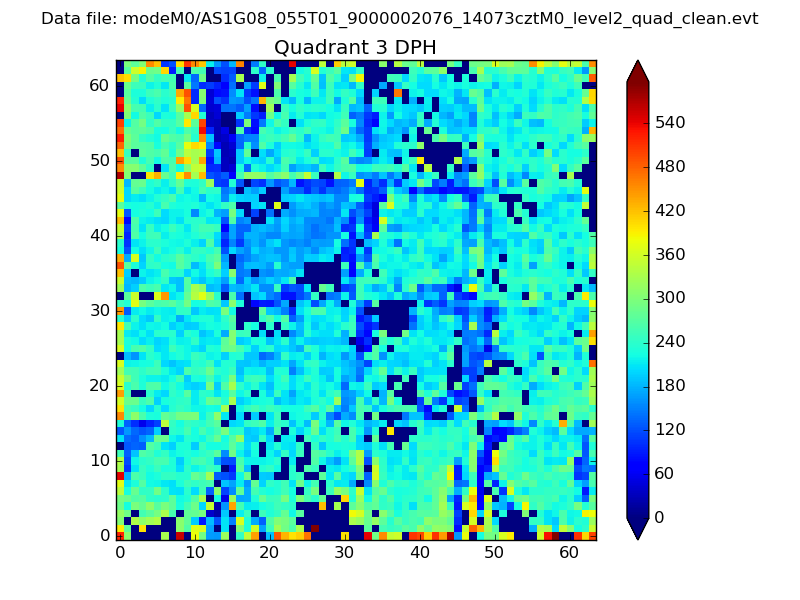 |
 |
Quadrant C |
| Plot type | Count rate plots | Images |
|---|---|---|
| Comparison with Poisson distribution Blue bars denote a histogram of data divided into 1 sec bins. Red curve is a Poisson curve with rate = median count rate of data. |
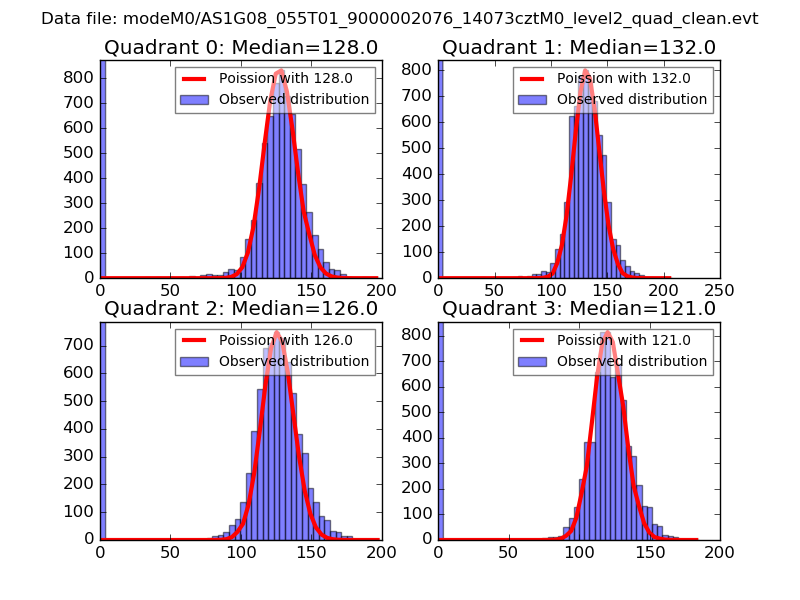 |
 |
| Quadrant-wise count rates Data is divided into 100 sec bins |
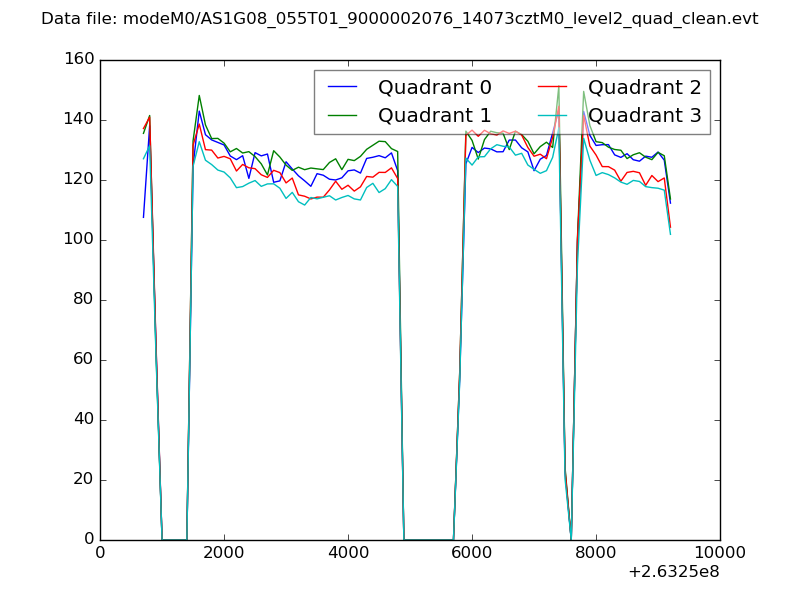 |
|
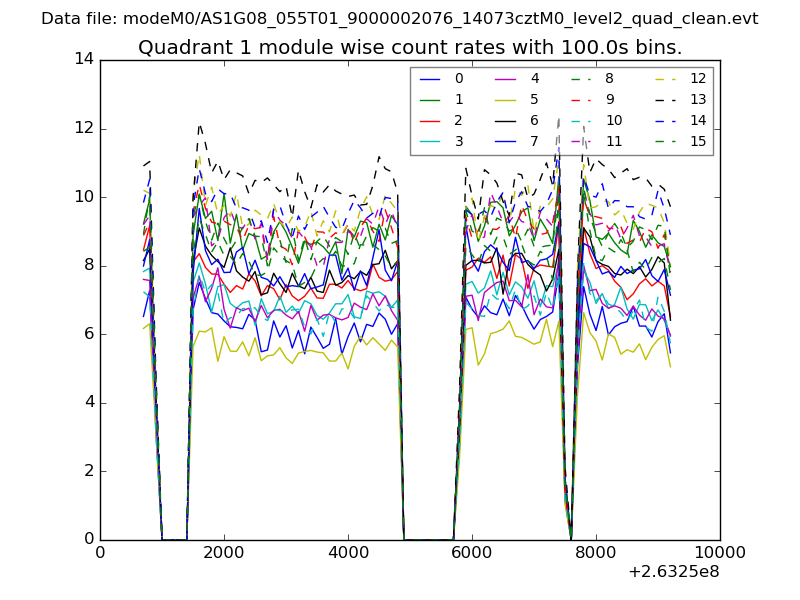
| Module-wise count rates for Quadrant A Data is divided into 100 sec bins |
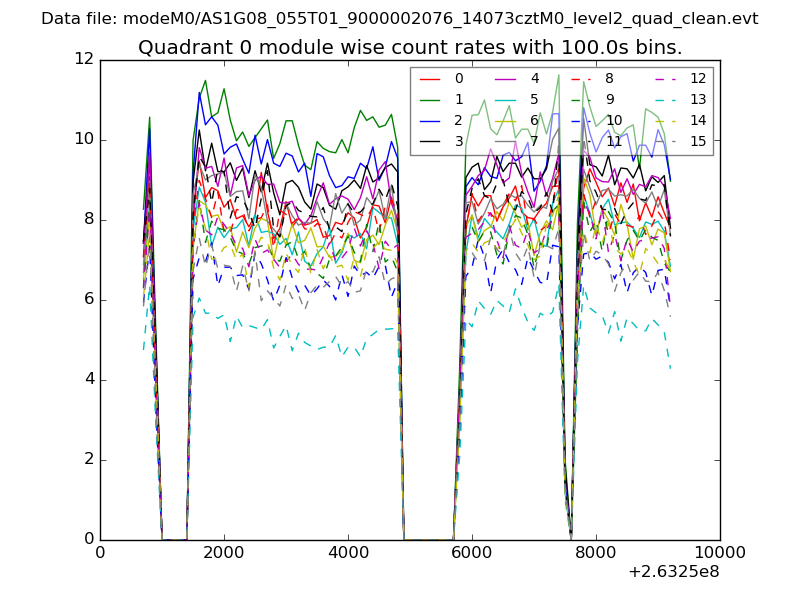 |
 |
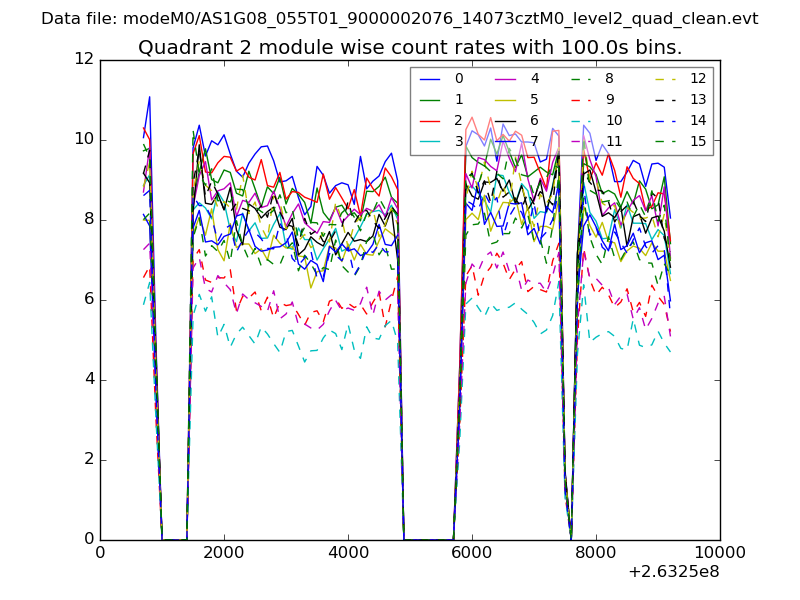
| Module-wise count rates for Quadrant B Data is divided into 100 sec bins |
 |
 |
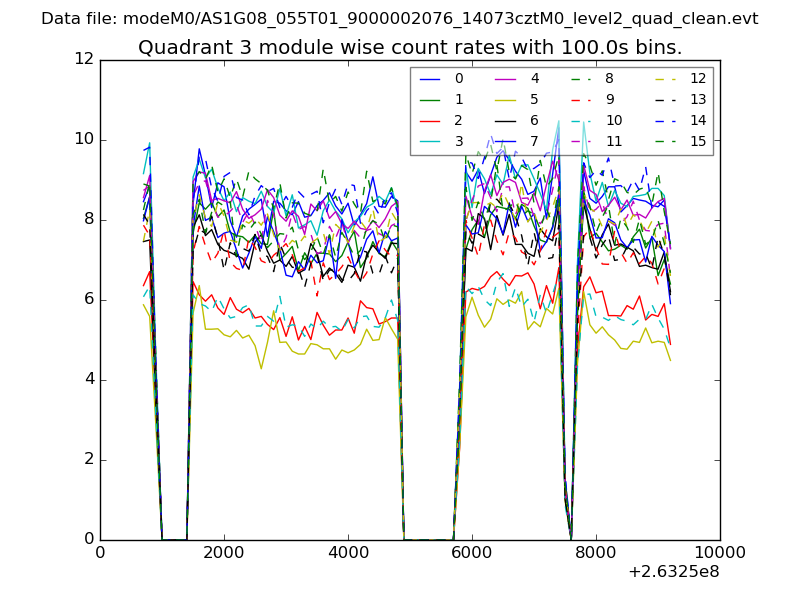
| Module-wise count rates for Quadrant C Data is divided into 100 sec bins |
 |
 |
| Module-wise count rates for Quadrant D Data is divided into 100 sec bins |
 |
 |
| Parameter | Plot |
|---|---|
| CZT HV Monitor | 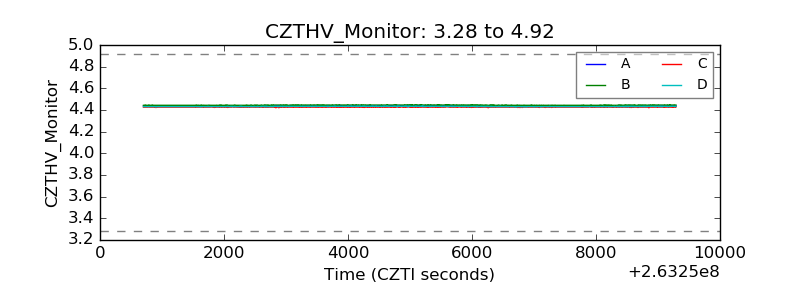 |
| D_VDD | 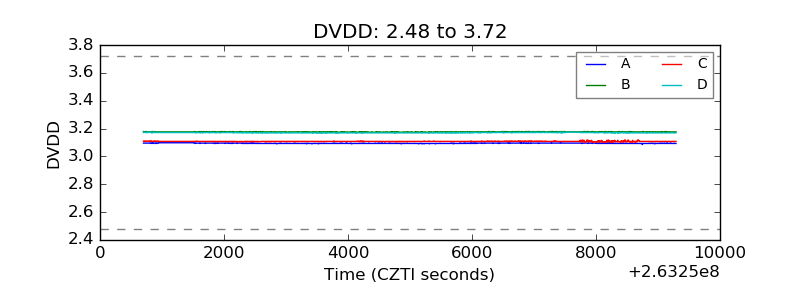 |
| Temperature 1 | 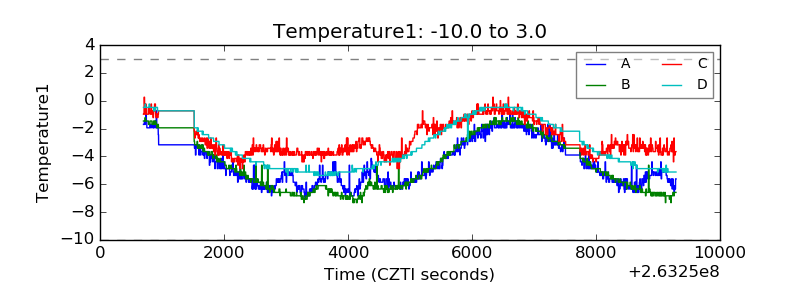 |
| Veto HV Monitor | 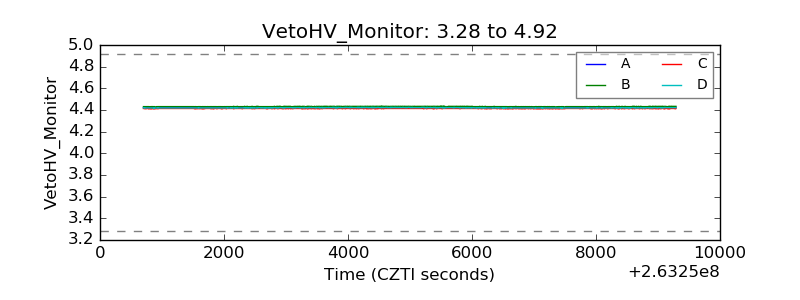 |
| Veto LLD | 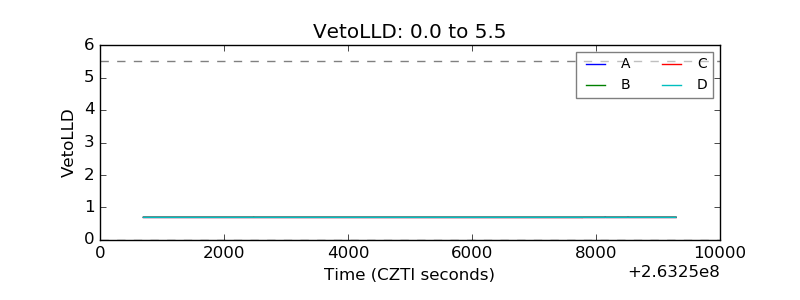 |
| Alpha Counter | 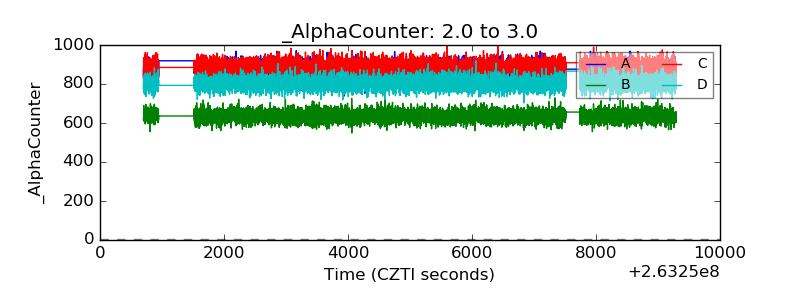 |
| _CPM_Rate | 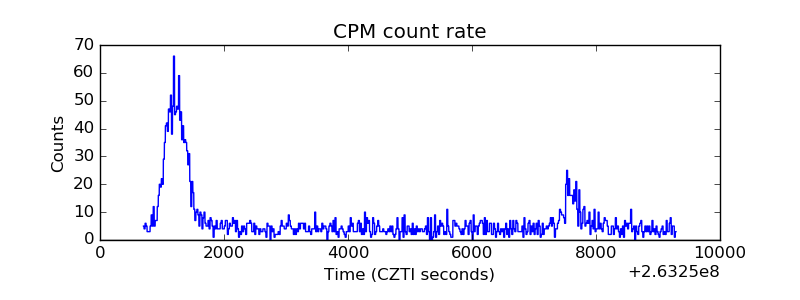 |
| CZT Counter | 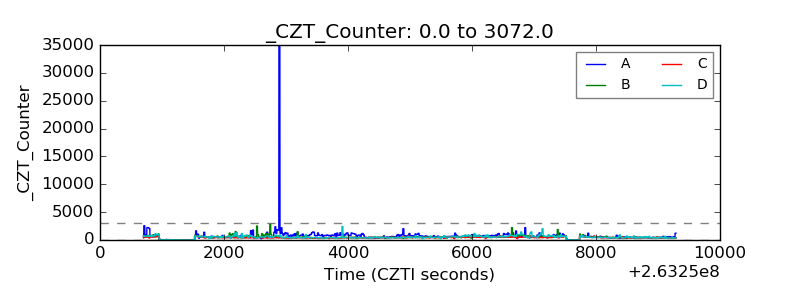 |
| +2.5 Volts monitor |  |
| +5 Volts monitor |  |
| _ROLL_ROT | 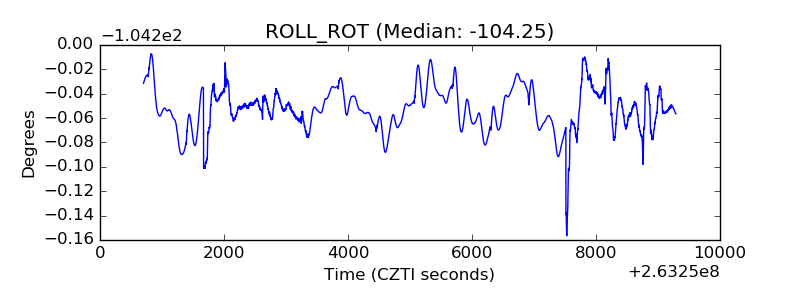 |
| _Roll_DEC |  |
| _Roll_RA | 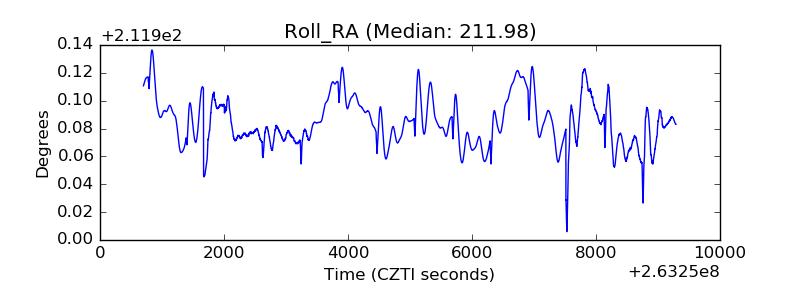 |
| Veto Counter | 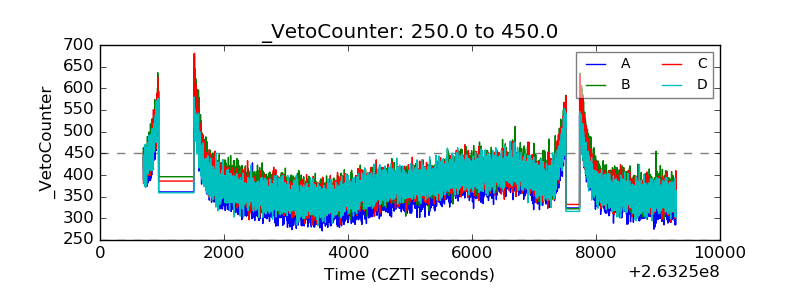 |