| Param | Original file | Final file |
|---|---|---|
| Filename | modeM0/AS1G08_055T01_9000002076_14074cztM0_level2.evt | modeM0/AS1G08_055T01_9000002076_14074cztM0_level2_quad_clean.evt |
| Size (bytes) | 602,763,840 | 141,206,400 |
| Size | 574.8 MB | 134.7 MB |
| Events in quadrant A | 5,366,511 | 934,557 |
| Events in quadrant B | 4,330,488 | 955,479 |
| Events in quadrant C | 3,808,067 | 918,610 |
| Events in quadrant D | 4,187,448 | 892,241 |
| Mode M9 | |||
|---|---|---|---|
| Quadrant | BADHDUFLAG | Total packets | Discarded packets |
| A | 0 | 3 | 0 |
| B | 0 | 3 | 0 |
| C | 0 | 3 | 0 |
| D | 0 | 3 | 0 |
| Mode SS | |||
|---|---|---|---|
| Quadrant | BADHDUFLAG | Total packets | Discarded packets |
| A | 0 | 172 | 0 |
| B | 0 | 172 | 0 |
| C | 0 | 172 | 0 |
| D | 0 | 172 | 0 |
| Mode M0 | |||
|---|---|---|---|
| Quadrant | BADHDUFLAG | Total packets | Discarded packets |
| A | 0 | 21521 | 3 |
| B | 0 | 18333 | 2 |
| C | 0 | 17066 | 2 |
| D | 0 | 18090 | 2 |
| Quadrant | Total seconds | Saturated seconds | Saturation percentage |
|---|---|---|---|
| A | 8282 | 333 | 4.020768% |
| B | 8282 | 193 | 2.330355% |
| C | 8282 | 71 | 0.857281% |
| D | 8282 | 85 | 1.026322% |
Noise dominated data is calculated using 1-second bins in cleaned event files. If a bin has >2000 counts, and if more than 50% of those come from <1% of pixels, then it is considered to be noise-dominated and hence unusable.
| Quadrant | # 1 sec bins | Bins with >0 counts | Bins with >2000 counts | High rate bins dominated by noise | Noise dominated (total time) | Noise dominated (detector-on time) | Marked lightcurve |
|---|---|---|---|---|---|---|---|
| A | 8658 | 8285 | 138 | 138 | 1.59% | 1.67% | 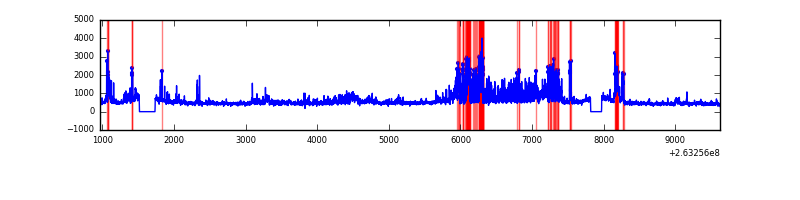 |
| B | 8658 | 8285 | 24 | 24 | 0.28% | 0.29% | 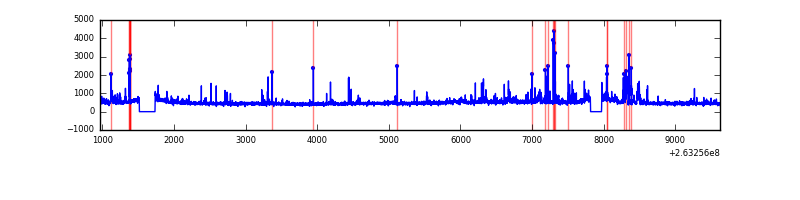 |
| C | 8658 | 8285 | 3 | 3 | 0.03% | 0.04% | 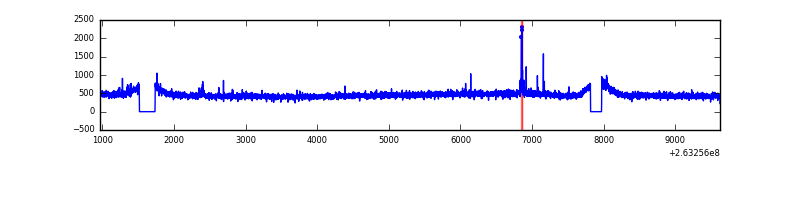 |
| D | 8658 | 8285 | 11 | 11 | 0.13% | 0.13% | 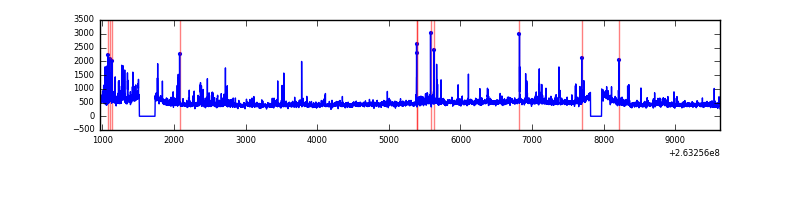 |
Top three noisy pixels from each quadrant. If the there are fewer than three noisy pixels in the level2.evt file, extra rows are filled as -1
| Pixel properties | Quadrant properties | ||||||
|---|---|---|---|---|---|---|---|
| Quadrant | DetID | PixID | Counts | Sigma | Mean | Median | Sigma |
| A | 15 | 222 | 1367022 | 6911.48 | 981 | 962 | 197.7 |
| A | 12 | 189 | 131991 | 662.93 | 981 | 962 | 197.7 |
| A | 8 | 15 | 68046 | 339.41 | 981 | 962 | 197.7 |
| B | 10 | 16 | 193763 | 1037.66 | 991 | 966 | 185.8 |
| B | 0 | 189 | 51566 | 272.34 | 991 | 966 | 185.8 |
| B | 0 | 190 | 37841 | 198.47 | 991 | 966 | 185.8 |
| C | 3 | 233 | 47131 | 210.49 | 950 | 952 | 219.4 |
| C | 0 | 207 | 31247 | 138.09 | 950 | 952 | 219.4 |
| C | 15 | 176 | 12511 | 52.69 | 950 | 952 | 219.4 |
| D | 2 | 152 | 148206 | 611.84 | 941 | 916 | 240.7 |
| D | 10 | 172 | 117807 | 485.56 | 941 | 916 | 240.7 |
| D | 8 | 195 | 116873 | 481.68 | 941 | 916 | 240.7 |
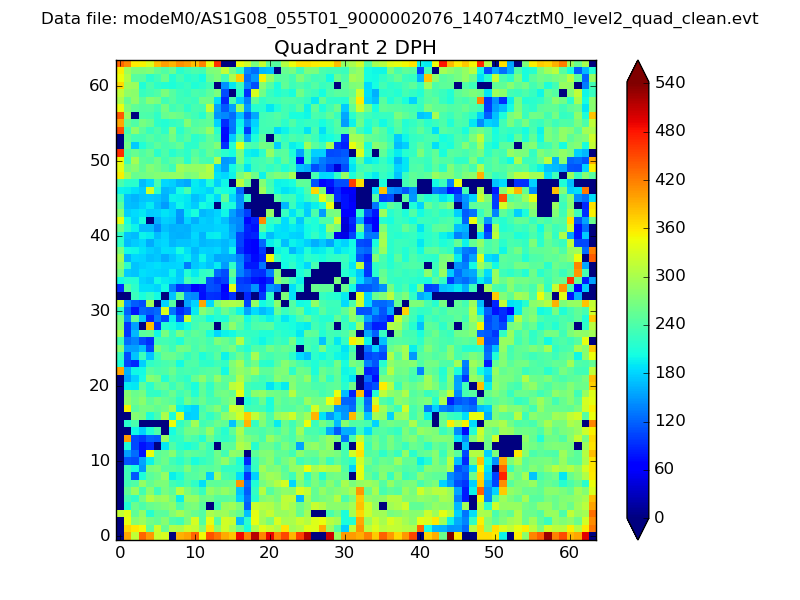
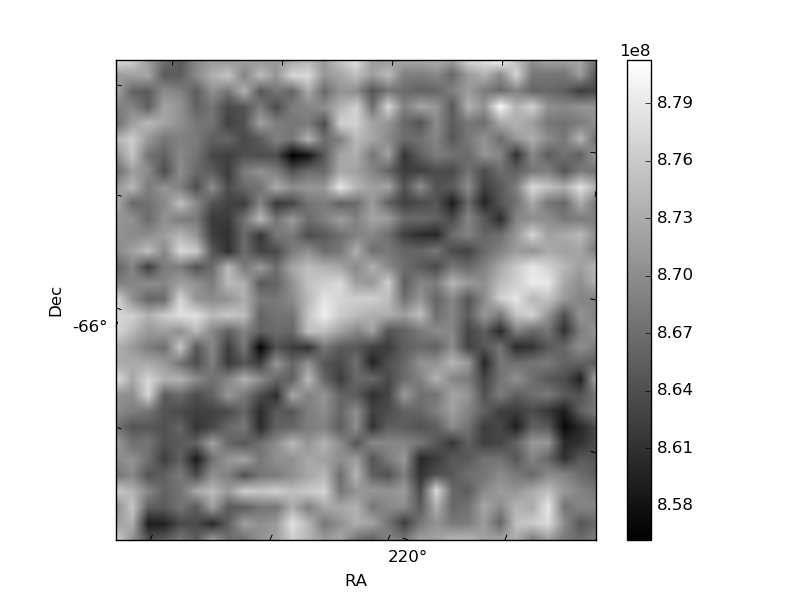
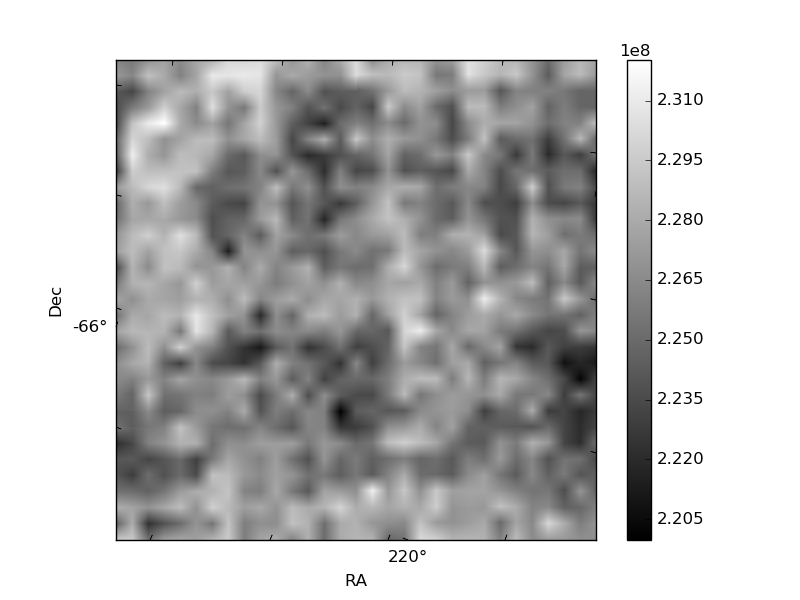
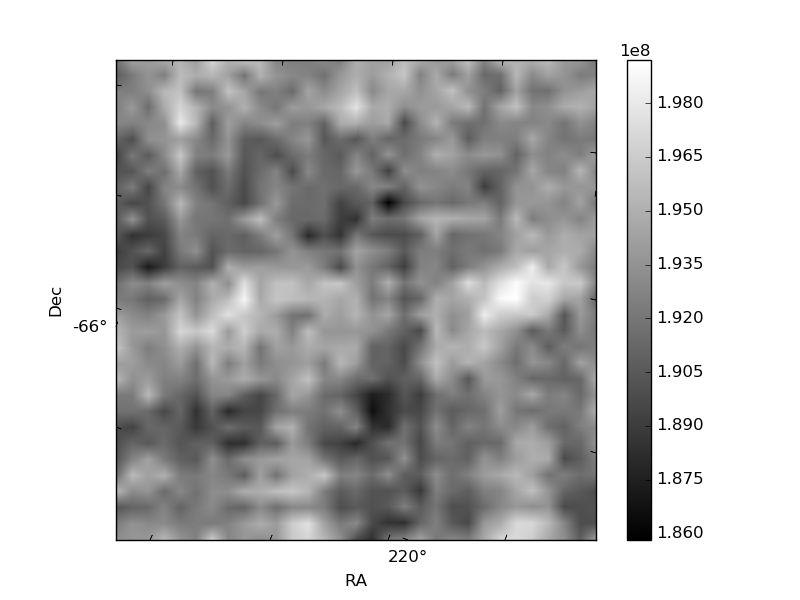
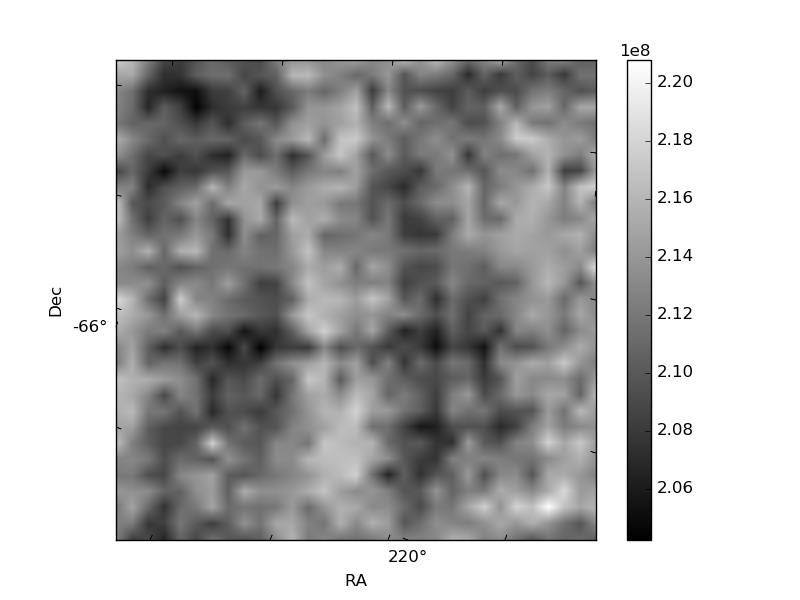
Histogram calculated using DETX and DETY for each event in the final _common_clean file
| Quadrant A | 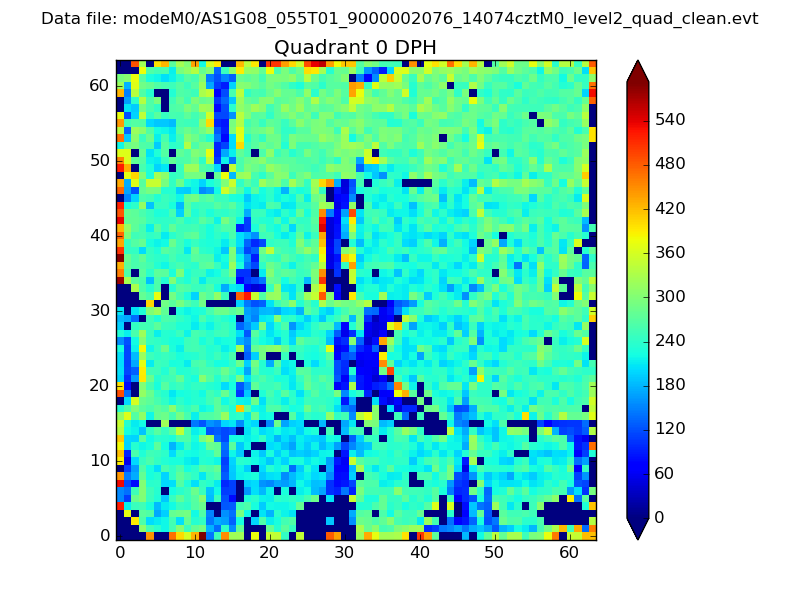 |
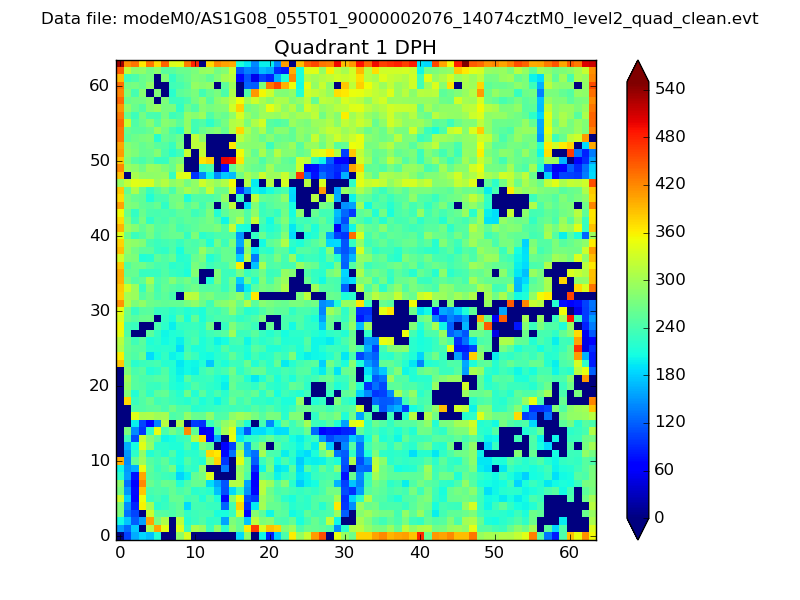 |
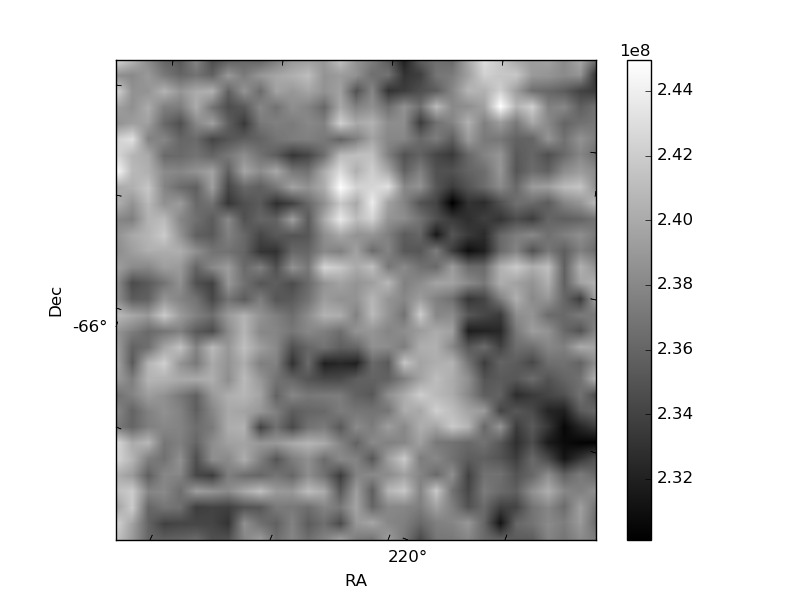
Quadrant B |
|---|---|---|---|
| Quadrant D | 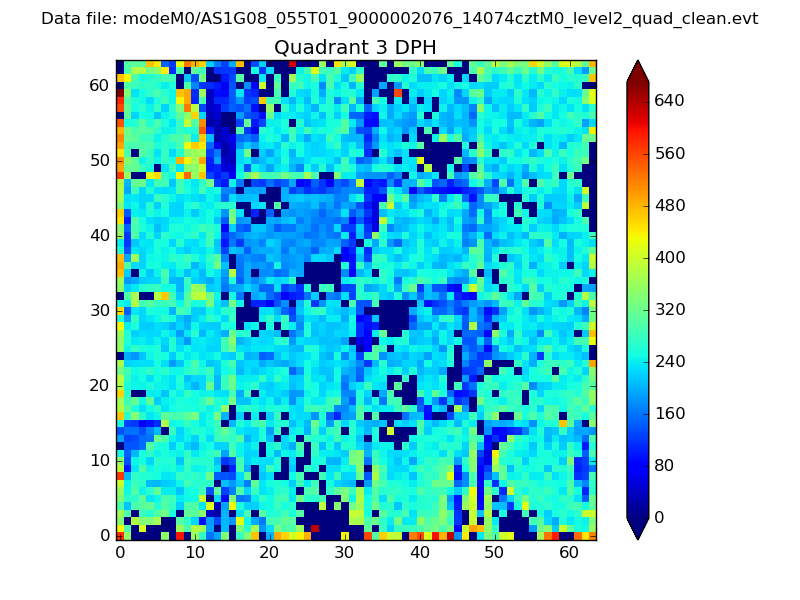 |
 |
Quadrant C |
| Plot type | Count rate plots | Images |
|---|---|---|
| Comparison with Poisson distribution Blue bars denote a histogram of data divided into 1 sec bins. Red curve is a Poisson curve with rate = median count rate of data. |
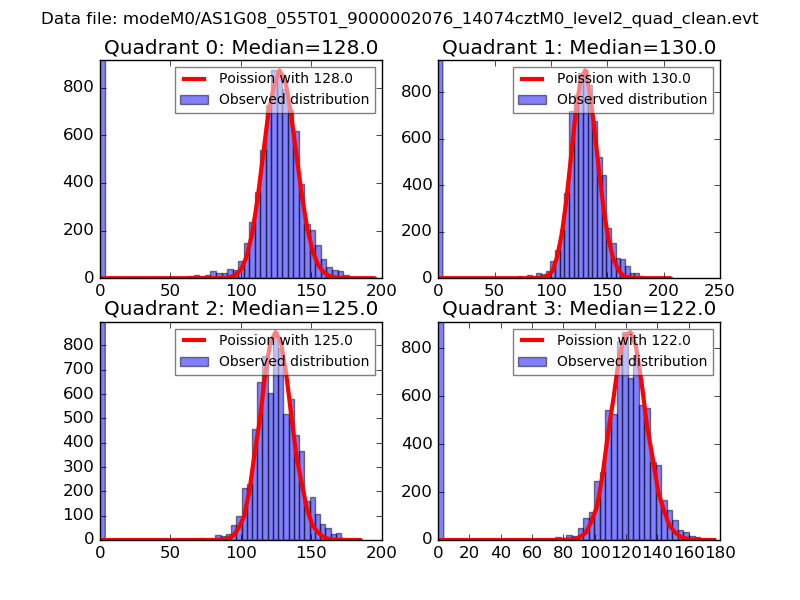 |
 |
| Quadrant-wise count rates Data is divided into 100 sec bins |
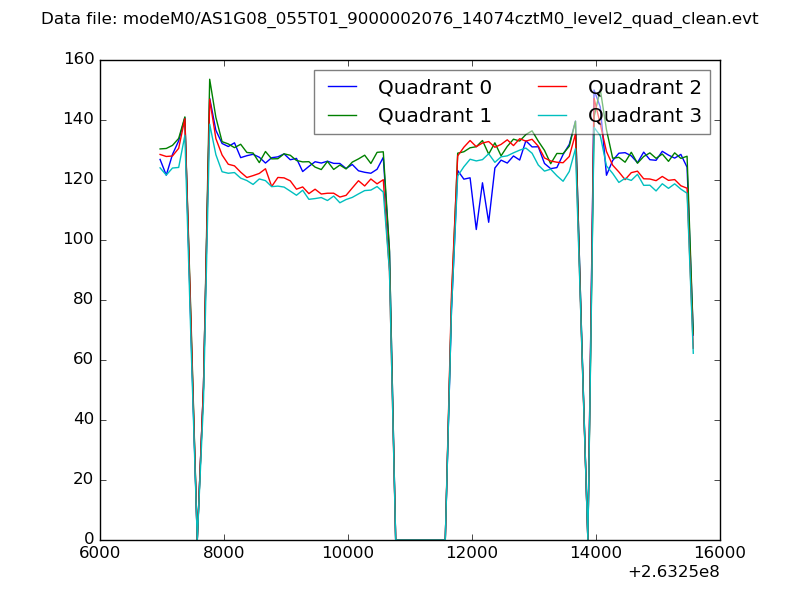 |
|
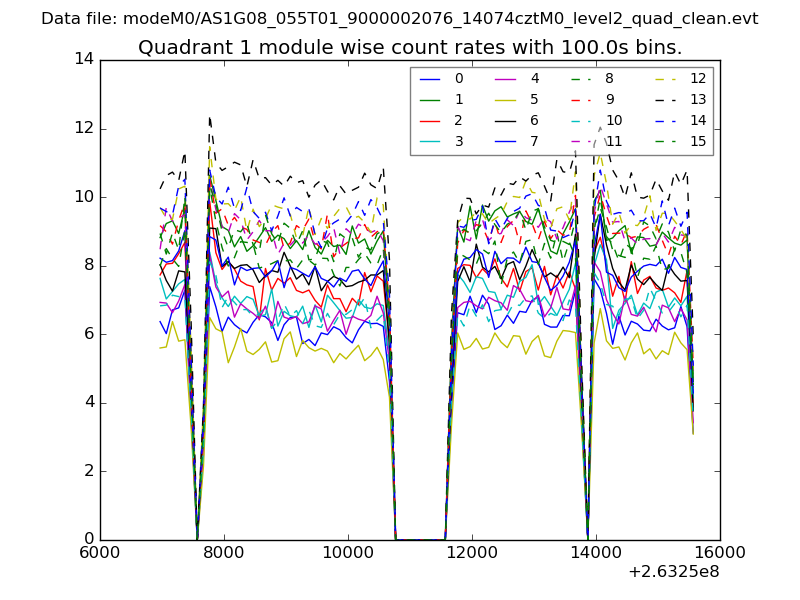
| Module-wise count rates for Quadrant A Data is divided into 100 sec bins |
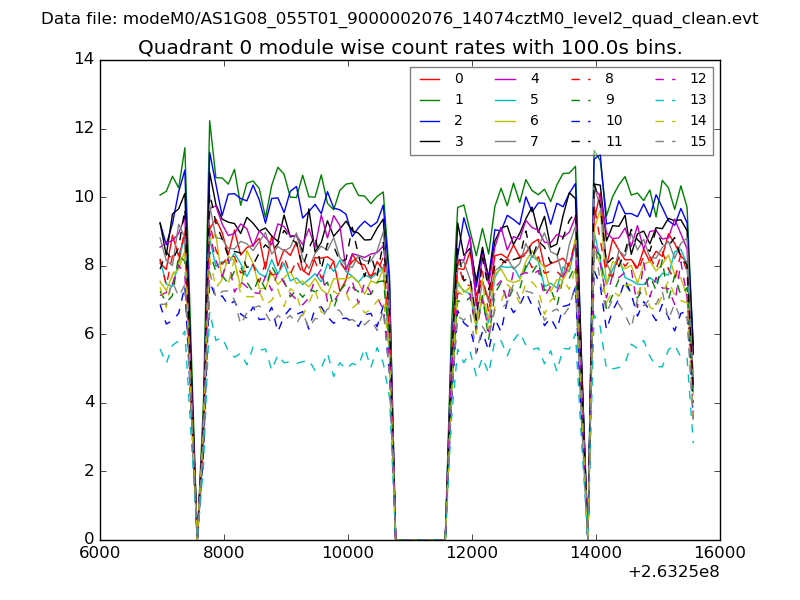 |
 |
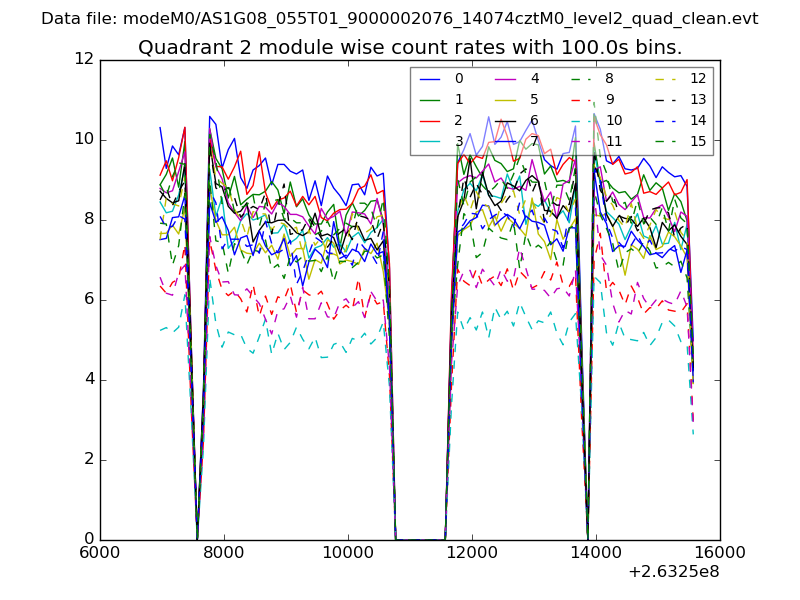
| Module-wise count rates for Quadrant B Data is divided into 100 sec bins |
 |
 |
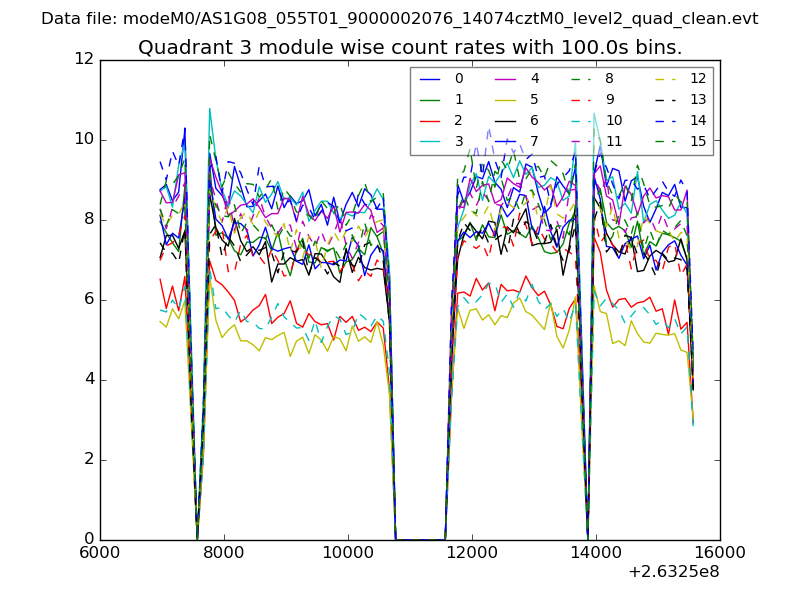
| Module-wise count rates for Quadrant C Data is divided into 100 sec bins |
 |
 |
| Module-wise count rates for Quadrant D Data is divided into 100 sec bins |
 |
 |
| Parameter | Plot |
|---|---|
| CZT HV Monitor | 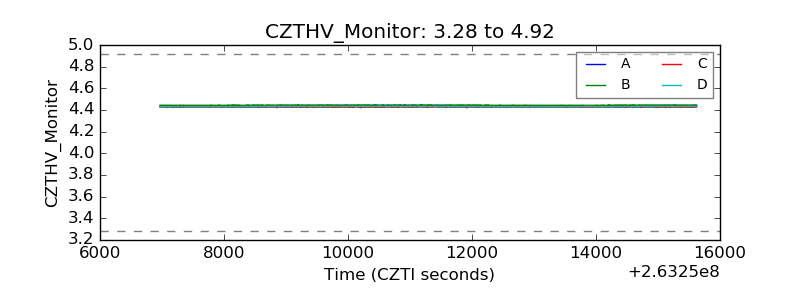 |
| D_VDD | 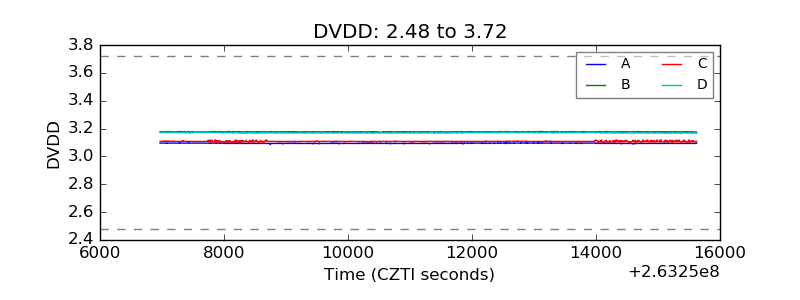 |
| Temperature 1 | 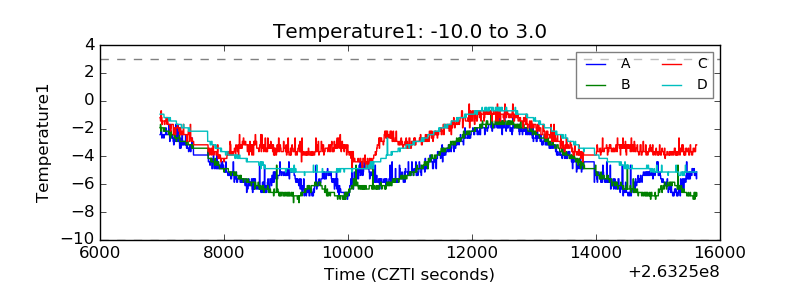 |
| Veto HV Monitor | 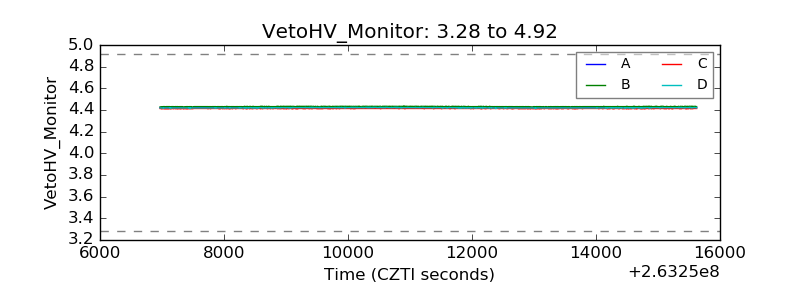 |
| Veto LLD | 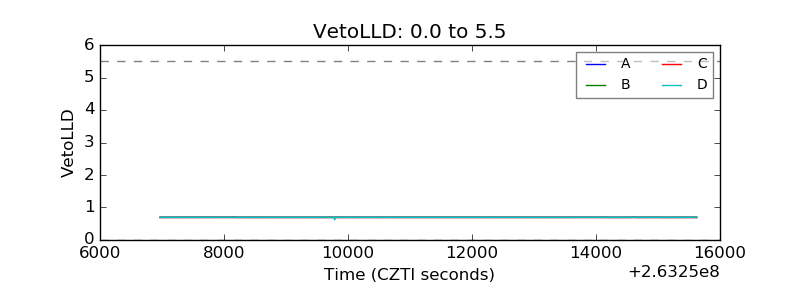 |
| Alpha Counter |  |
| _CPM_Rate | 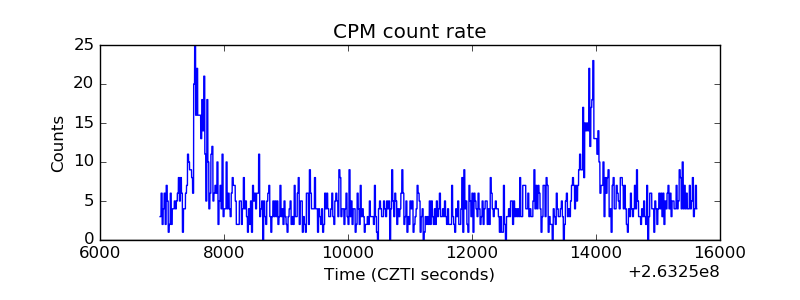 |
| CZT Counter | 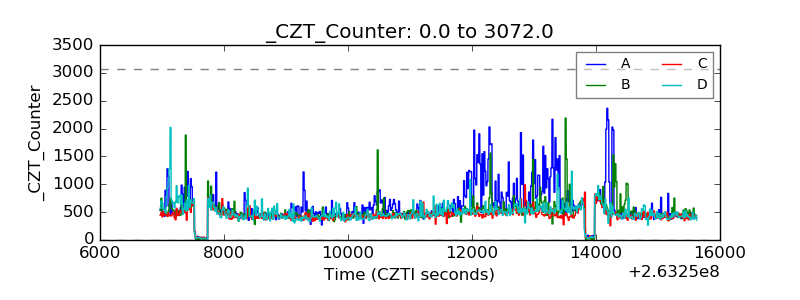 |
| +2.5 Volts monitor |  |
| +5 Volts monitor |  |
| _ROLL_ROT | 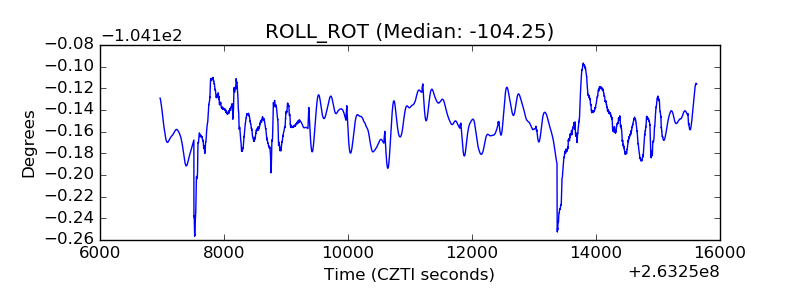 |
| _Roll_DEC | 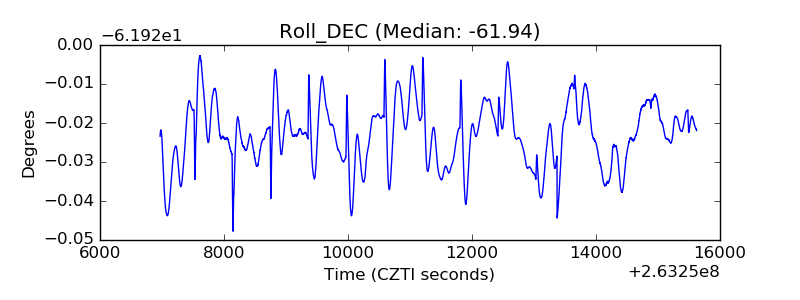 |
| _Roll_RA | 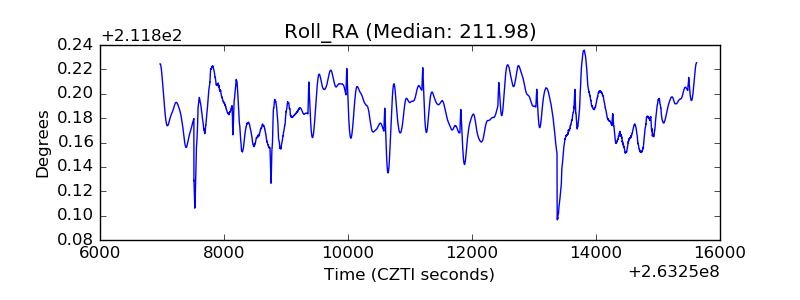 |
| Veto Counter | 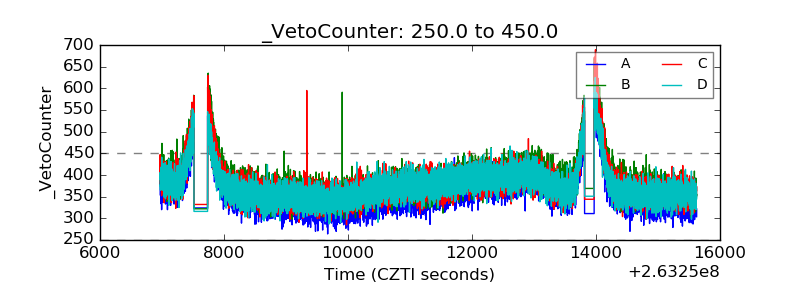 |