| Param | Original file | Final file |
|---|---|---|
| Filename | modeM0/AS1G08_055T01_9000002076_14080cztM0_level2.evt | modeM0/AS1G08_055T01_9000002076_14080cztM0_level2_quad_clean.evt |
| Size (bytes) | 495,806,400 | 92,609,280 |
| Size | 472.8 MB | 88.3 MB |
| Events in quadrant A | 3,428,461 | 601,997 |
| Events in quadrant B | 4,357,211 | 592,607 |
| Events in quadrant C | 3,067,244 | 592,861 |
| Events in quadrant D | 3,725,435 | 567,740 |
| Mode M9 | |||
|---|---|---|---|
| Quadrant | BADHDUFLAG | Total packets | Discarded packets |
| A | 0 | 11 | 0 |
| B | 0 | 11 | 0 |
| C | 0 | 11 | 0 |
| D | 0 | 11 | 0 |
| Mode SS | |||
|---|---|---|---|
| Quadrant | BADHDUFLAG | Total packets | Discarded packets |
| A | 0 | 130 | 0 |
| B | 0 | 130 | 0 |
| C | 0 | 130 | 0 |
| D | 0 | 130 | 0 |
| Mode M0 | |||
|---|---|---|---|
| Quadrant | BADHDUFLAG | Total packets | Discarded packets |
| A | 0 | 14218 | 2 |
| B | 0 | 17004 | 1 |
| C | 0 | 13399 | 1 |
| D | 0 | 15115 | 1 |
| Quadrant | Total seconds | Saturated seconds | Saturation percentage |
|---|---|---|---|
| A | 6442 | 63 | 0.977957% |
| B | 6442 | 306 | 4.750078% |
| C | 6442 | 44 | 0.683018% |
| D | 6442 | 157 | 2.437131% |
Noise dominated data is calculated using 1-second bins in cleaned event files. If a bin has >2000 counts, and if more than 50% of those come from <1% of pixels, then it is considered to be noise-dominated and hence unusable.
| Quadrant | # 1 sec bins | Bins with >0 counts | Bins with >2000 counts | High rate bins dominated by noise | Noise dominated (total time) | Noise dominated (detector-on time) | Marked lightcurve |
|---|---|---|---|---|---|---|---|
| A | 7518 | 6444 | 5 | 5 | 0.07% | 0.08% |  |
| B | 7518 | 6444 | 125 | 125 | 1.66% | 1.94% |  |
| C | 7518 | 6444 | 0 | 0 | 0.00% | 0.00% |  |
| D | 7518 | 6444 | 79 | 79 | 1.05% | 1.23% |  |
Top three noisy pixels from each quadrant. If the there are fewer than three noisy pixels in the level2.evt file, extra rows are filled as -1
| Pixel properties | Quadrant properties | ||||||
|---|---|---|---|---|---|---|---|
| Quadrant | DetID | PixID | Counts | Sigma | Mean | Median | Sigma |
| A | 15 | 222 | 224548 | 1399.09 | 801 | 785 | 159.9 |
| A | 12 | 189 | 96187 | 596.5 | 801 | 785 | 159.9 |
| A | 9 | 143 | 19476 | 116.87 | 801 | 785 | 159.9 |
| B | 10 | 16 | 1041956 | 7118.25 | 788 | 770 | 146.3 |
| B | 10 | 245 | 51527 | 347.01 | 788 | 770 | 146.3 |
| B | 4 | 173 | 42417 | 284.73 | 788 | 770 | 146.3 |
| C | 3 | 233 | 33057 | 181.72 | 776 | 778 | 177.6 |
| C | 0 | 207 | 8309 | 42.4 | 776 | 778 | 177.6 |
| C | 13 | 61 | 5626 | 27.29 | 776 | 778 | 177.6 |
| D | 10 | 157 | 288724 | 1557.81 | 768 | 749 | 184.9 |
| D | 8 | 195 | 215710 | 1162.84 | 768 | 749 | 184.9 |
| D | 2 | 152 | 112802 | 606.16 | 768 | 749 | 184.9 |
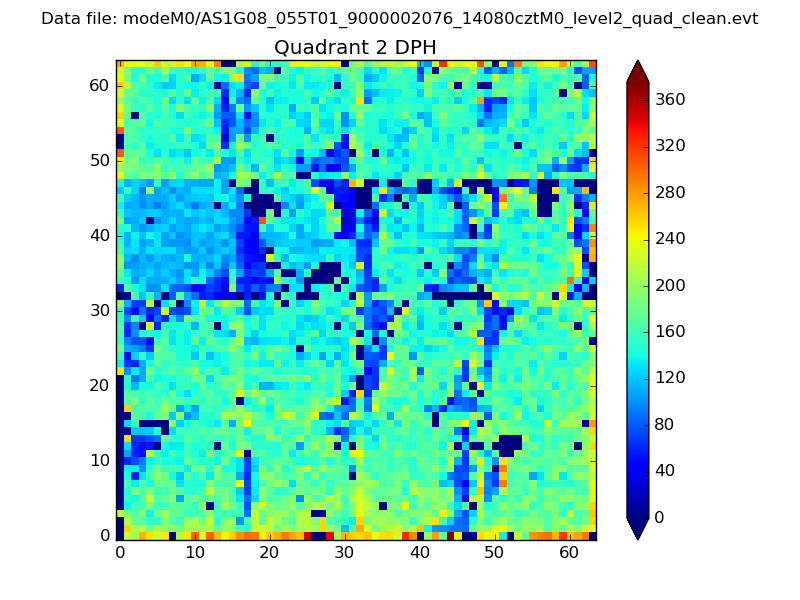
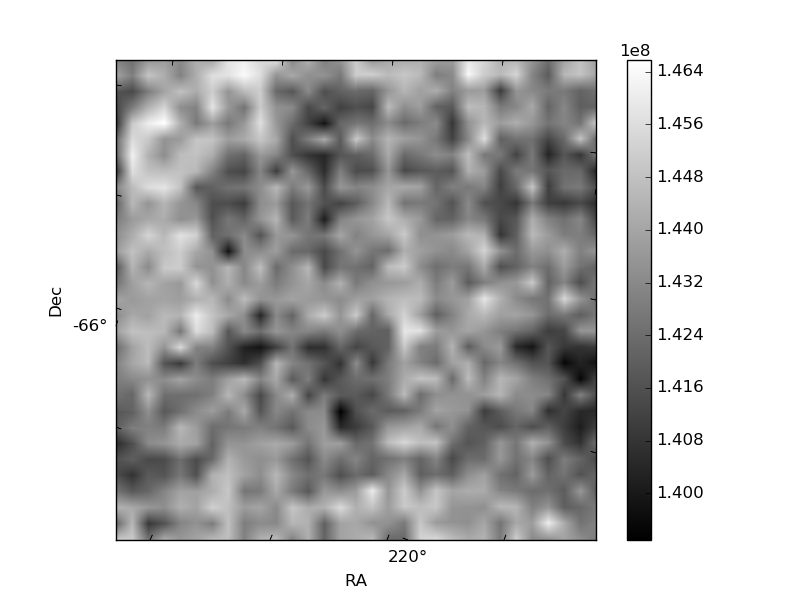
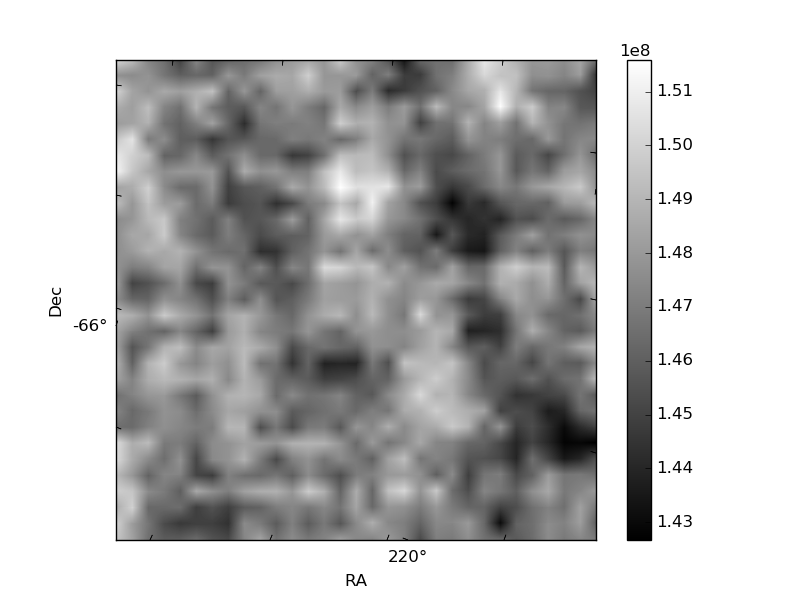
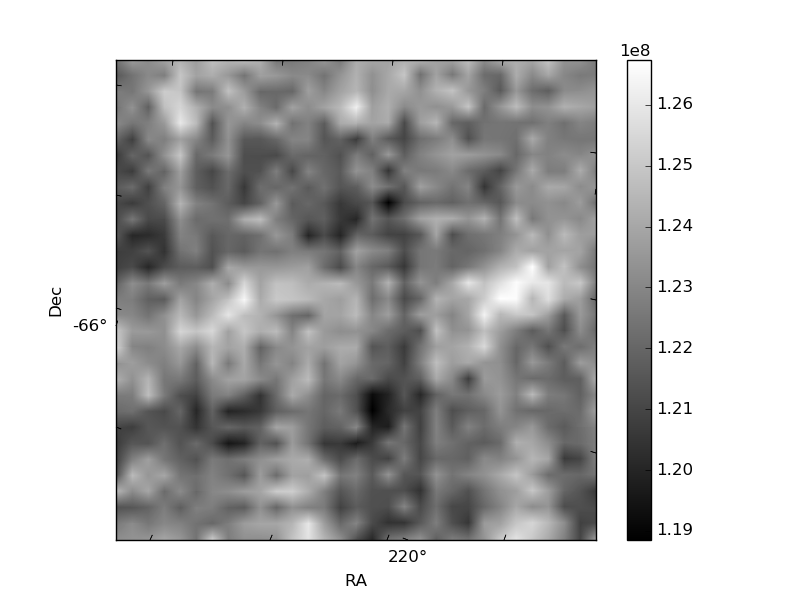
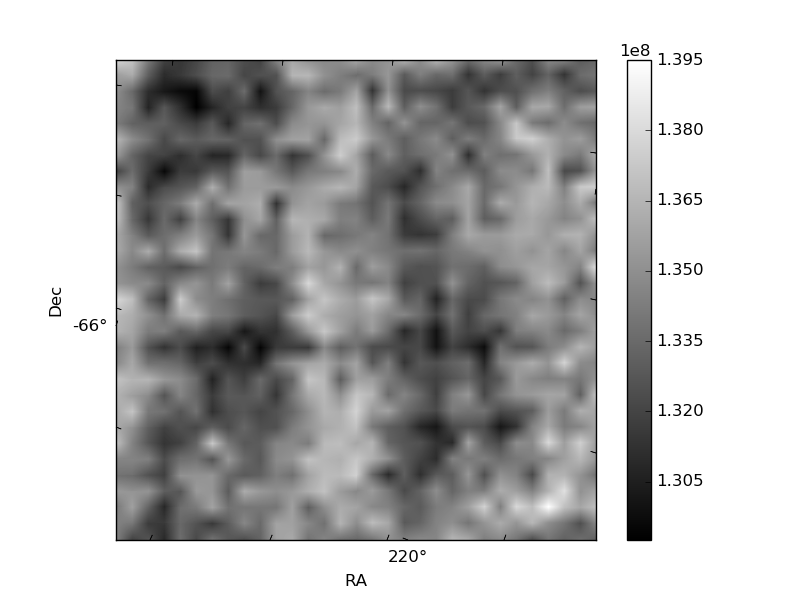
Histogram calculated using DETX and DETY for each event in the final _common_clean file
| Quadrant A | 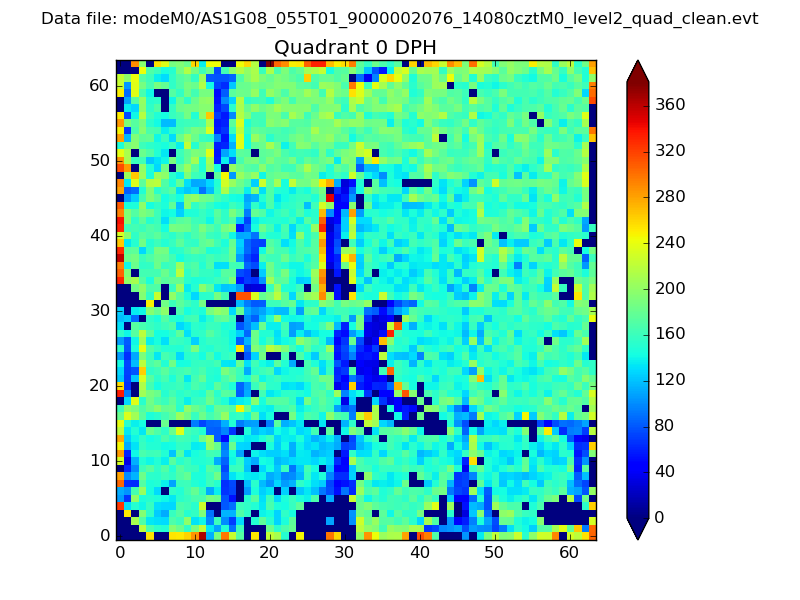 |
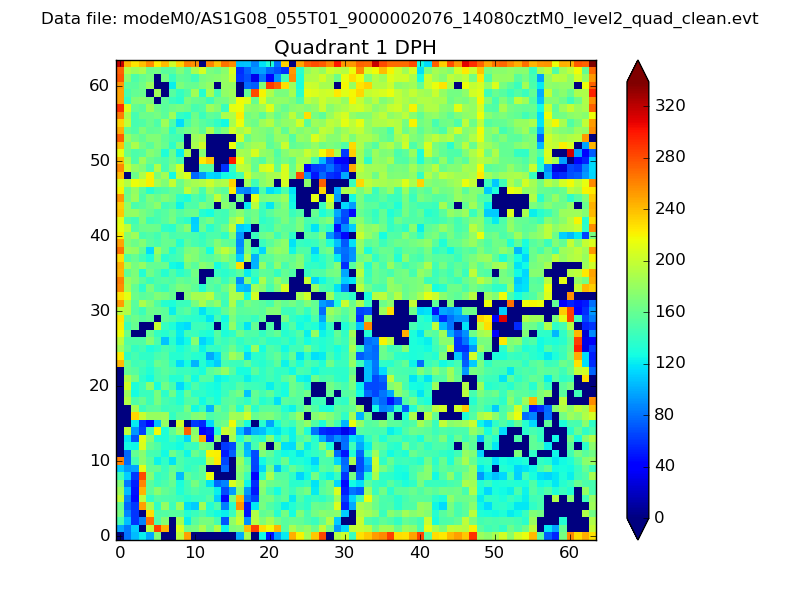 |
Quadrant B |
|---|---|---|---|
| Quadrant D | 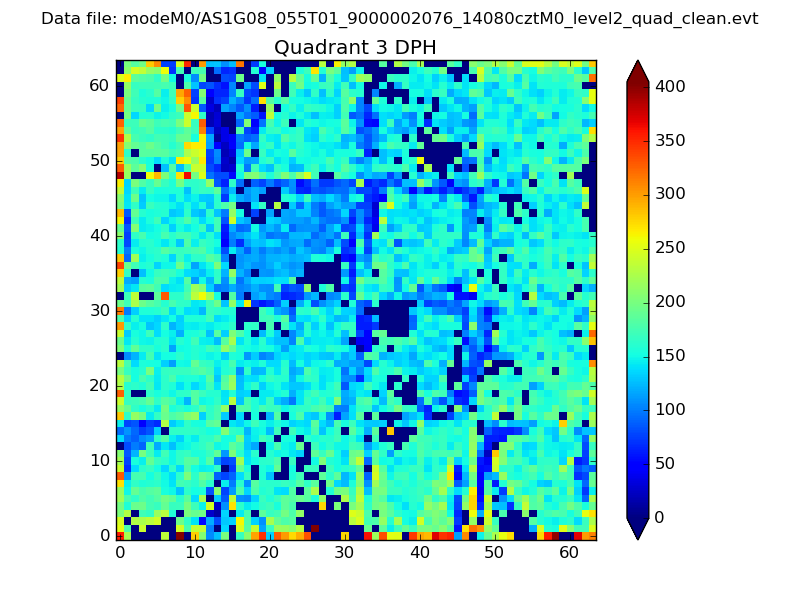 |
 |
Quadrant C |
| Plot type | Count rate plots | Images |
|---|---|---|
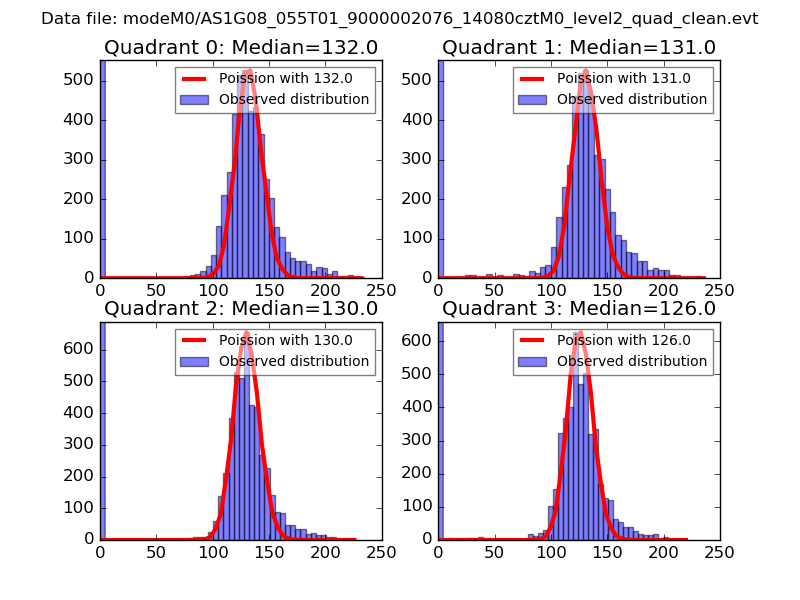
| Comparison with Poisson distribution Blue bars denote a histogram of data divided into 1 sec bins. Red curve is a Poisson curve with rate = median count rate of data. |
 |
 |
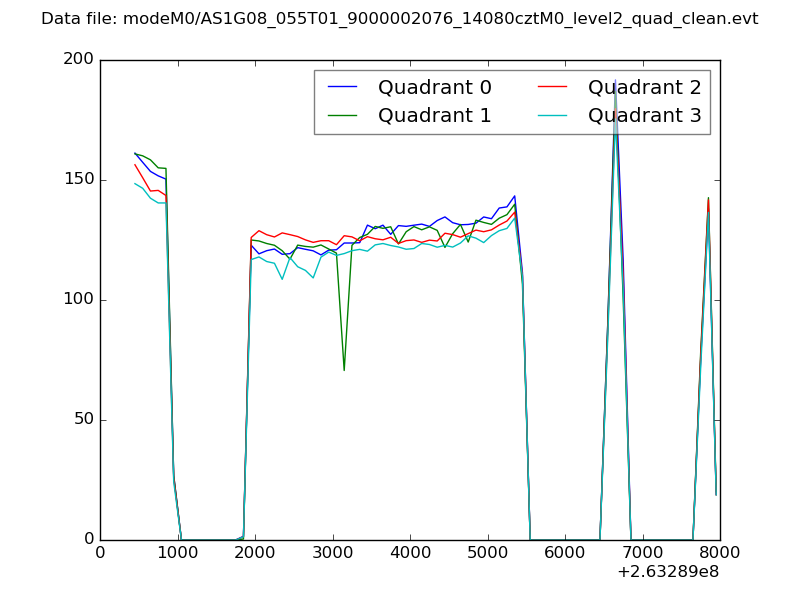
| Quadrant-wise count rates Data is divided into 100 sec bins |
 |
|
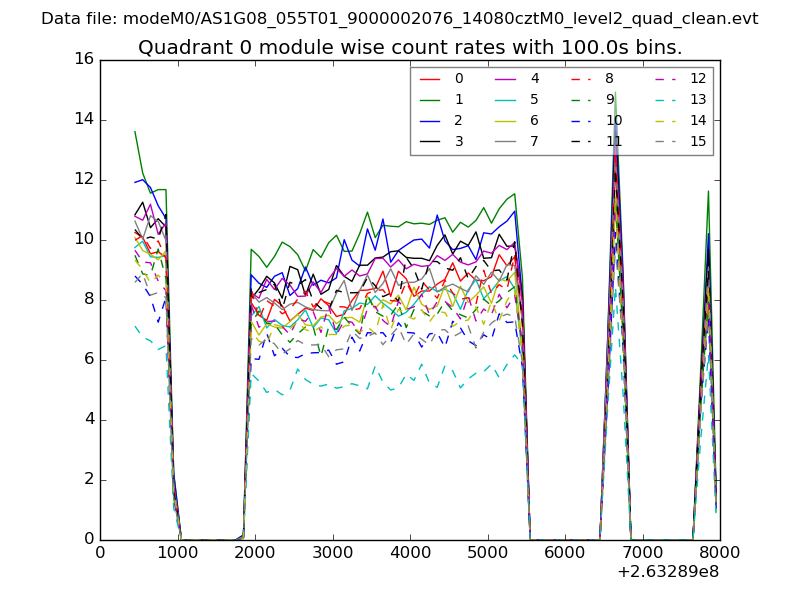
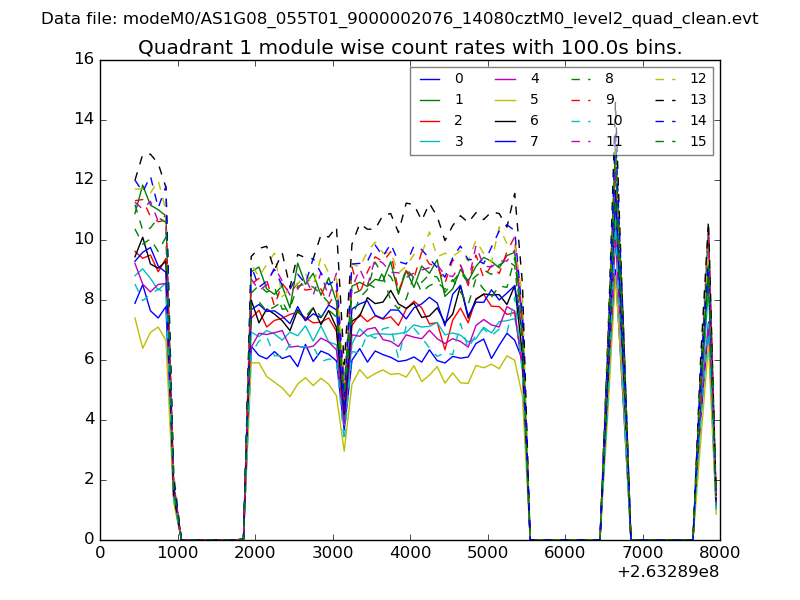
| Module-wise count rates for Quadrant A Data is divided into 100 sec bins |
 |
 |
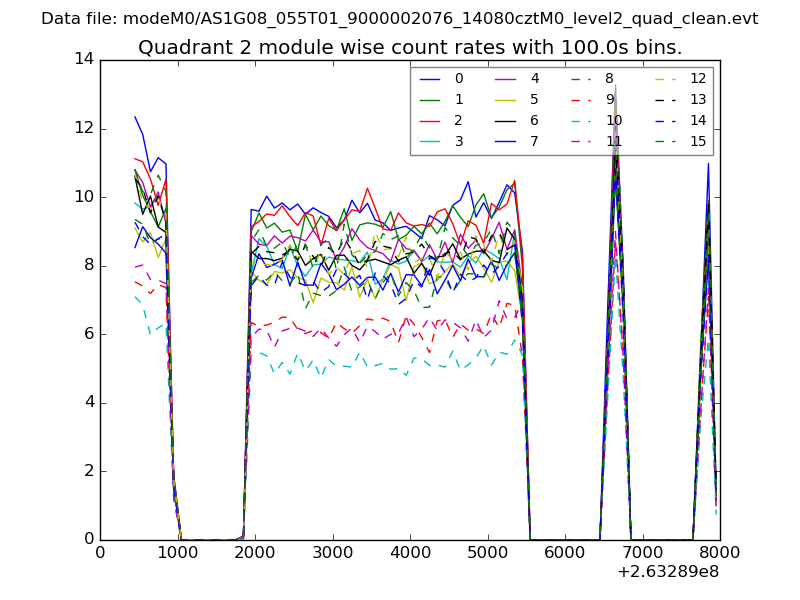
| Module-wise count rates for Quadrant B Data is divided into 100 sec bins |
 |
 |
| Module-wise count rates for Quadrant C Data is divided into 100 sec bins |
 |
 |
| Module-wise count rates for Quadrant D Data is divided into 100 sec bins |
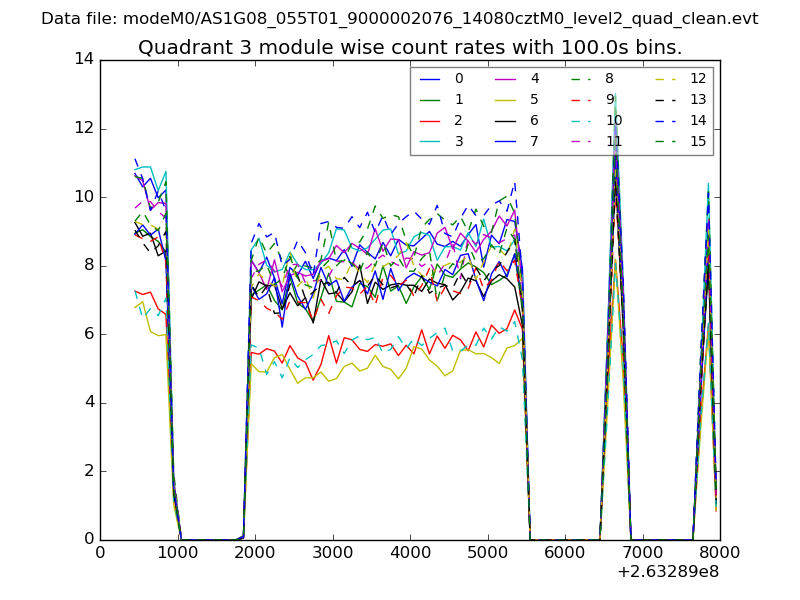 |
 |
| Parameter | Plot |
|---|---|
| CZT HV Monitor | 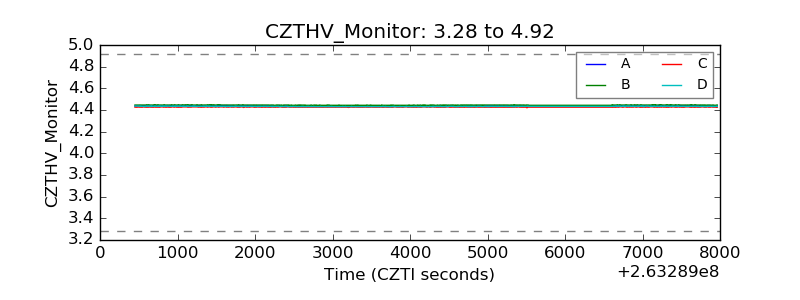 |
| D_VDD | 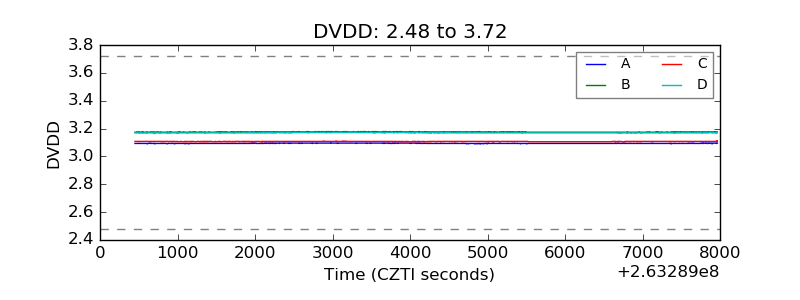 |
| Temperature 1 | 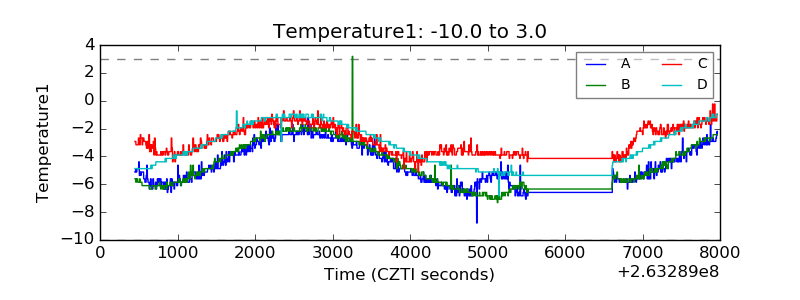 |
| Veto HV Monitor | 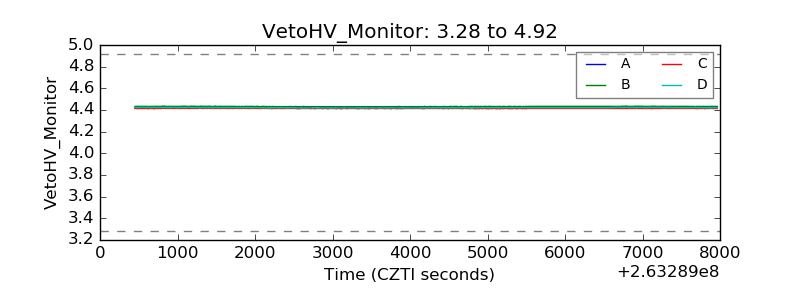 |
| Veto LLD | 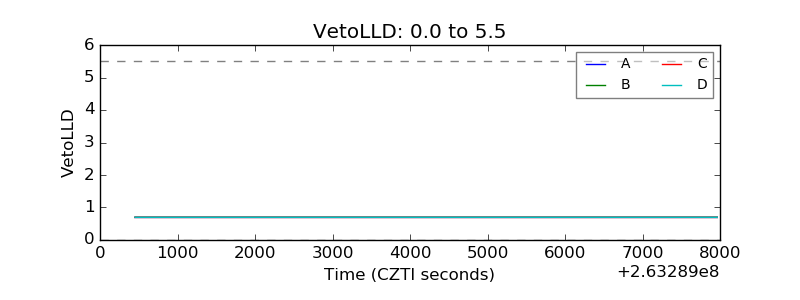 |
| Alpha Counter | 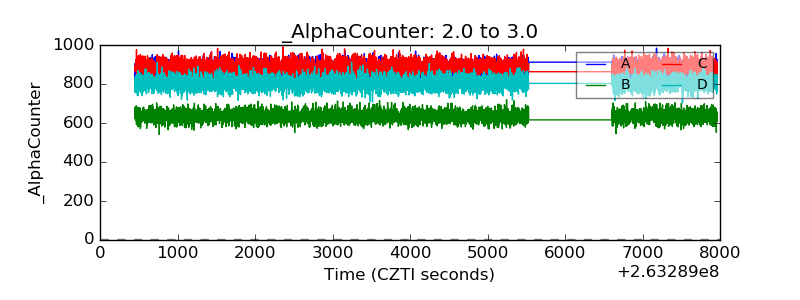 |
| _CPM_Rate | 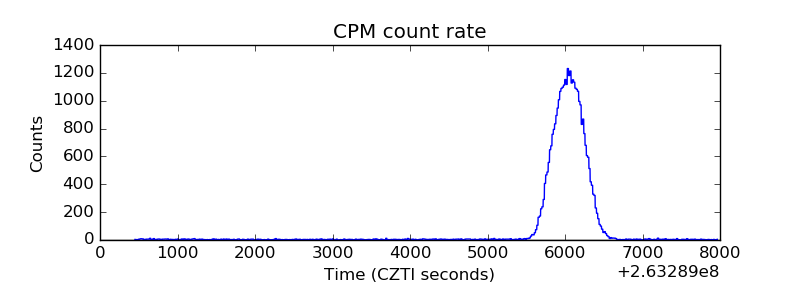 |
| CZT Counter | 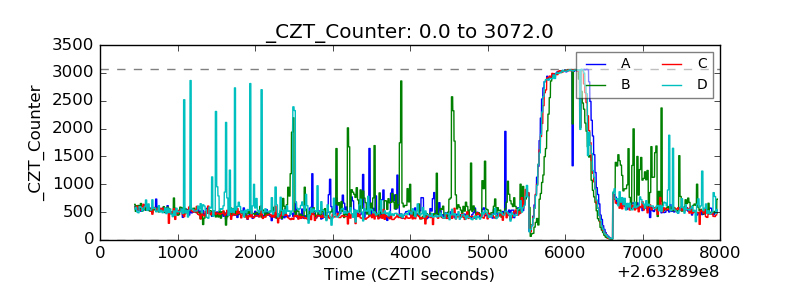 |
| +2.5 Volts monitor | 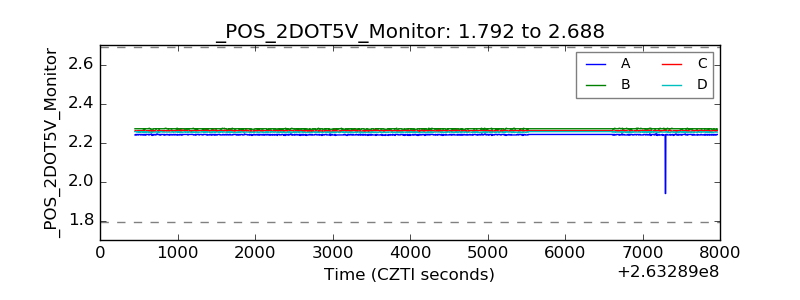 |
| +5 Volts monitor |  |
| _ROLL_ROT | 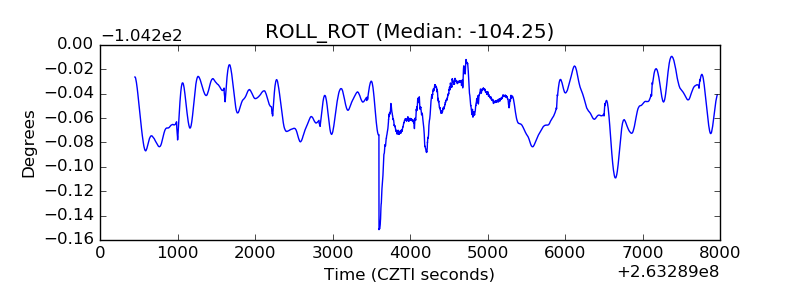 |
| _Roll_DEC | 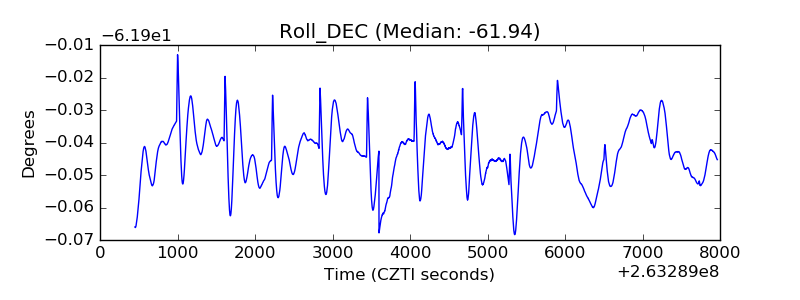 |
| _Roll_RA | 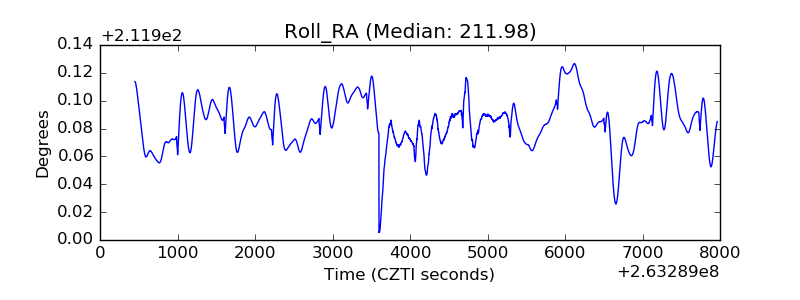 |
| Veto Counter | 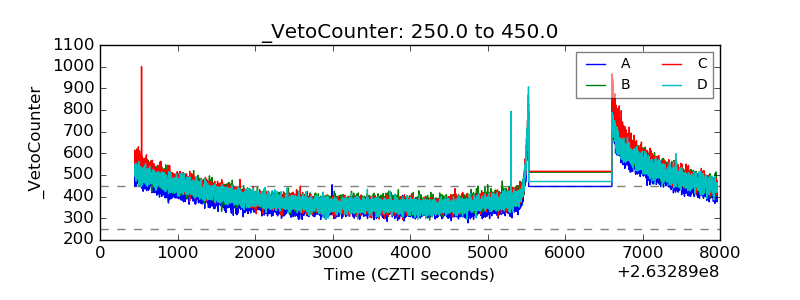 |