| Param | Original file | Final file |
|---|---|---|
| Filename | modeM0/AS1G08_055T01_9000002076_14081cztM0_level2.evt | modeM0/AS1G08_055T01_9000002076_14081cztM0_level2_quad_clean.evt |
| Size (bytes) | 528,511,680 | 90,478,080 |
| Size | 504.0 MB | 86.3 MB |
| Events in quadrant A | 3,611,139 | 592,067 |
| Events in quadrant B | 5,565,616 | 562,806 |
| Events in quadrant C | 3,024,416 | 589,164 |
| Events in quadrant D | 3,391,248 | 569,676 |
| Mode M9 | |||
|---|---|---|---|
| Quadrant | BADHDUFLAG | Total packets | Discarded packets |
| A | 0 | 11 | 0 |
| B | 0 | 11 | 0 |
| C | 0 | 11 | 0 |
| D | 0 | 11 | 0 |
| Mode SS | |||
|---|---|---|---|
| Quadrant | BADHDUFLAG | Total packets | Discarded packets |
| A | 0 | 126 | 0 |
| B | 0 | 126 | 0 |
| C | 0 | 126 | 0 |
| D | 0 | 126 | 0 |
| Mode M0 | |||
|---|---|---|---|
| Quadrant | BADHDUFLAG | Total packets | Discarded packets |
| A | 0 | 14636 | 2 |
| B | 0 | 20603 | 1 |
| C | 0 | 12987 | 1 |
| D | 0 | 14169 | 1 |
| Quadrant | Total seconds | Saturated seconds | Saturation percentage |
|---|---|---|---|
| A | 6094 | 86 | 1.411224% |
| B | 6094 | 823 | 13.505087% |
| C | 6094 | 65 | 1.066623% |
| D | 6094 | 77 | 1.263538% |
Noise dominated data is calculated using 1-second bins in cleaned event files. If a bin has >2000 counts, and if more than 50% of those come from <1% of pixels, then it is considered to be noise-dominated and hence unusable.
| Quadrant | # 1 sec bins | Bins with >0 counts | Bins with >2000 counts | High rate bins dominated by noise | Noise dominated (total time) | Noise dominated (detector-on time) | Marked lightcurve |
|---|---|---|---|---|---|---|---|
| A | 7270 | 6096 | 6 | 6 | 0.08% | 0.10% | 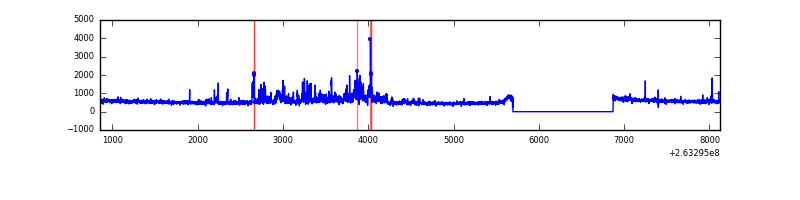 |
| B | 7270 | 6096 | 495 | 495 | 6.81% | 8.12% | 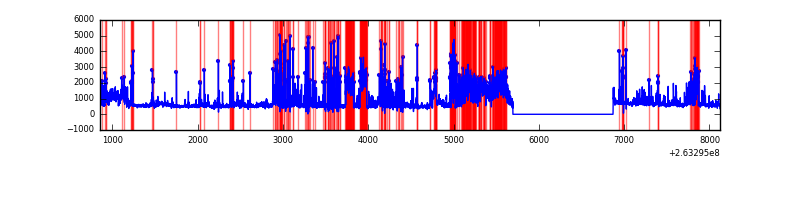 |
| C | 7270 | 6096 | 3 | 3 | 0.04% | 0.05% | 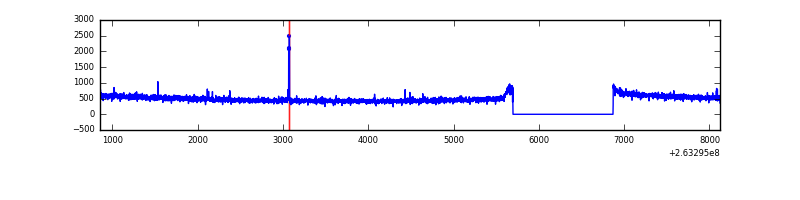 |
| D | 7270 | 6096 | 9 | 9 | 0.12% | 0.15% | 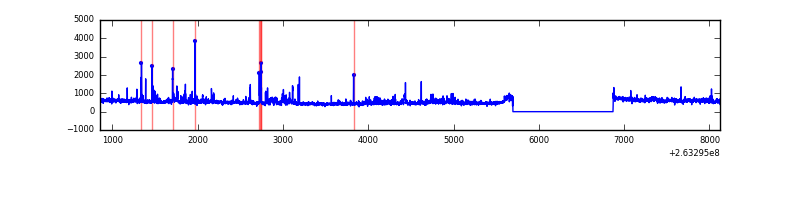 |
Top three noisy pixels from each quadrant. If the there are fewer than three noisy pixels in the level2.evt file, extra rows are filled as -1
| Pixel properties | Quadrant properties | ||||||
|---|---|---|---|---|---|---|---|
| Quadrant | DetID | PixID | Counts | Sigma | Mean | Median | Sigma |
| A | 15 | 222 | 290761 | 1877.43 | 782 | 769 | 154.5 |
| A | 8 | 15 | 150704 | 970.69 | 782 | 769 | 154.5 |
| A | 12 | 189 | 84025 | 539.01 | 782 | 769 | 154.5 |
| B | 10 | 16 | 2346258 | 17097.25 | 748 | 731 | 137.2 |
| B | 3 | 209 | 100532 | 727.48 | 748 | 731 | 137.2 |
| B | 0 | 189 | 39996 | 286.21 | 748 | 731 | 137.2 |
| C | 3 | 233 | 61124 | 353.06 | 754 | 759 | 171.0 |
| C | 0 | 207 | 23305 | 131.87 | 754 | 759 | 171.0 |
| C | 13 | 61 | 5445 | 27.41 | 754 | 759 | 171.0 |
| D | 2 | 152 | 138686 | 775.66 | 755 | 738 | 177.8 |
| D | 8 | 195 | 112428 | 628.01 | 755 | 738 | 177.8 |
| D | 1 | 52 | 94211 | 525.58 | 755 | 738 | 177.8 |
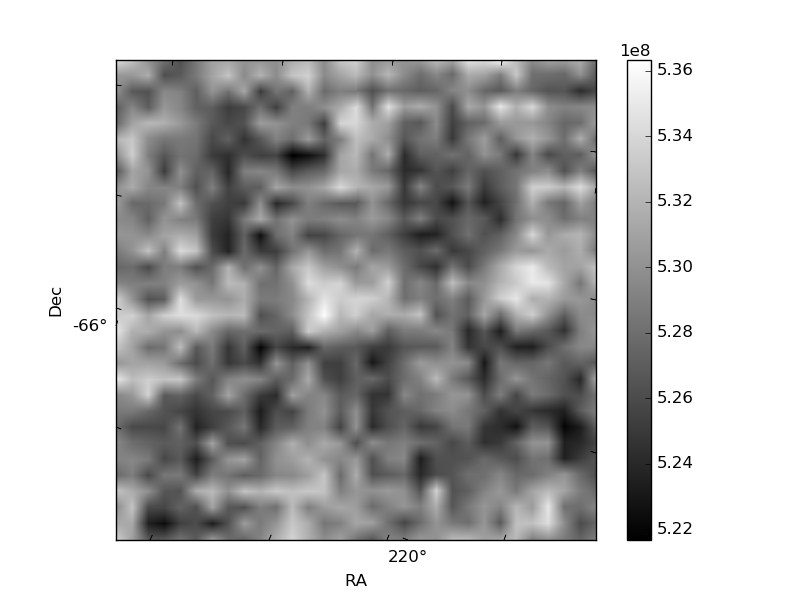
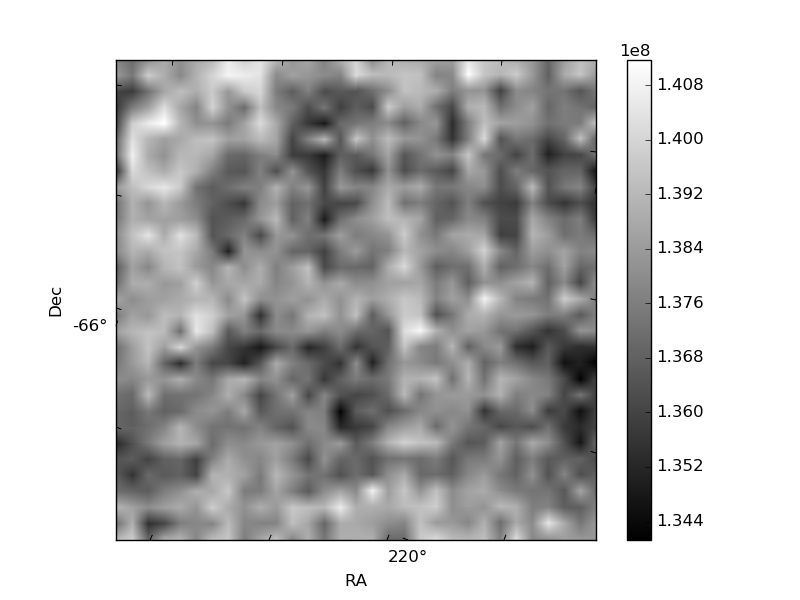
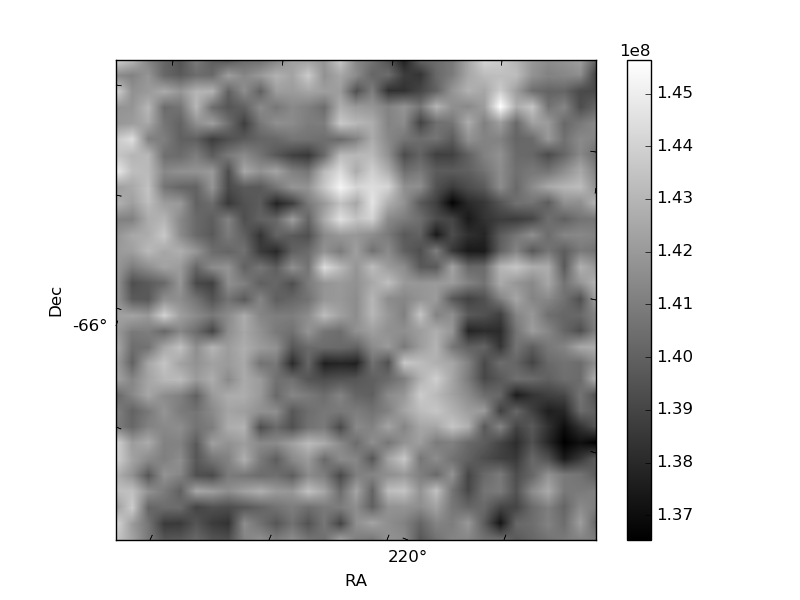
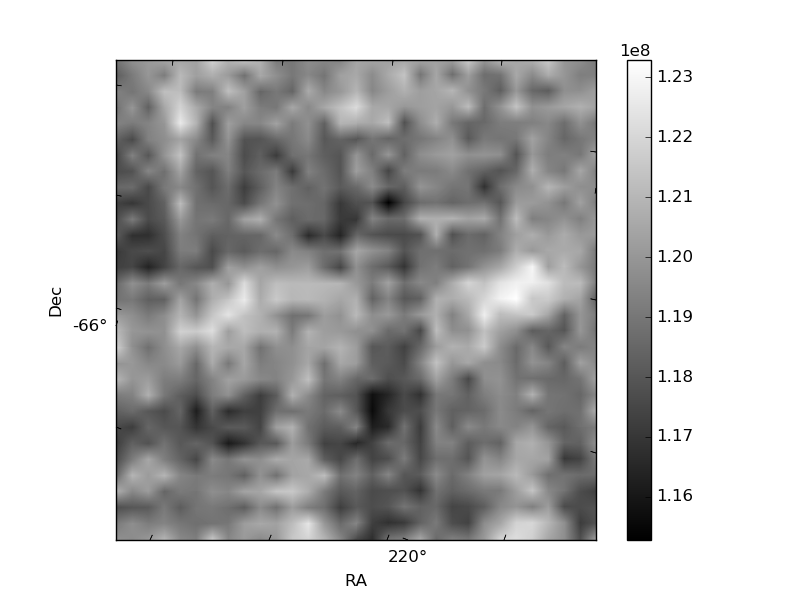
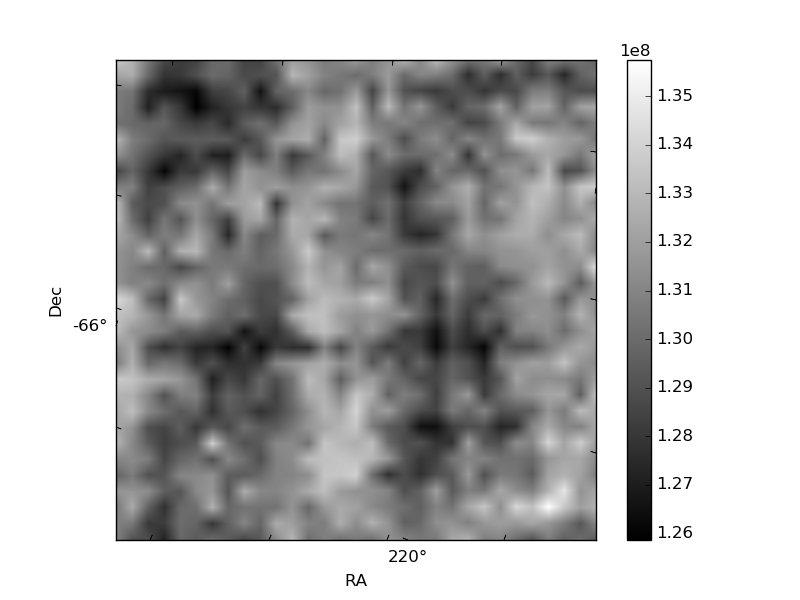
Histogram calculated using DETX and DETY for each event in the final _common_clean file
| Quadrant A | 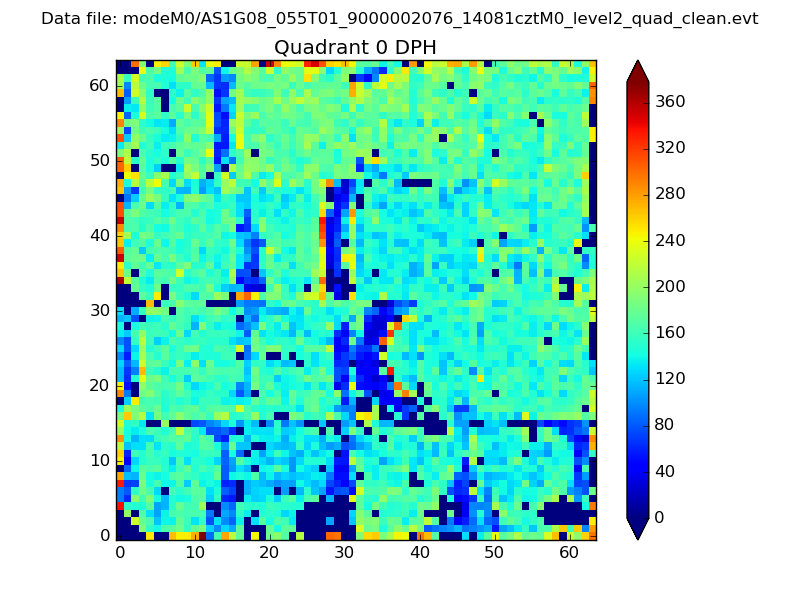 |
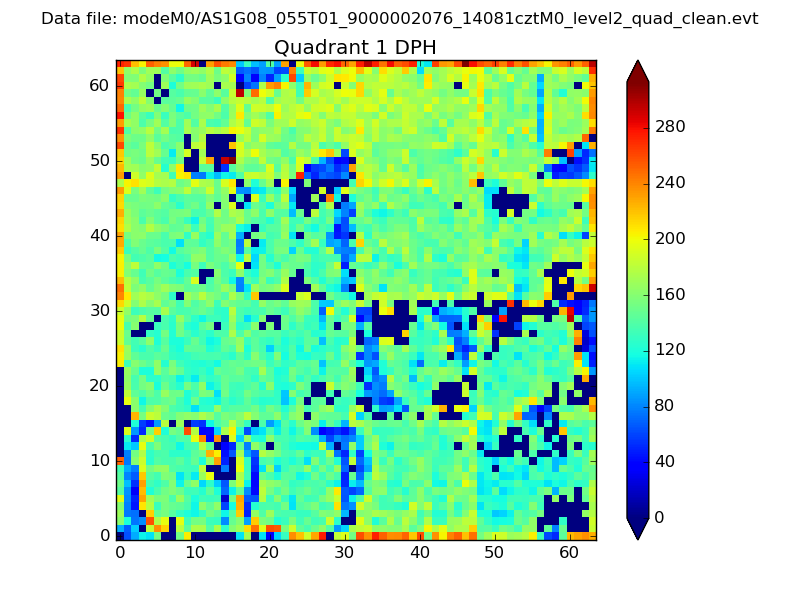 |
Quadrant B |
|---|---|---|---|
| Quadrant D | 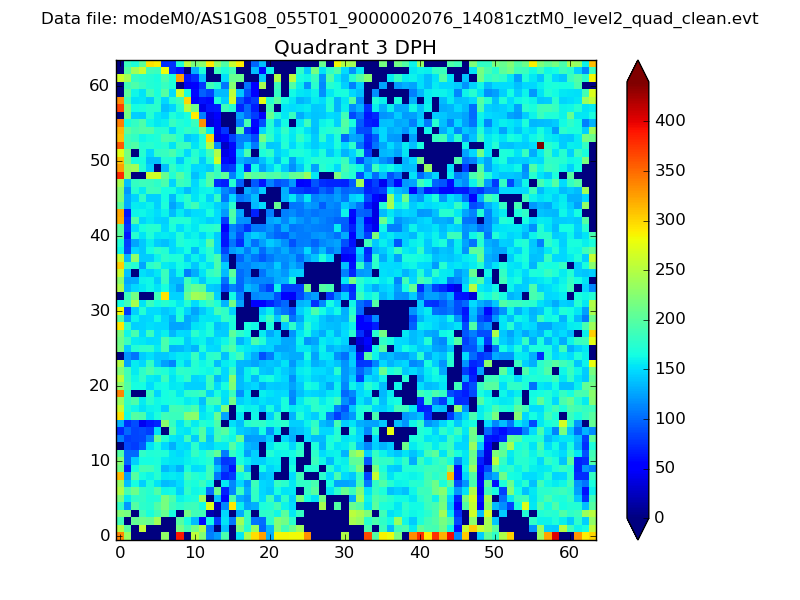 |
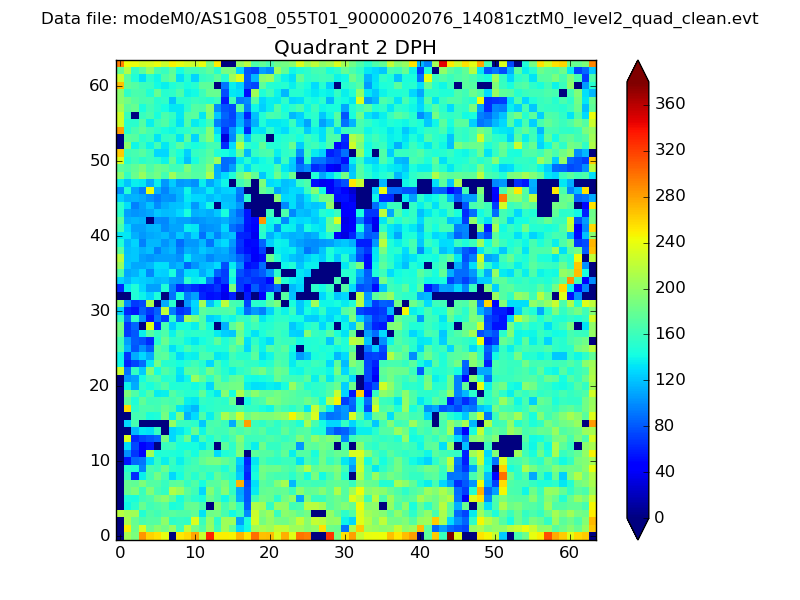 |
Quadrant C |
| Plot type | Count rate plots | Images |
|---|---|---|
| Comparison with Poisson distribution Blue bars denote a histogram of data divided into 1 sec bins. Red curve is a Poisson curve with rate = median count rate of data. |
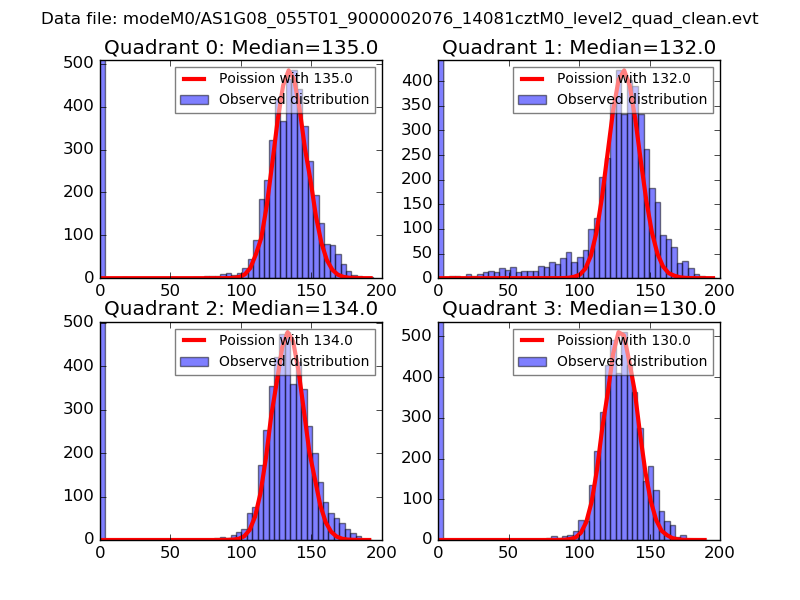 |
 |
| Quadrant-wise count rates Data is divided into 100 sec bins |
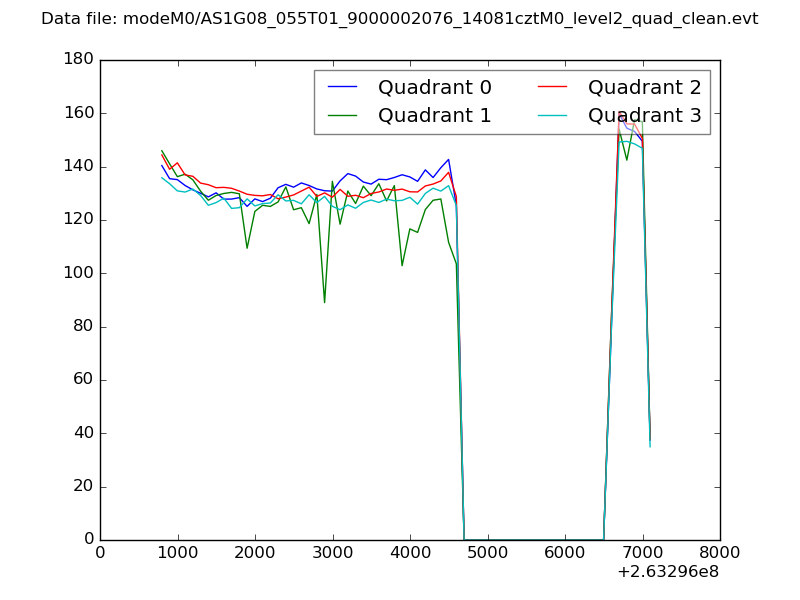 |
|
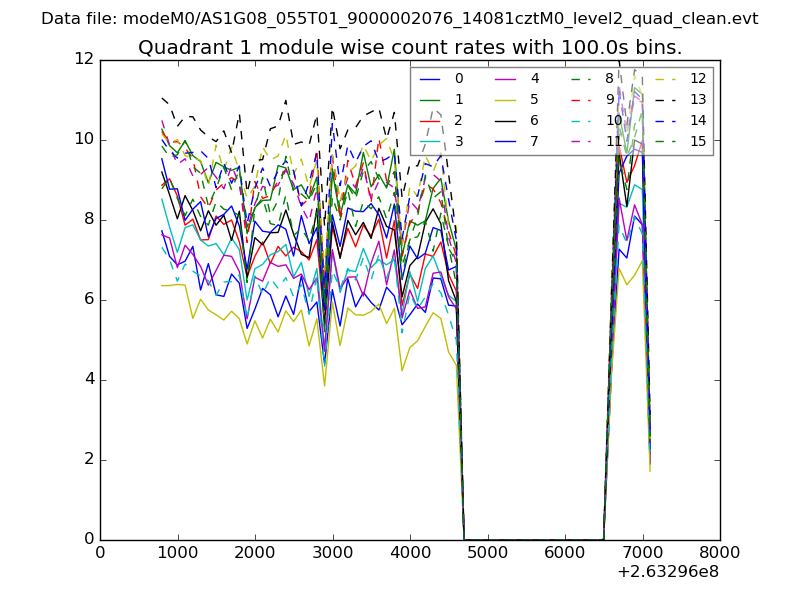
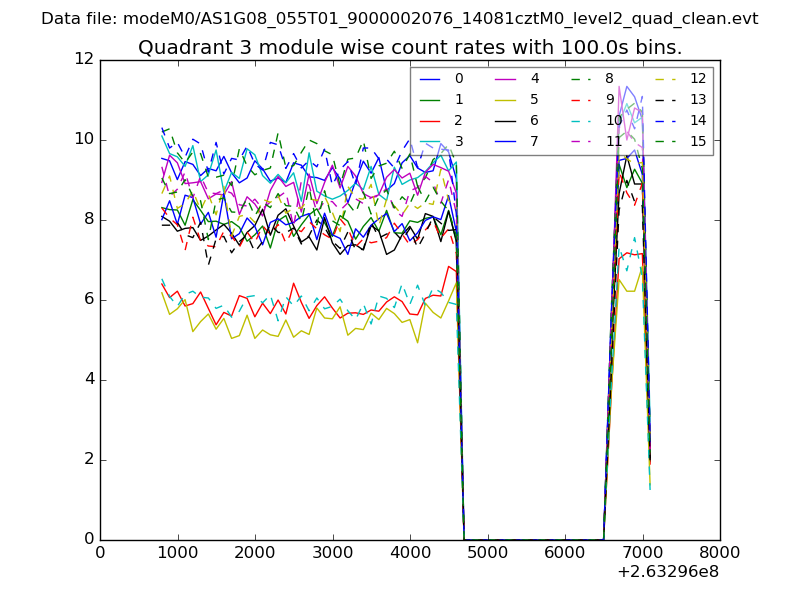
| Module-wise count rates for Quadrant A Data is divided into 100 sec bins |
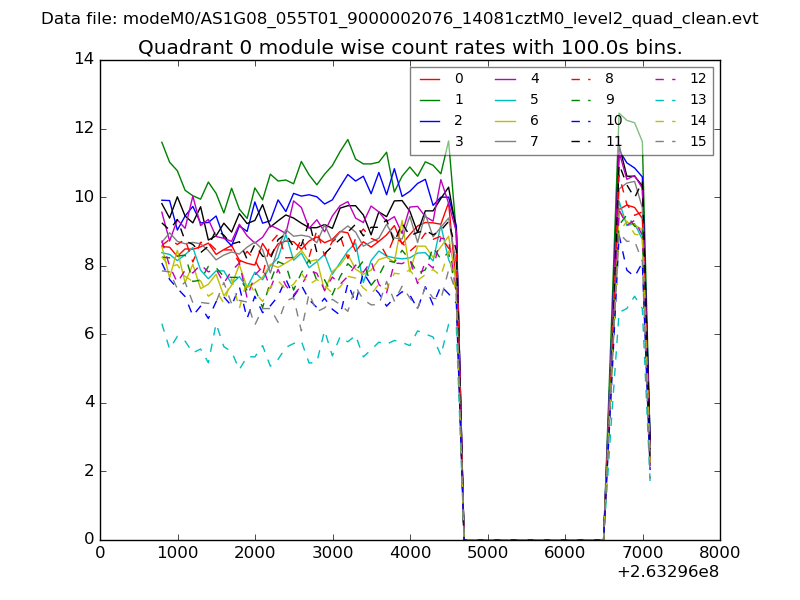 |
 |
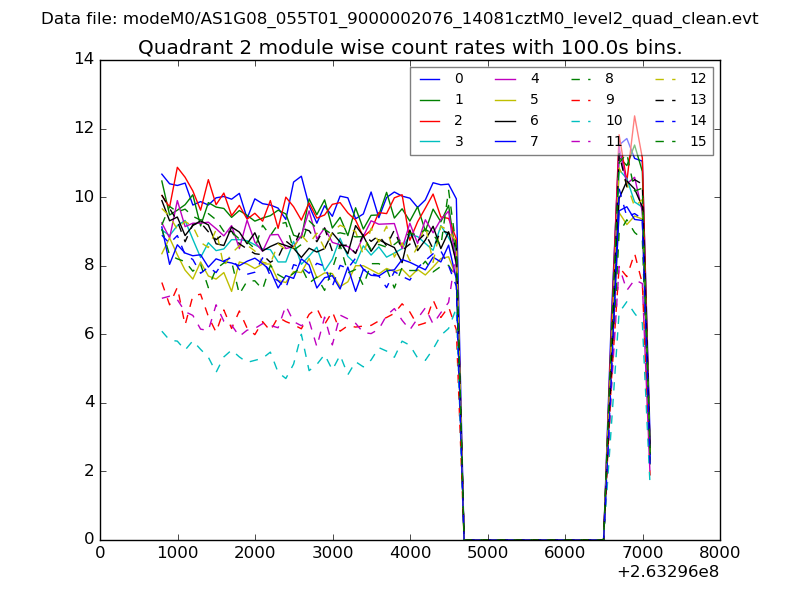
| Module-wise count rates for Quadrant B Data is divided into 100 sec bins |
 |
 |
| Module-wise count rates for Quadrant C Data is divided into 100 sec bins |
 |
 |
| Module-wise count rates for Quadrant D Data is divided into 100 sec bins |
 |
 |
| Parameter | Plot |
|---|---|
| CZT HV Monitor | 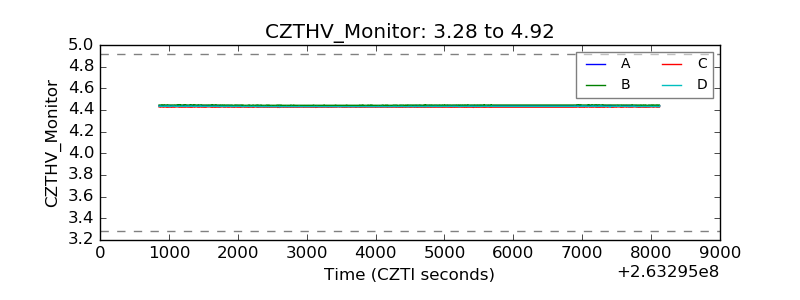 |
| D_VDD | 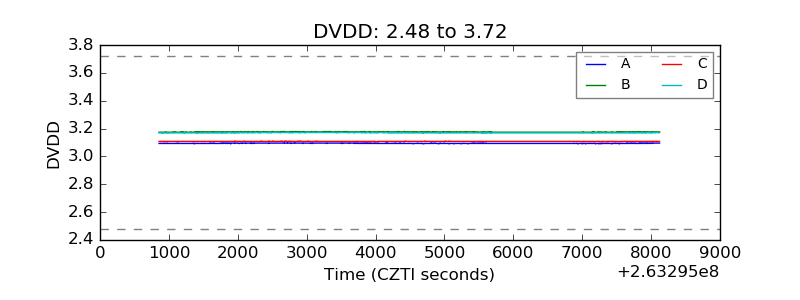 |
| Temperature 1 | 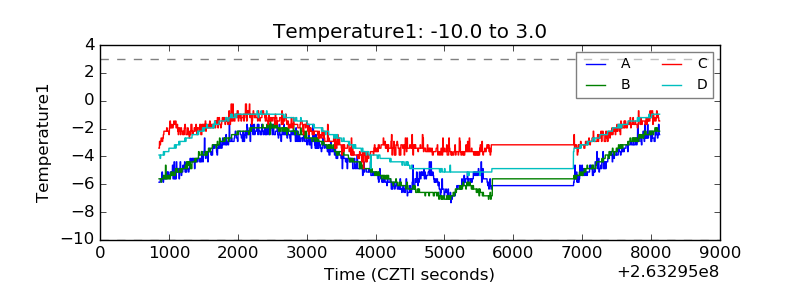 |
| Veto HV Monitor | 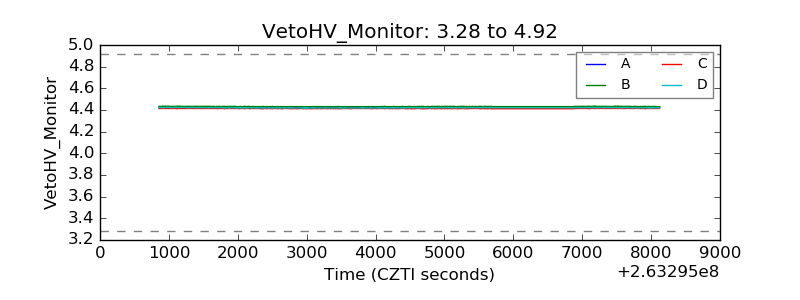 |
| Veto LLD | 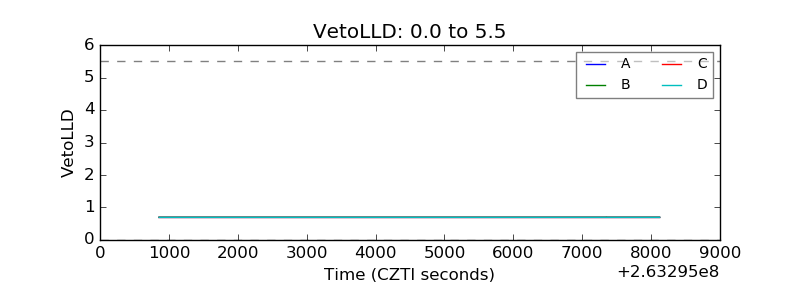 |
| Alpha Counter | 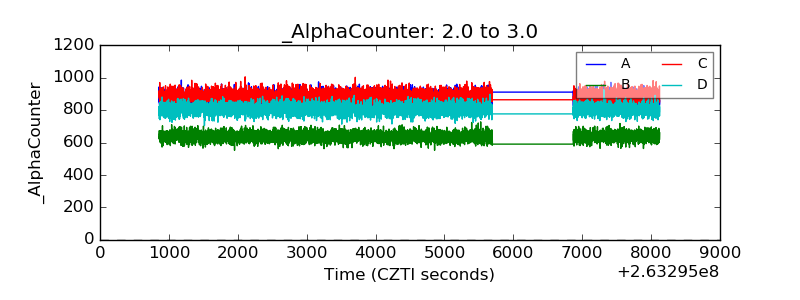 |
| _CPM_Rate | 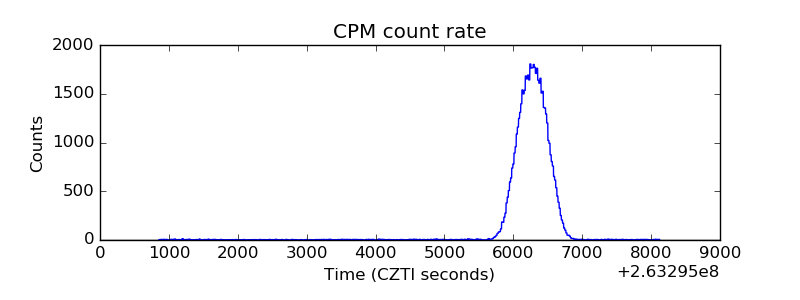 |
| CZT Counter |  |
| +2.5 Volts monitor | 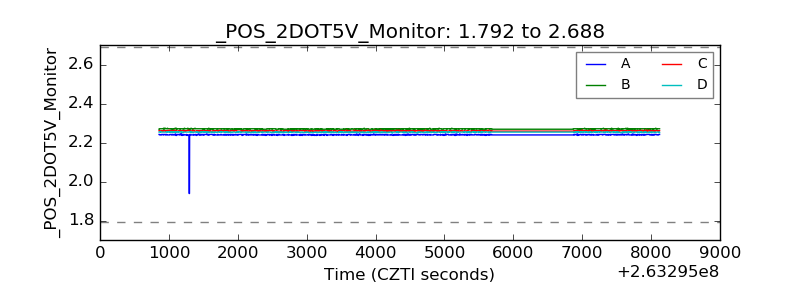 |
| +5 Volts monitor |  |
| _ROLL_ROT | 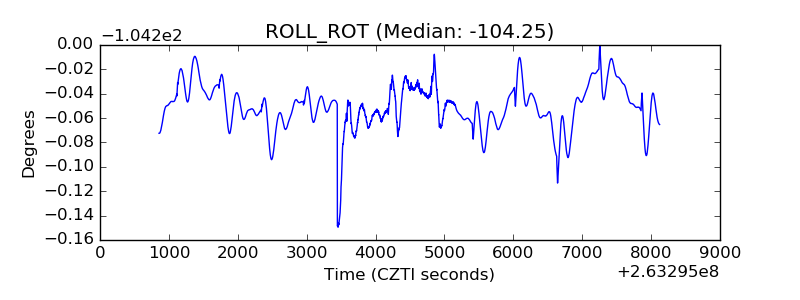 |
| _Roll_DEC | 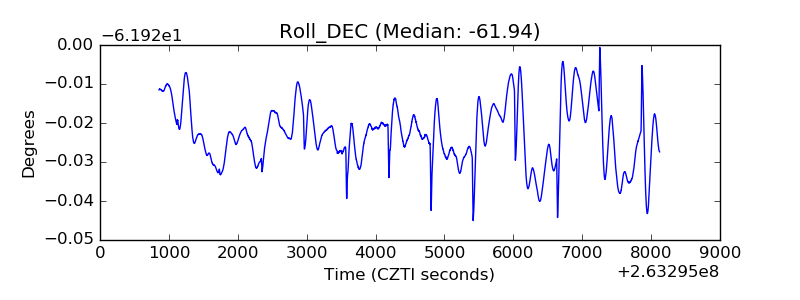 |
| _Roll_RA | 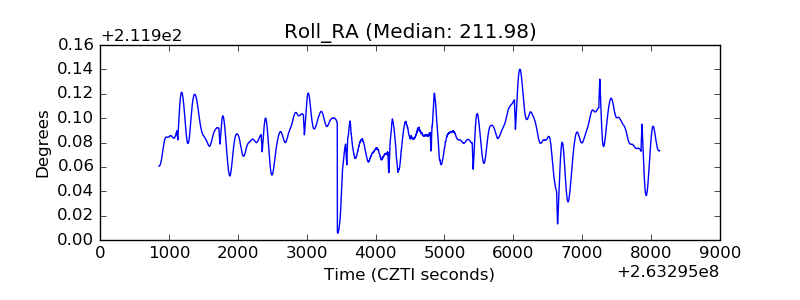 |
| Veto Counter | 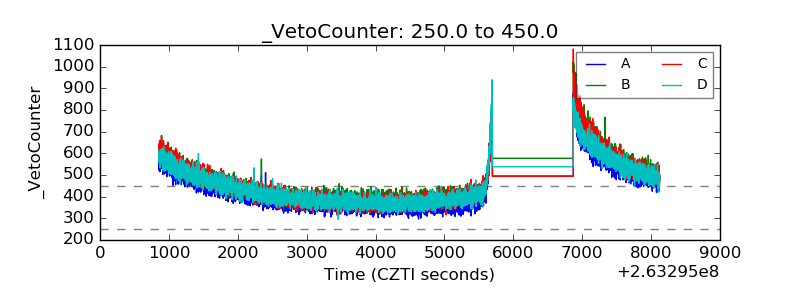 |