| Param | Original file | Final file |
|---|---|---|
| Filename | modeM0/AS1G08_055T01_9000002076_14082cztM0_level2.evt | modeM0/AS1G08_055T01_9000002076_14082cztM0_level2_quad_clean.evt |
| Size (bytes) | 350,841,600 | 82,045,440 |
| Size | 334.6 MB | 78.2 MB |
| Events in quadrant A | 2,257,085 | 559,400 |
| Events in quadrant B | 3,394,286 | 544,675 |
| Events in quadrant C | 2,070,475 | 546,218 |
| Events in quadrant D | 2,605,073 | 526,067 |
| Mode SS | |||
|---|---|---|---|
| Quadrant | BADHDUFLAG | Total packets | Discarded packets |
| A | 0 | 88 | 0 |
| B | 0 | 88 | 0 |
| C | 0 | 88 | 0 |
| D | 0 | 88 | 0 |
| Mode M0 | |||
|---|---|---|---|
| Quadrant | BADHDUFLAG | Total packets | Discarded packets |
| A | 0 | 9417 | 0 |
| B | 0 | 12976 | 0 |
| C | 0 | 8997 | 0 |
| D | 0 | 10451 | 0 |
| Quadrant | Total seconds | Saturated seconds | Saturation percentage |
|---|---|---|---|
| A | 4380 | 6 | 0.136986% |
| B | 4380 | 292 | 6.666667% |
| C | 4380 | 0 | 0.000000% |
| D | 4380 | 41 | 0.936073% |
Noise dominated data is calculated using 1-second bins in cleaned event files. If a bin has >2000 counts, and if more than 50% of those come from <1% of pixels, then it is considered to be noise-dominated and hence unusable.
| Quadrant | # 1 sec bins | Bins with >0 counts | Bins with >2000 counts | High rate bins dominated by noise | Noise dominated (total time) | Noise dominated (detector-on time) | Marked lightcurve |
|---|---|---|---|---|---|---|---|
| A | 4381 | 4381 | 0 | 0 | 0.00% | 0.00% | 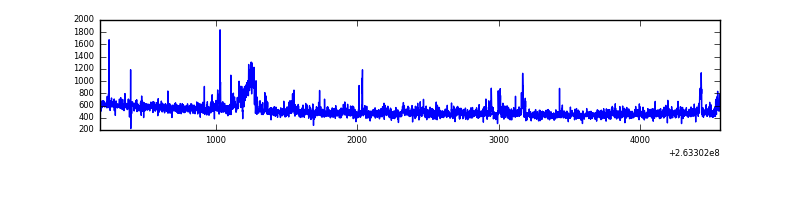 |
| B | 4381 | 4381 | 181 | 181 | 4.13% | 4.13% | 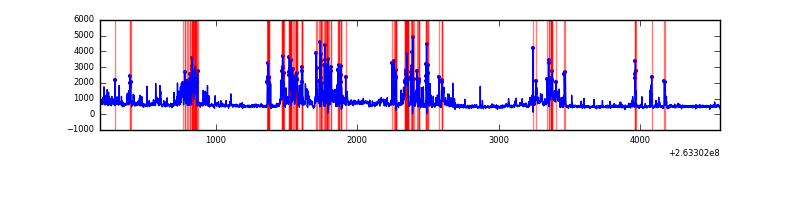 |
| C | 4381 | 4381 | 0 | 0 | 0.00% | 0.00% | 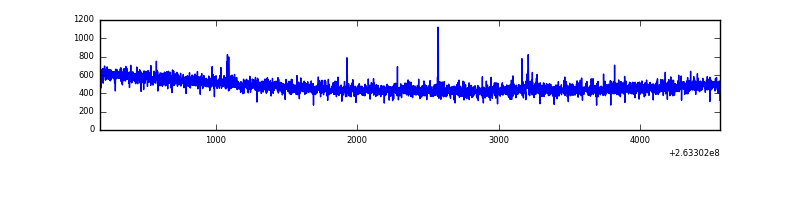 |
| D | 4381 | 4381 | 37 | 37 | 0.84% | 0.84% | 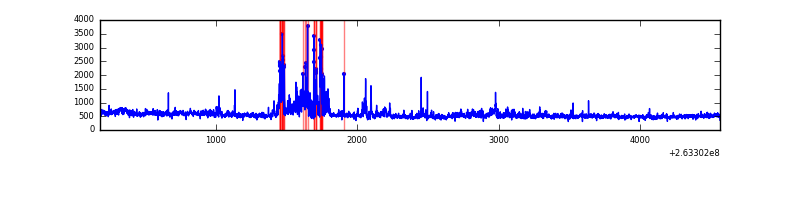 |
Top three noisy pixels from each quadrant. If the there are fewer than three noisy pixels in the level2.evt file, extra rows are filled as -1
| Pixel properties | Quadrant properties | ||||||
|---|---|---|---|---|---|---|---|
| Quadrant | DetID | PixID | Counts | Sigma | Mean | Median | Sigma |
| A | 15 | 222 | 68710 | 620.67 | 544 | 534 | 109.8 |
| A | 12 | 189 | 41030 | 368.68 | 544 | 534 | 109.8 |
| A | 8 | 15 | 34763 | 311.62 | 544 | 534 | 109.8 |
| B | 10 | 16 | 1178394 | 12249.93 | 529 | 521 | 96.2 |
| B | 0 | 189 | 29913 | 305.68 | 529 | 521 | 96.2 |
| B | 0 | 219 | 28790 | 294.0 | 529 | 521 | 96.2 |
| C | 3 | 233 | 42275 | 352.2 | 517 | 521 | 118.6 |
| C | 10 | 22 | 6094 | 47.01 | 517 | 521 | 118.6 |
| C | 13 | 61 | 3816 | 27.79 | 517 | 521 | 118.6 |
| D | 7 | 80 | 241803 | 1980.54 | 515 | 505 | 121.8 |
| D | 8 | 195 | 156285 | 1278.62 | 515 | 505 | 121.8 |
| D | 1 | 52 | 137721 | 1126.25 | 515 | 505 | 121.8 |
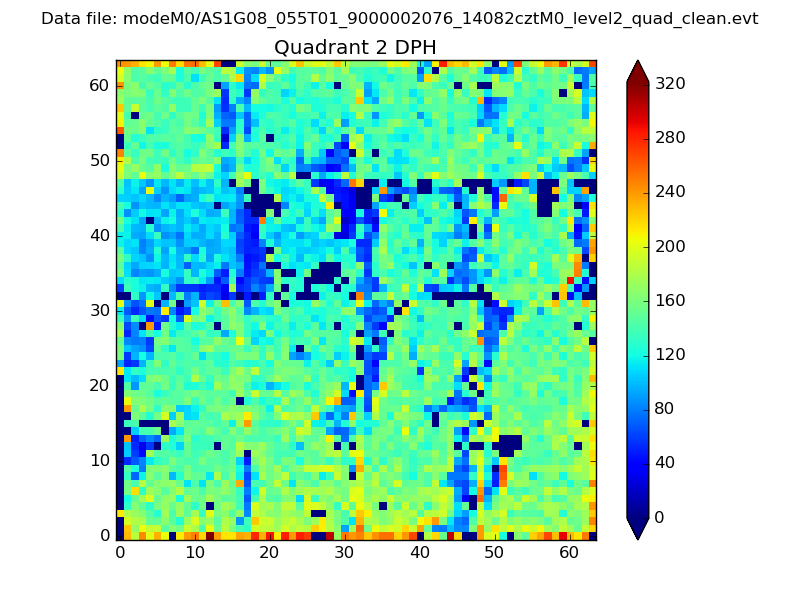
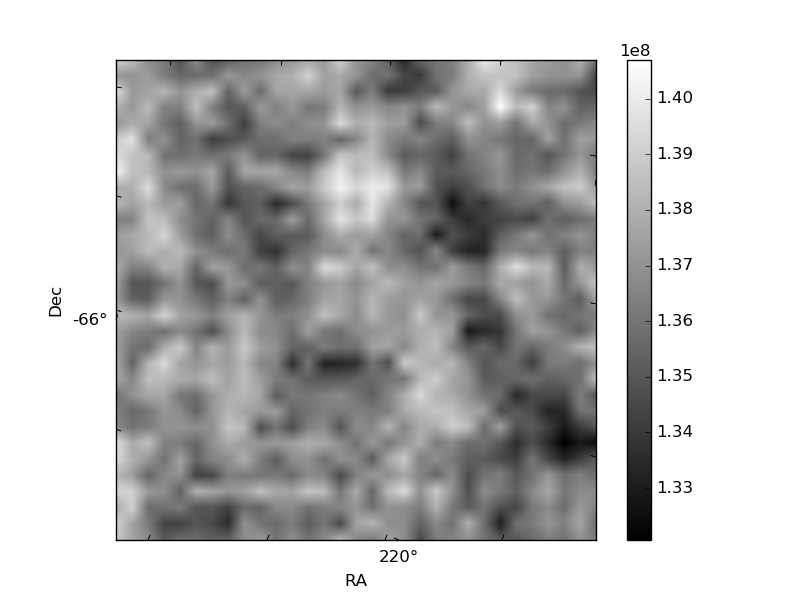
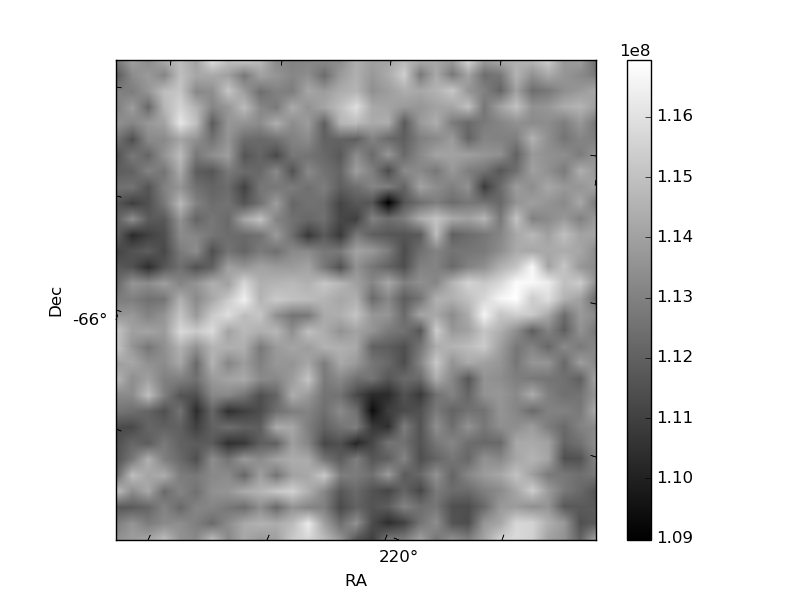
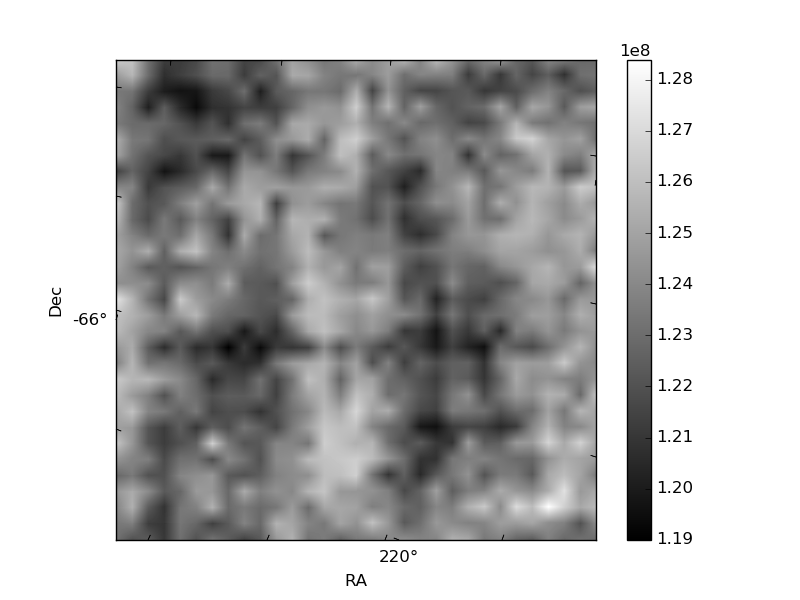
Histogram calculated using DETX and DETY for each event in the final _common_clean file
| Quadrant A | 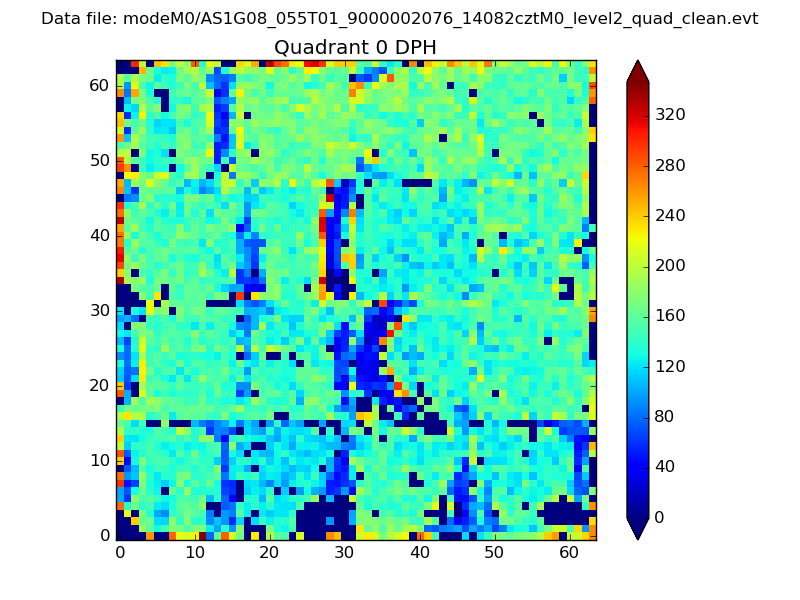 |
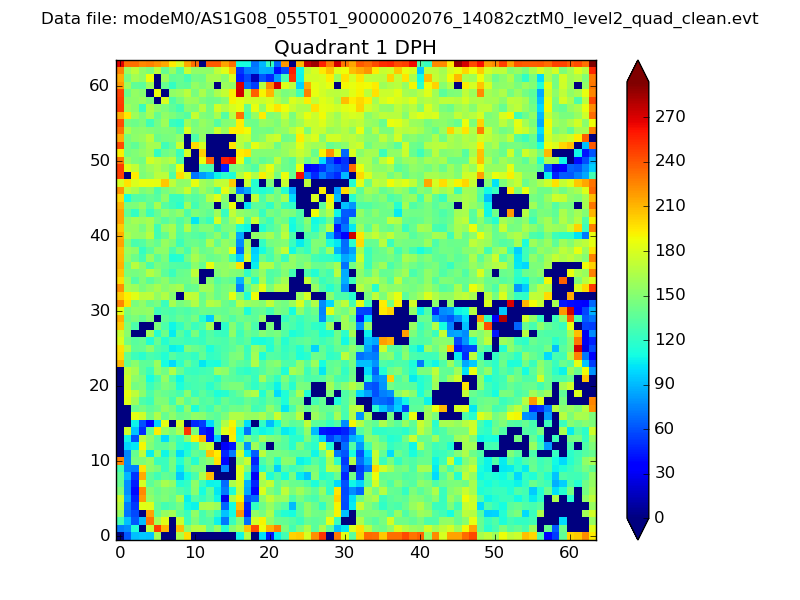 |
Quadrant B |
|---|---|---|---|
| Quadrant D | 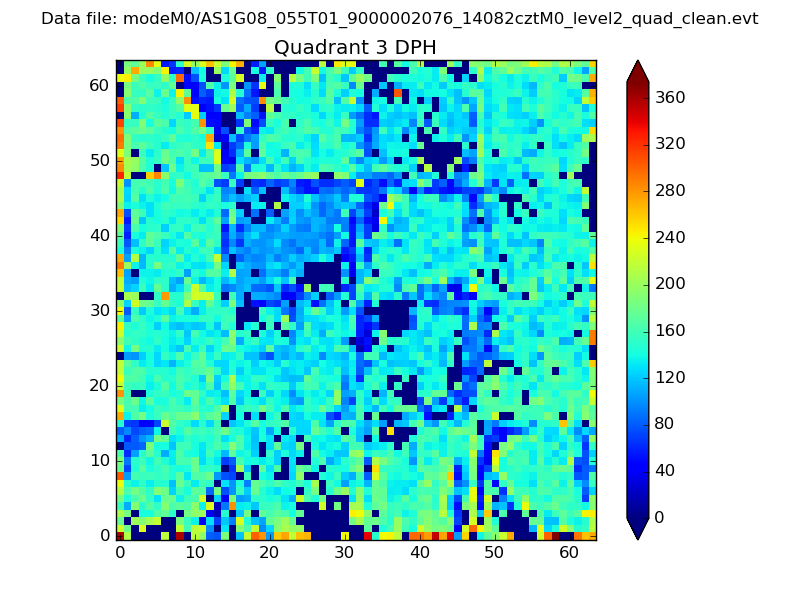 |
 |
Quadrant C |
| Plot type | Count rate plots | Images |
|---|---|---|
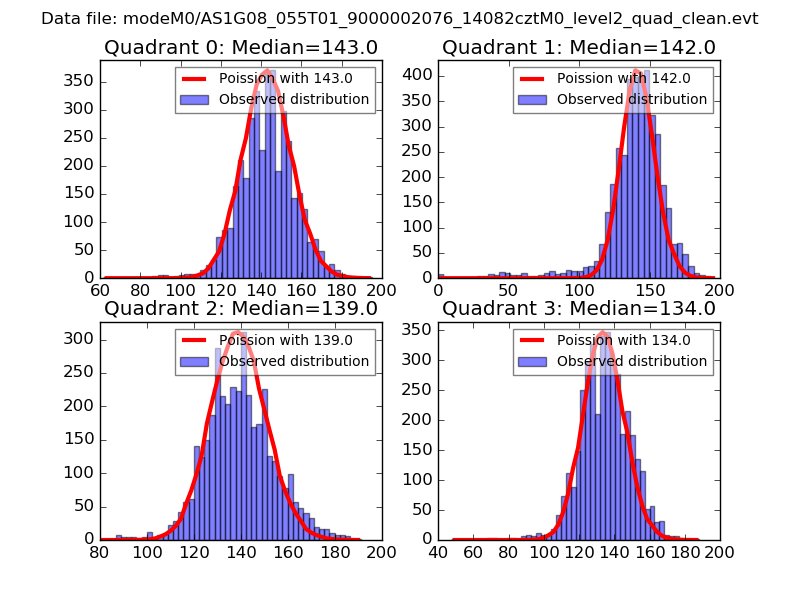
| Comparison with Poisson distribution Blue bars denote a histogram of data divided into 1 sec bins. Red curve is a Poisson curve with rate = median count rate of data. |
 |
 |
| Quadrant-wise count rates Data is divided into 100 sec bins |
 |
|
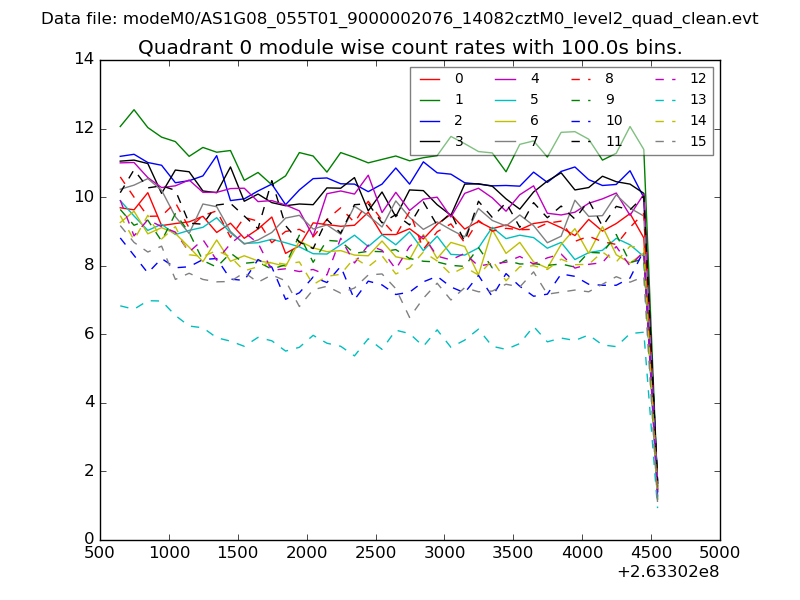
| Module-wise count rates for Quadrant A Data is divided into 100 sec bins |
 |
 |
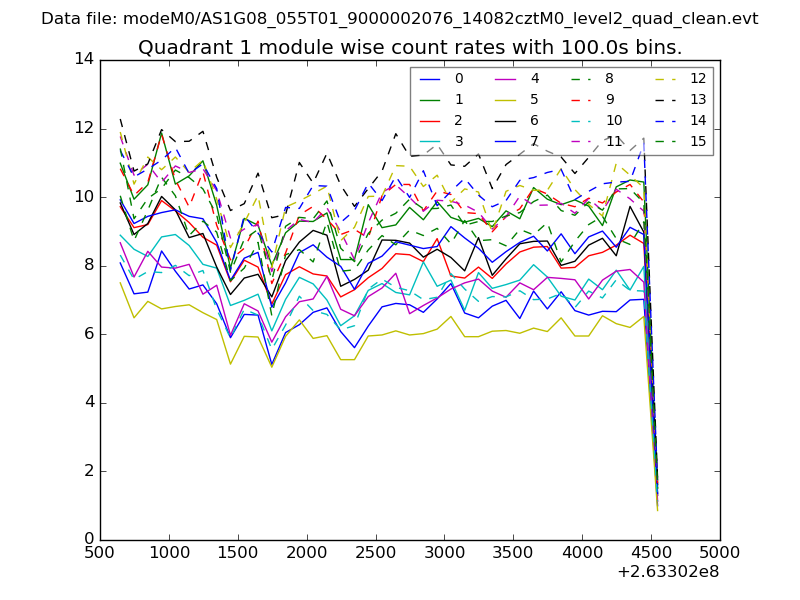
| Module-wise count rates for Quadrant B Data is divided into 100 sec bins |
 |
 |
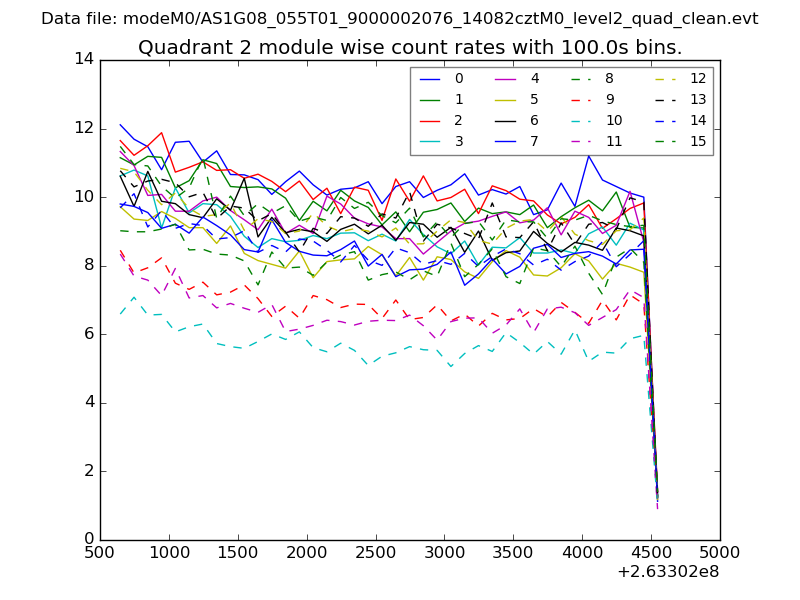
| Module-wise count rates for Quadrant C Data is divided into 100 sec bins |
 |
 |
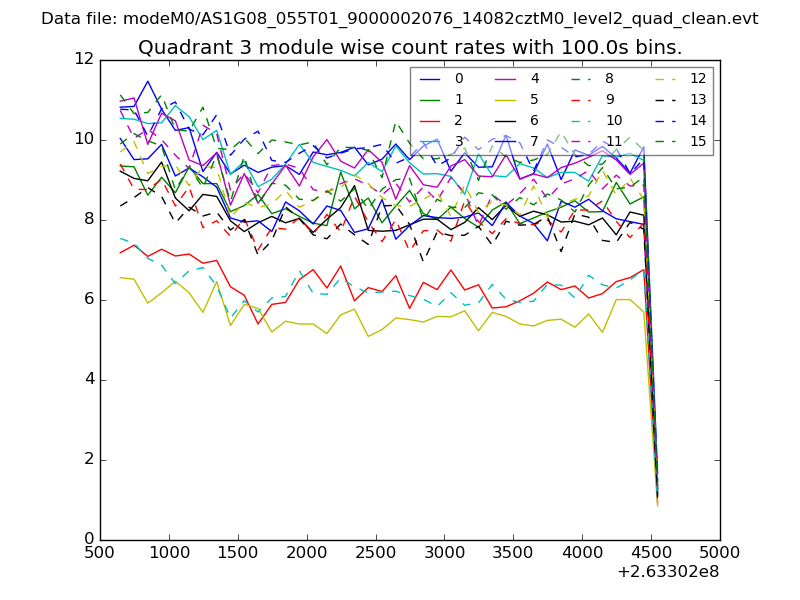
| Module-wise count rates for Quadrant D Data is divided into 100 sec bins |
 |
 |
| Parameter | Plot |
|---|---|
| CZT HV Monitor | 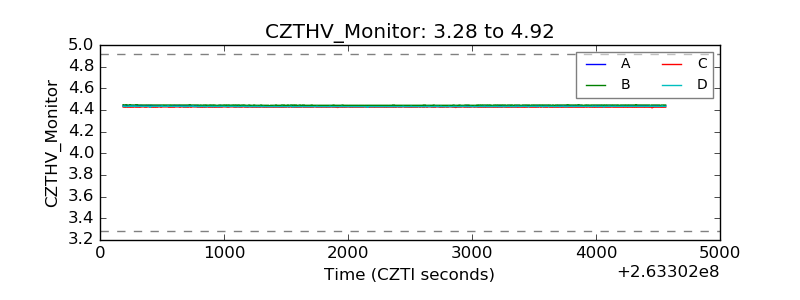 |
| D_VDD | 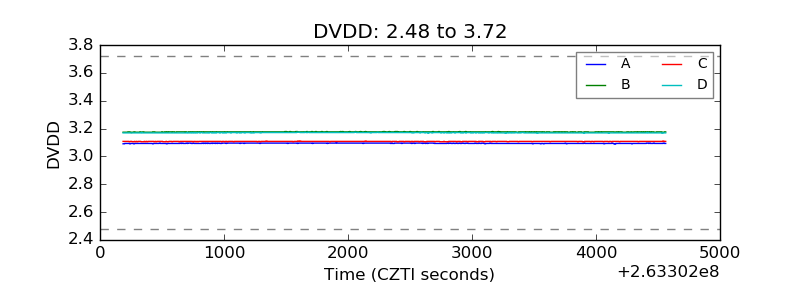 |
| Temperature 1 | 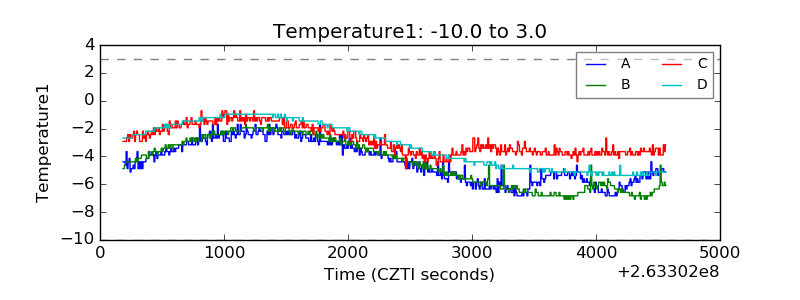 |
| Veto HV Monitor | 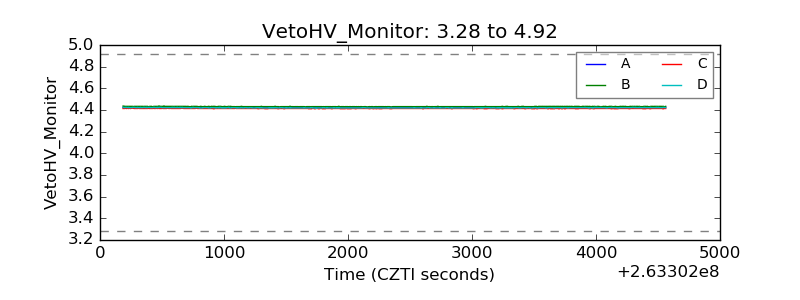 |
| Veto LLD | 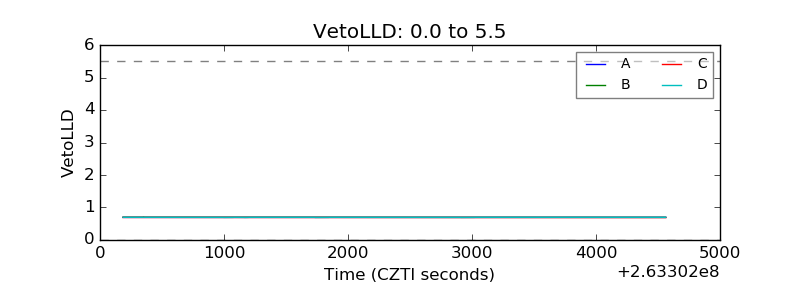 |
| Alpha Counter | 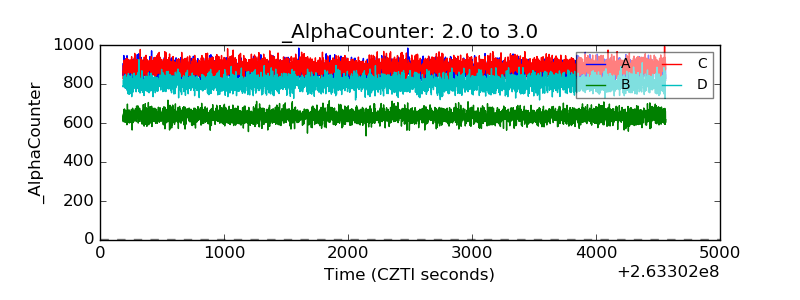 |
| _CPM_Rate | 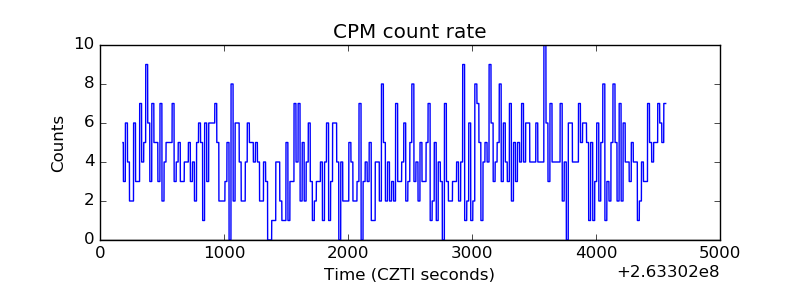 |
| CZT Counter |  |
| +2.5 Volts monitor |  |
| +5 Volts monitor |  |
| _ROLL_ROT | 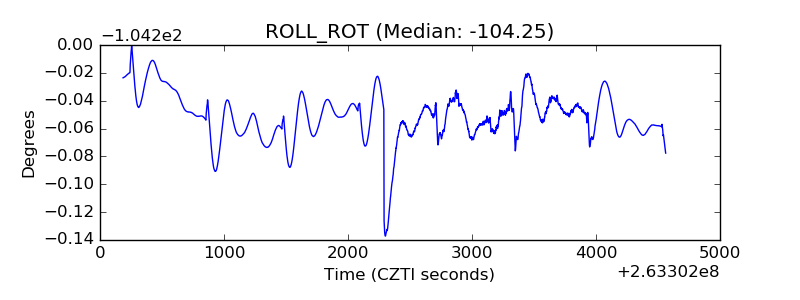 |
| _Roll_DEC | 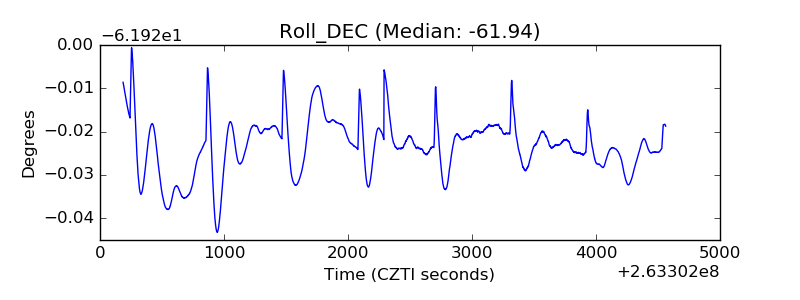 |
| _Roll_RA |  |
| Veto Counter | 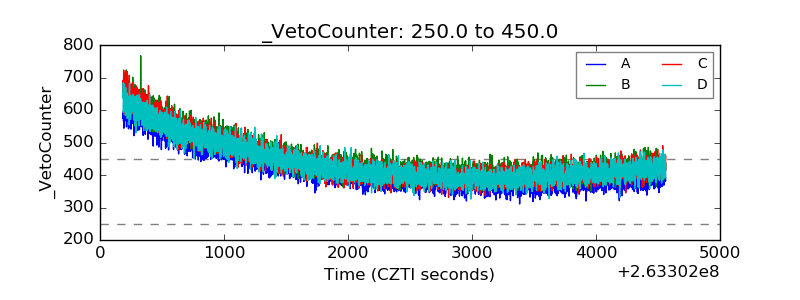 |