| Param | Original file | Final file |
|---|---|---|
| Filename | modeM0/AS1G08_022T01_9000002078cztM0_level2.fits | modeM0/AS1G08_022T01_9000002078cztM0_level2_quad_clean.evt |
| Size (bytes) | 1,202,284,800 | 1,311,886,080 |
| Size | 1.1 GB | 1.2 GB |
| Events in quadrant A | 7,494,164 | 8,571,587 |
| Events in quadrant B | 6,909,896 | 7,849,783 |
| Events in quadrant C | 7,238,414 | 7,762,983 |
| Events in quadrant D | 6,179,572 | 6,965,130 |
| Mode SS | |||
|---|---|---|---|
| Quadrant | BADHDUFLAG | Total packets | Discarded packets |
| A | 0 | 2552 | 0 |
| B | 0 | 2552 | 0 |
| C | 0 | 2552 | 0 |
| D | 0 | 2552 | 0 |
| Mode M9 | |||
|---|---|---|---|
| Quadrant | BADHDUFLAG | Total packets | Discarded packets |
| A | 0 | 181 | 0 |
| B | 0 | 181 | 0 |
| C | 0 | 181 | 0 |
| D | 0 | 182 | 0 |
| Mode M0 | |||
|---|---|---|---|
| Quadrant | BADHDUFLAG | Total packets | Discarded packets |
| A | 0 | 272832 | 0 |
| B | 0 | 349830 | 0 |
| C | 0 | 260420 | 0 |
| D | 0 | 335560 | 0 |
| Quadrant | Total seconds | Saturated seconds | Saturation percentage |
|---|---|---|---|
| A | 125260 | 1874 | 1.496088% |
| B | 125260 | 9798 | 7.822130% |
| C | 125260 | 830 | 0.662622% |
| D | 125260 | 5649 | 4.509820% |
Noise dominated data is calculated using 1-second bins in cleaned event files. If a bin has >2000 counts, and if more than 50% of those come from <1% of pixels, then it is considered to be noise-dominated and hence unusable.
| Quadrant | # 1 sec bins | Bins with >0 counts | Bins with >2000 counts | High rate bins dominated by noise | Noise dominated (total time) | Noise dominated (detector-on time) | Marked lightcurve |
|---|---|---|---|---|---|---|---|
| A | 143054 | 125249 | 0 | 0 | 0.00% | 0.00% |  |
| B | 143054 | 124907 | 0 | 0 | 0.00% | 0.00% |  |
| C | 143054 | 125257 | 0 | 0 | 0.00% | 0.00% |  |
| D | 143054 | 125233 | 0 | 0 | 0.00% | 0.00% |  |
Top three noisy pixels from each quadrant. If the there are fewer than three noisy pixels in the level2.evt file, extra rows are filled as -1
| Pixel properties | Quadrant properties | ||||||
|---|---|---|---|---|---|---|---|
| Quadrant | DetID | PixID | Counts | Sigma | Mean | Median | Sigma |
| A | 0 | 29 | 7194 | 11.14 | 1950 | 1832 | 481.3 |
| A | 7 | 110 | 6116 | 8.9 | 1950 | 1832 | 481.3 |
| A | 9 | 19 | 5565 | 7.76 | 1950 | 1832 | 481.3 |
| B | 2 | 9 | 5927 | 11.87 | 1824 | 1745 | 352.4 |
| B | 5 | 128 | 4600 | 8.1 | 1824 | 1745 | 352.4 |
| B | 3 | 17 | 4578 | 8.04 | 1824 | 1745 | 352.4 |
| C | 1 | 80 | 5606 | 7.78 | 1911 | 1778 | 491.9 |
| C | 1 | 81 | 5470 | 7.5 | 1911 | 1778 | 491.9 |
| C | 12 | 241 | 5011 | 6.57 | 1911 | 1778 | 491.9 |
| D | 6 | 231 | 4448 | 6.06 | 1763 | 1604 | 469.2 |
| D | 3 | 14 | 4440 | 6.04 | 1763 | 1604 | 469.2 |
| D | 7 | 3 | 4408 | 5.98 | 1763 | 1604 | 469.2 |
Histogram calculated using DETX and DETY for each event in the final _common_clean file
| Quadrant A | 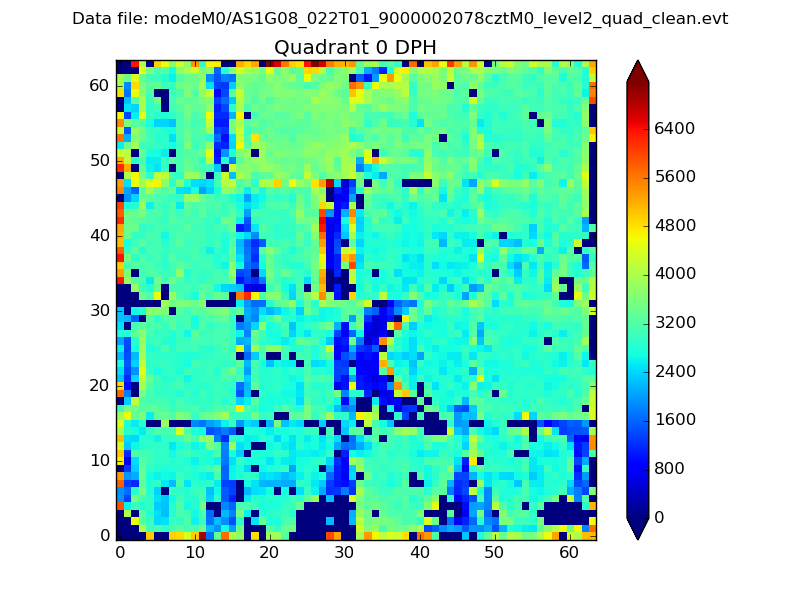 |
 |
Quadrant B |
|---|---|---|---|
| Quadrant D | 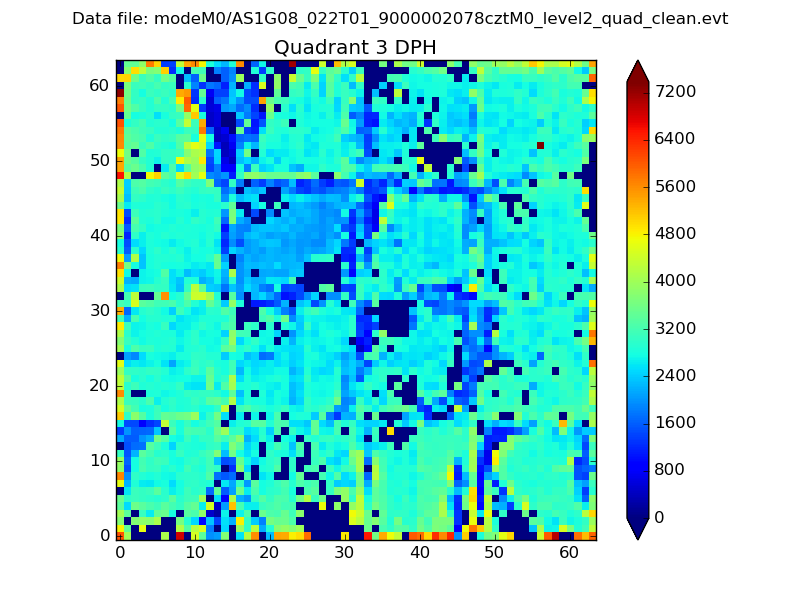 |
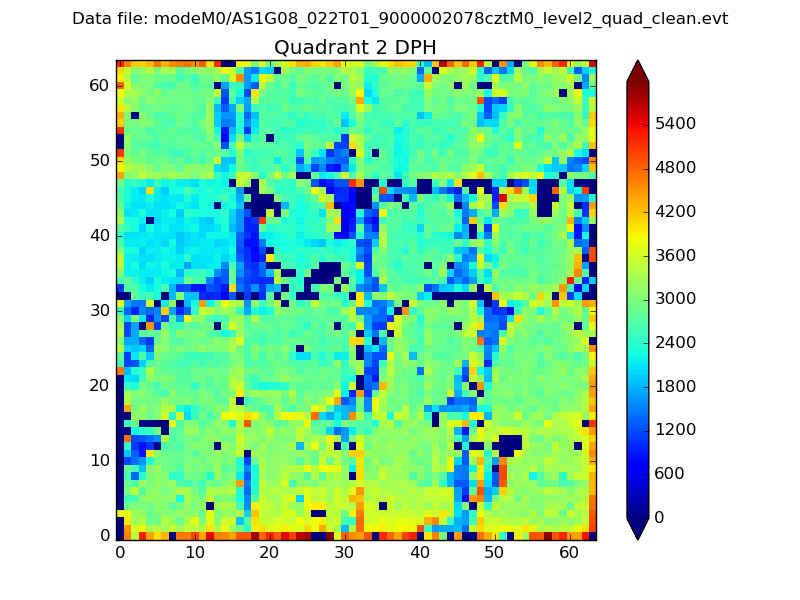 |
Quadrant C |
| Plot type | Count rate plots | Images |
|---|---|---|
| Comparison with Poisson distribution Blue bars denote a histogram of data divided into 1 sec bins. Red curve is a Poisson curve with rate = median count rate of data. |
 |
 |
| Quadrant-wise count rates Data is divided into 100 sec bins |
 |
|
| Module-wise count rates for Quadrant A Data is divided into 100 sec bins |
 |
 |
| Module-wise count rates for Quadrant B Data is divided into 100 sec bins |
 |
 |
| Module-wise count rates for Quadrant C Data is divided into 100 sec bins |
 |
 |
| Module-wise count rates for Quadrant D Data is divided into 100 sec bins |
 |
 |
| Parameter | Plot |
|---|---|
| CZT HV Monitor |  |
| D_VDD | 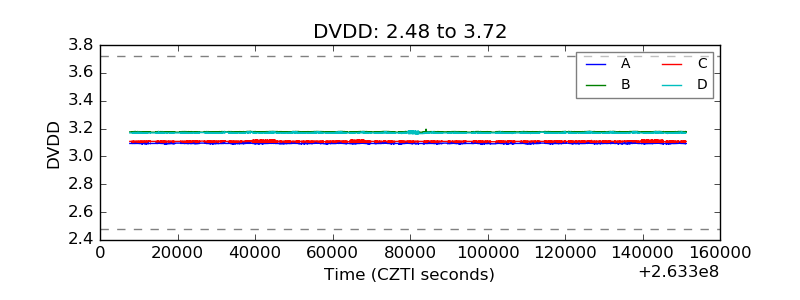 |
| Temperature 1 |  |
| Veto HV Monitor |  |
| Veto LLD |  |
| Alpha Counter |  |
| _CPM_Rate |  |
| CZT Counter |  |
| +2.5 Volts monitor |  |
| +5 Volts monitor |  |
| _ROLL_ROT |  |
| _Roll_DEC |  |
| _Roll_RA |  |
| Veto Counter |  |