| Param | Original file | Final file |
|---|---|---|
| Filename | modeM0/AS1G08_022T01_9000002078_14083cztM0_level2.evt | modeM0/AS1G08_022T01_9000002078_14083cztM0_level2_quad_clean.evt |
| Size (bytes) | 522,112,320 | 84,657,600 |
| Size | 497.9 MB | 80.7 MB |
| Events in quadrant A | 3,783,502 | 555,038 |
| Events in quadrant B | 4,396,157 | 527,423 |
| Events in quadrant C | 3,231,601 | 530,457 |
| Events in quadrant D | 3,974,909 | 511,876 |
| Mode SS | |||
|---|---|---|---|
| Quadrant | BADHDUFLAG | Total packets | Discarded packets |
| A | 0 | 128 | 0 |
| B | 0 | 128 | 0 |
| C | 0 | 128 | 0 |
| D | 0 | 128 | 0 |
| Mode M9 | |||
|---|---|---|---|
| Quadrant | BADHDUFLAG | Total packets | Discarded packets |
| A | 0 | 17 | 0 |
| B | 0 | 17 | 0 |
| C | 0 | 17 | 0 |
| D | 0 | 18 | 0 |
| Mode M0 | |||
|---|---|---|---|
| Quadrant | BADHDUFLAG | Total packets | Discarded packets |
| A | 0 | 15394 | 3 |
| B | 0 | 17221 | 2 |
| C | 0 | 13578 | 2 |
| D | 0 | 16228 | 2 |
| Quadrant | Total seconds | Saturated seconds | Saturation percentage |
|---|---|---|---|
| A | 6283 | 127 | 2.021327% |
| B | 6283 | 454 | 7.225848% |
| C | 6283 | 58 | 0.923126% |
| D | 6283 | 102 | 1.623428% |
Noise dominated data is calculated using 1-second bins in cleaned event files. If a bin has >2000 counts, and if more than 50% of those come from <1% of pixels, then it is considered to be noise-dominated and hence unusable.
| Quadrant | # 1 sec bins | Bins with >0 counts | Bins with >2000 counts | High rate bins dominated by noise | Noise dominated (total time) | Noise dominated (detector-on time) | Marked lightcurve |
|---|---|---|---|---|---|---|---|
| A | 7629 | 6285 | 20 | 20 | 0.26% | 0.32% | 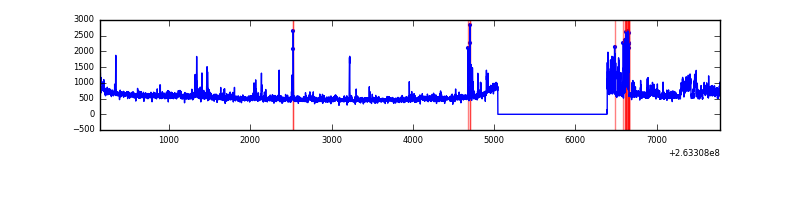 |
| B | 7629 | 6285 | 187 | 187 | 2.45% | 2.98% | 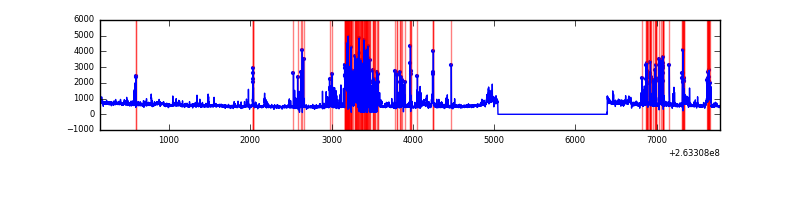 |
| C | 7629 | 6285 | 0 | 0 | 0.00% | 0.00% | 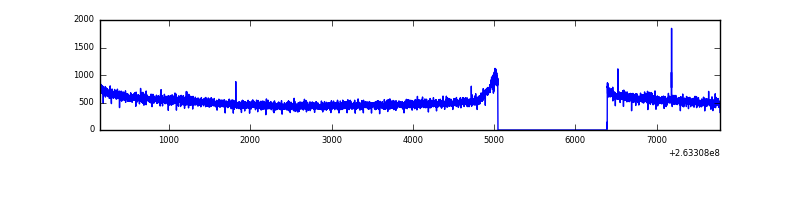 |
| D | 7629 | 6285 | 14 | 14 | 0.18% | 0.22% | 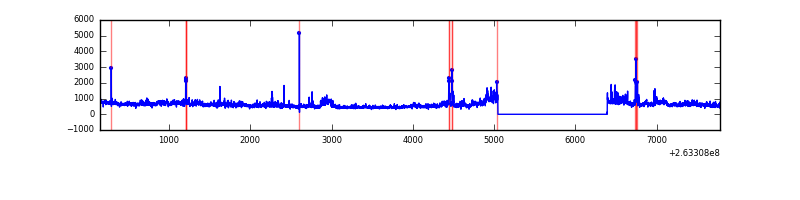 |
Top three noisy pixels from each quadrant. If the there are fewer than three noisy pixels in the level2.evt file, extra rows are filled as -1
| Pixel properties | Quadrant properties | ||||||
|---|---|---|---|---|---|---|---|
| Quadrant | DetID | PixID | Counts | Sigma | Mean | Median | Sigma |
| A | 15 | 222 | 306897 | 1820.35 | 858 | 843 | 168.1 |
| A | 12 | 189 | 90184 | 531.38 | 858 | 843 | 168.1 |
| A | 9 | 143 | 36834 | 214.07 | 858 | 843 | 168.1 |
| B | 10 | 16 | 952606 | 6161.8 | 831 | 813 | 154.5 |
| B | 10 | 245 | 59431 | 379.48 | 831 | 813 | 154.5 |
| B | 0 | 189 | 41116 | 260.91 | 831 | 813 | 154.5 |
| C | 3 | 233 | 52395 | 279.1 | 815 | 819 | 184.8 |
| C | 13 | 61 | 5898 | 27.48 | 815 | 819 | 184.8 |
| C | 0 | 207 | 4209 | 18.34 | 815 | 819 | 184.8 |
| D | 1 | 52 | 325176 | 1708.18 | 812 | 794 | 189.9 |
| D | 8 | 195 | 119840 | 626.89 | 812 | 794 | 189.9 |
| D | 12 | 144 | 109982 | 574.98 | 812 | 794 | 189.9 |
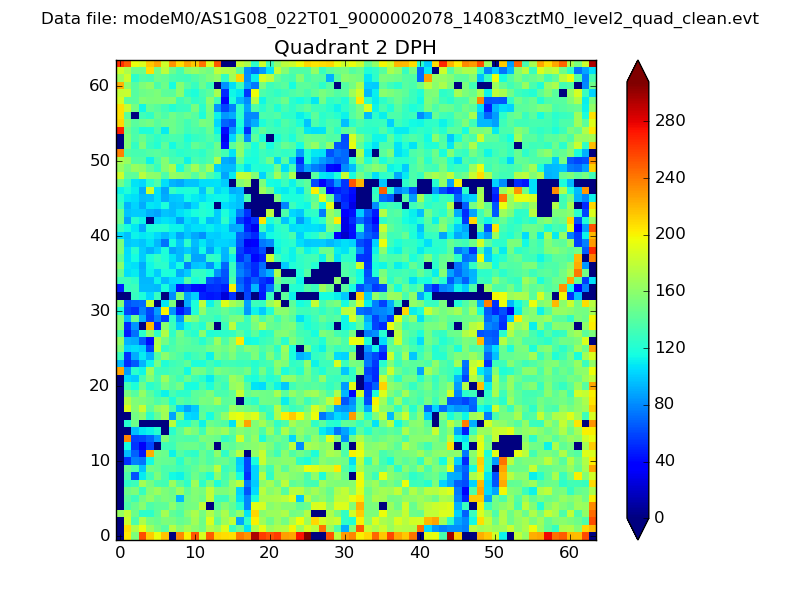
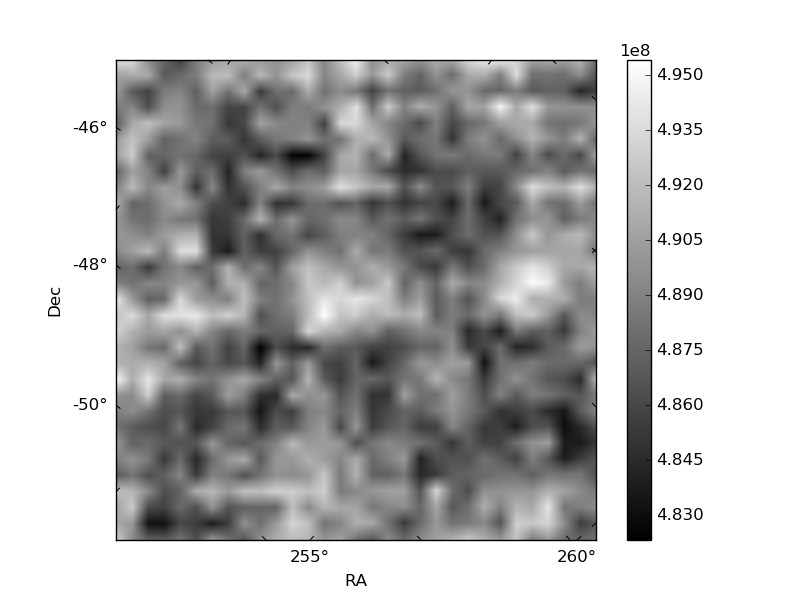
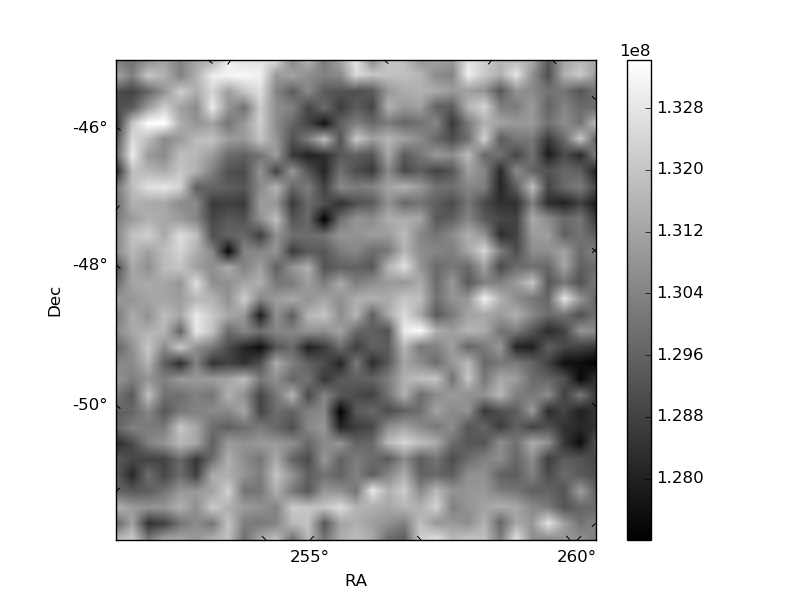
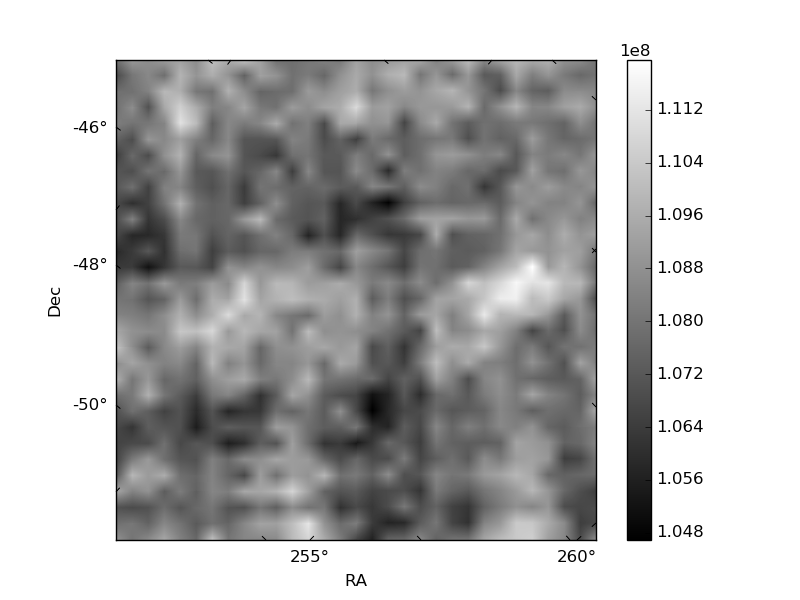
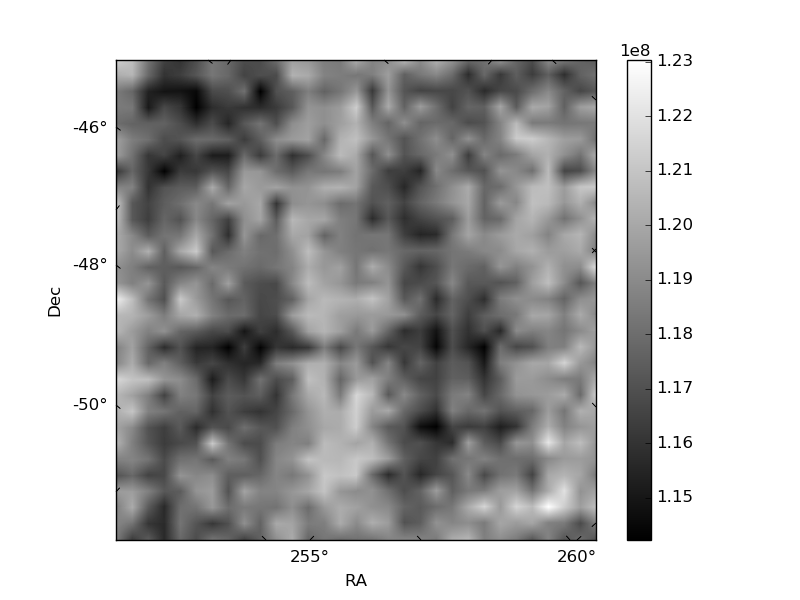
Histogram calculated using DETX and DETY for each event in the final _common_clean file
| Quadrant A | 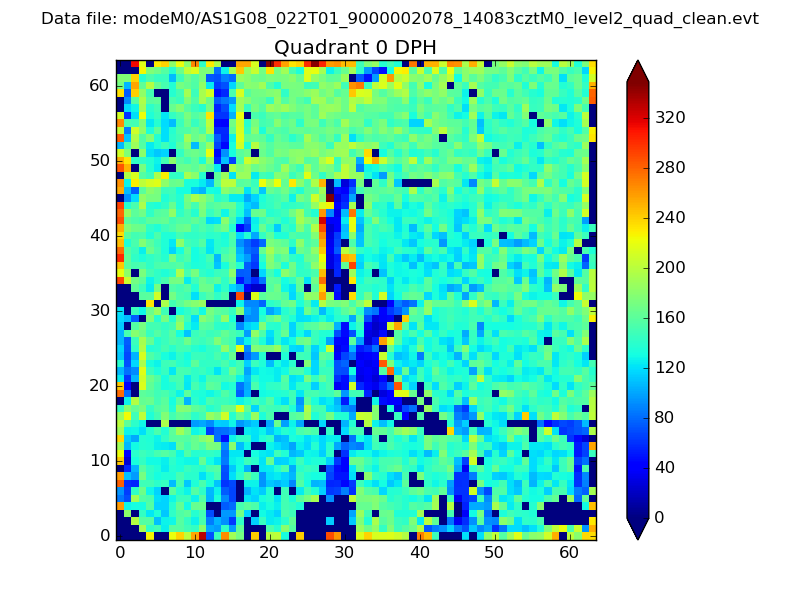 |
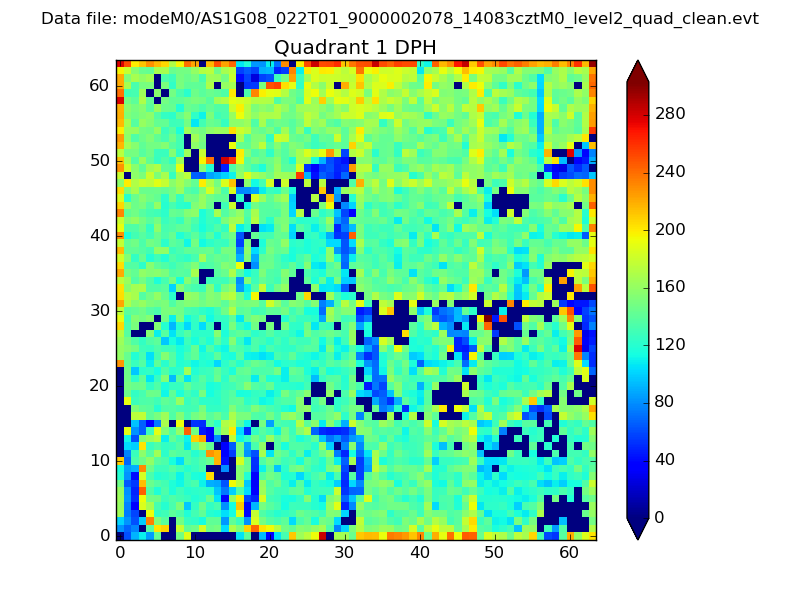 |
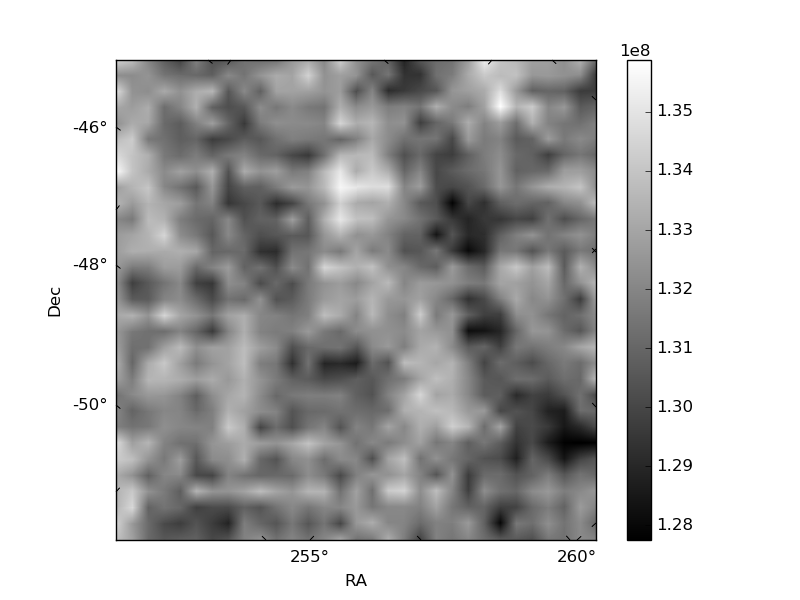
Quadrant B |
|---|---|---|---|
| Quadrant D | 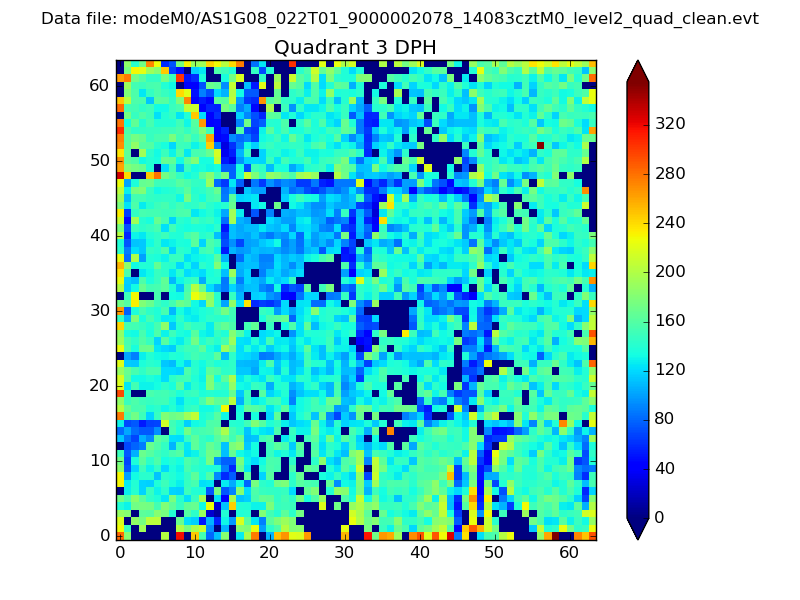 |
 |
Quadrant C |
| Plot type | Count rate plots | Images |
|---|---|---|
| Comparison with Poisson distribution Blue bars denote a histogram of data divided into 1 sec bins. Red curve is a Poisson curve with rate = median count rate of data. |
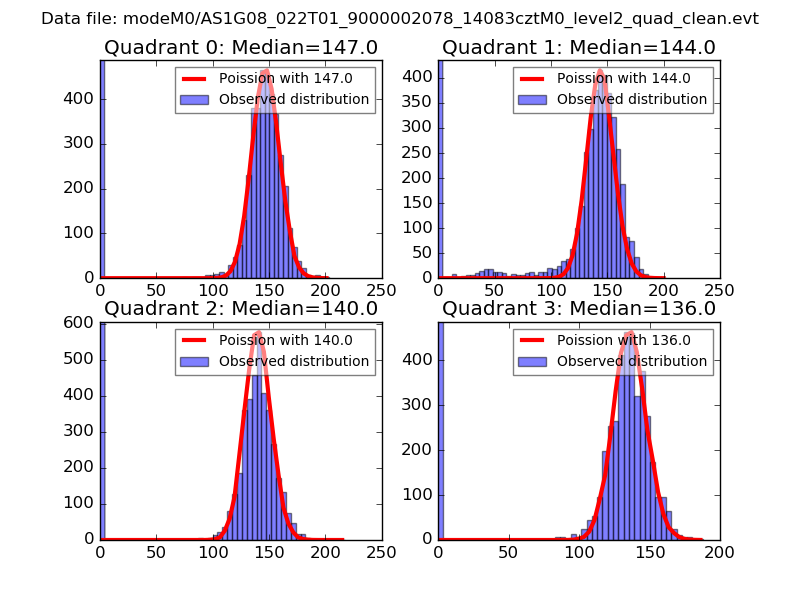 |
 |
| Quadrant-wise count rates Data is divided into 100 sec bins |
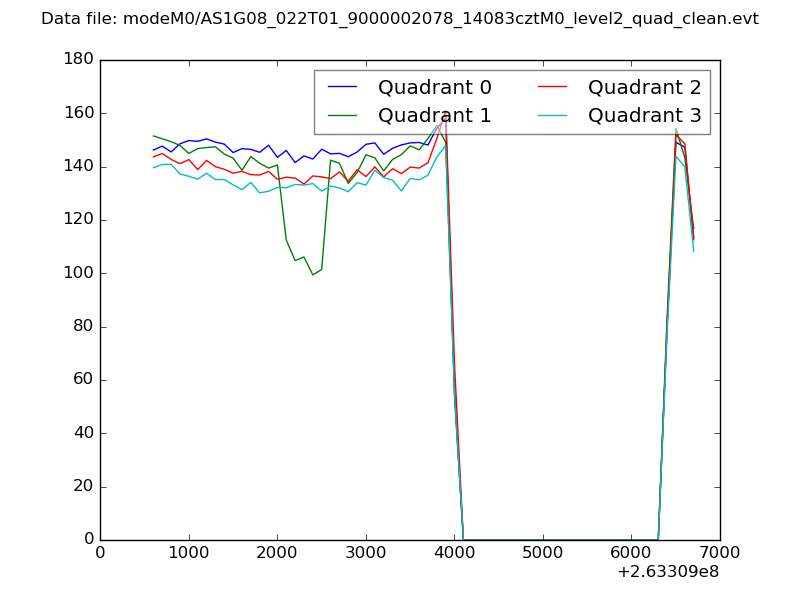 |
|
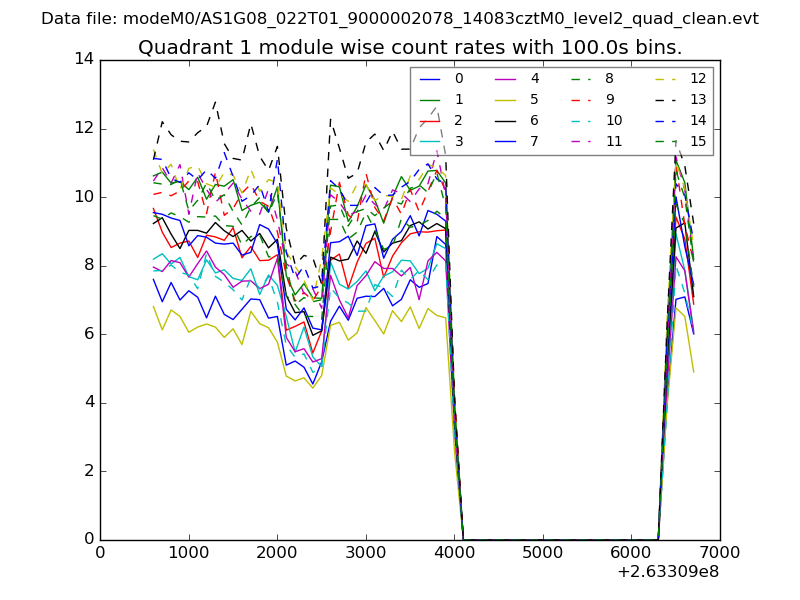
| Module-wise count rates for Quadrant A Data is divided into 100 sec bins |
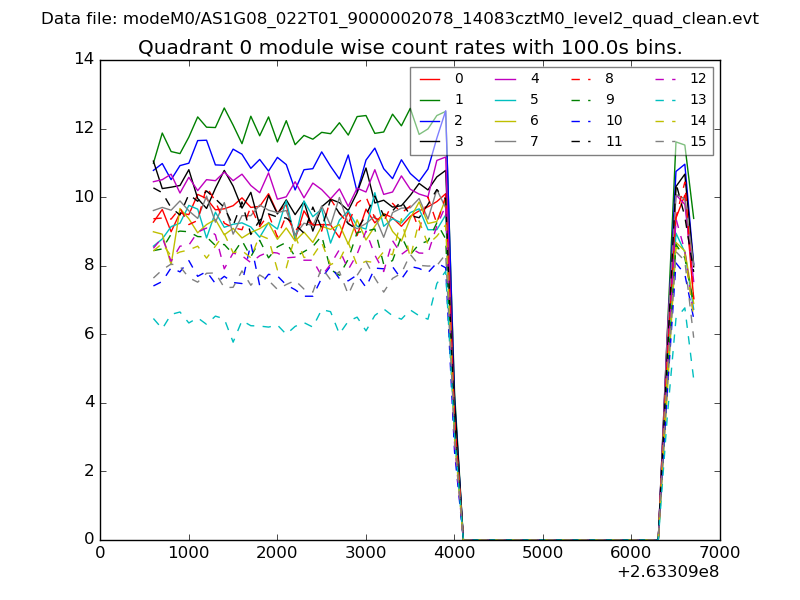 |
 |
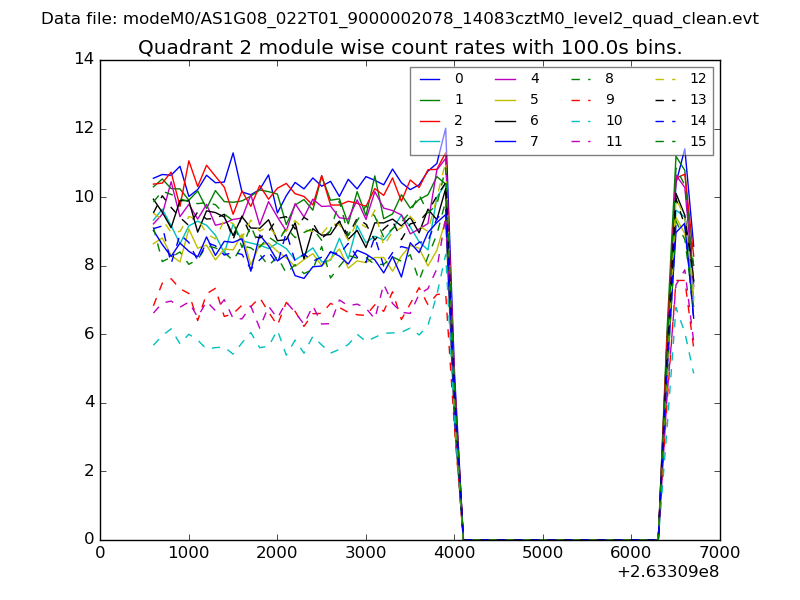
| Module-wise count rates for Quadrant B Data is divided into 100 sec bins |
 |
 |
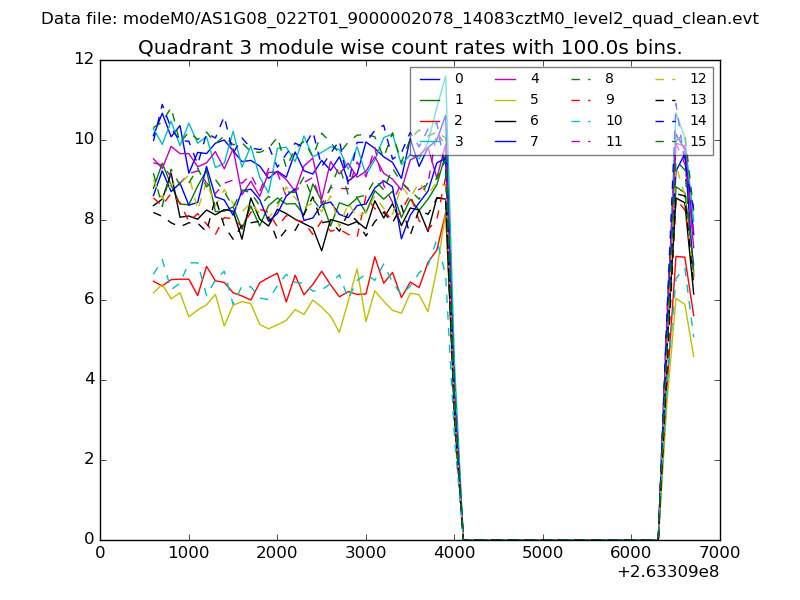
| Module-wise count rates for Quadrant C Data is divided into 100 sec bins |
 |
 |
| Module-wise count rates for Quadrant D Data is divided into 100 sec bins |
 |
 |
| Parameter | Plot |
|---|---|
| CZT HV Monitor | 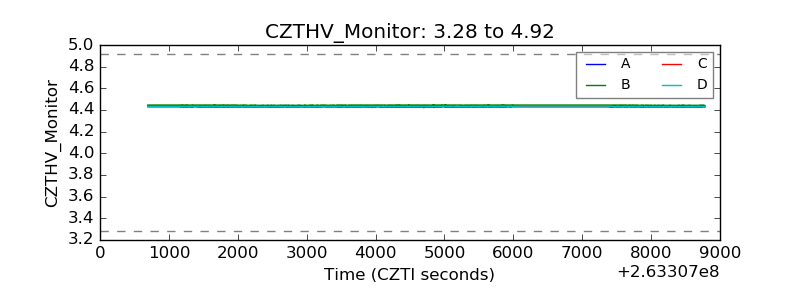 |
| D_VDD | 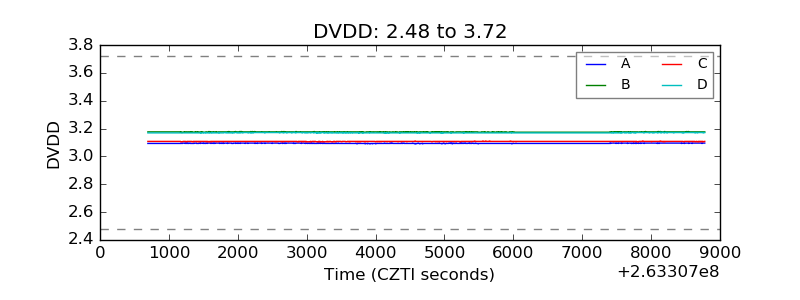 |
| Temperature 1 | 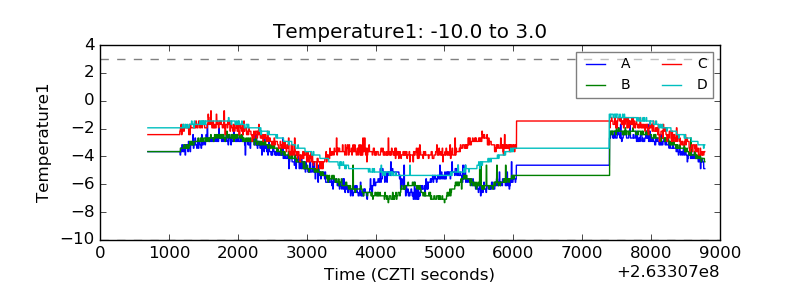 |
| Veto HV Monitor | 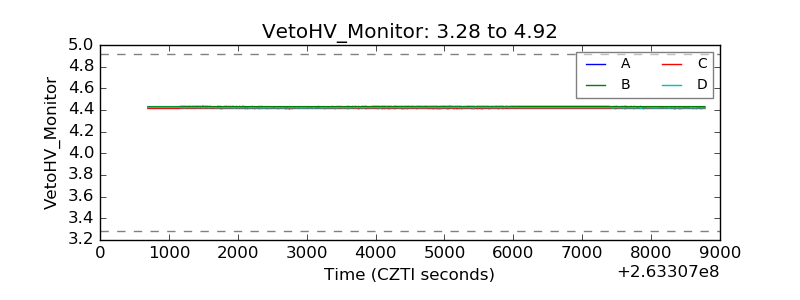 |
| Veto LLD | 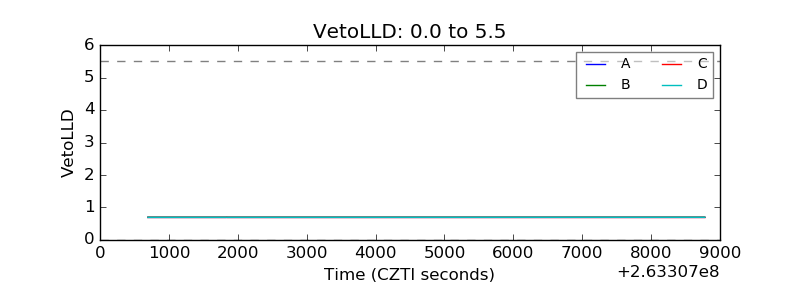 |
| Alpha Counter | 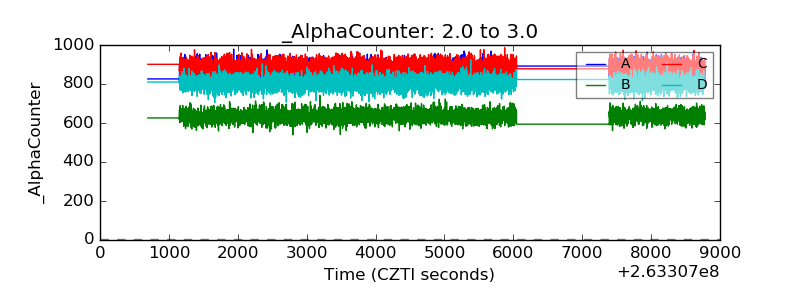 |
| _CPM_Rate | 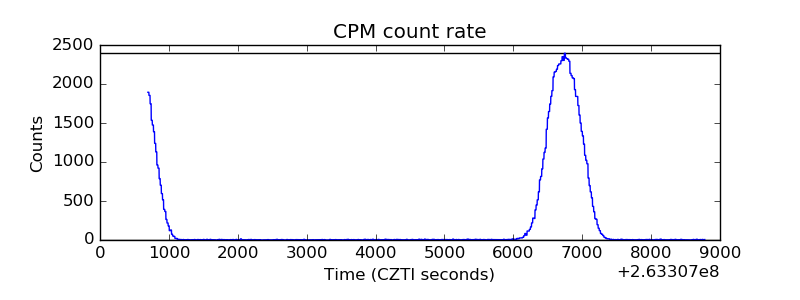 |
| CZT Counter | 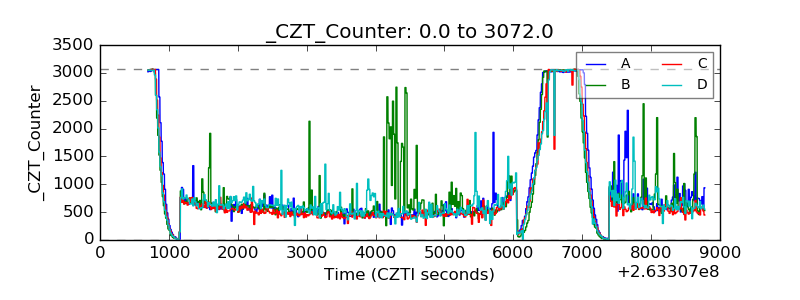 |
| +2.5 Volts monitor |  |
| +5 Volts monitor |  |
| _ROLL_ROT | 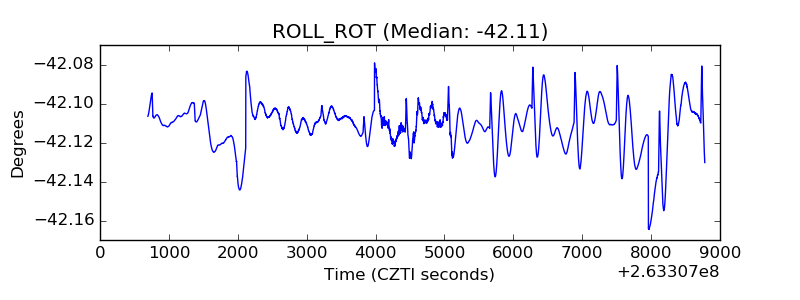 |
| _Roll_DEC | 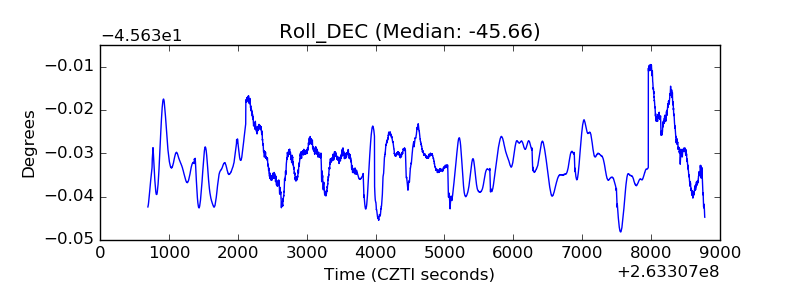 |
| _Roll_RA | 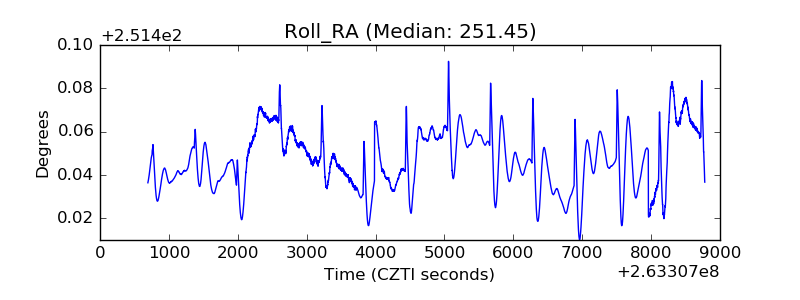 |
| Veto Counter | 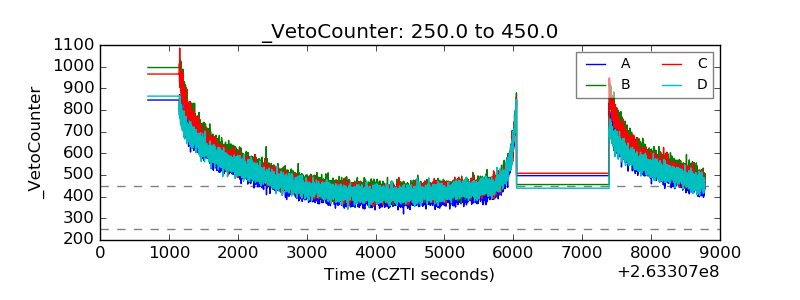 |