| Param | Original file | Final file |
|---|---|---|
| Filename | modeM0/AS1G08_022T01_9000002078_14084cztM0_level2.evt | modeM0/AS1G08_022T01_9000002078_14084cztM0_level2_quad_clean.evt |
| Size (bytes) | 521,078,400 | 98,380,800 |
| Size | 496.9 MB | 93.8 MB |
| Events in quadrant A | 3,791,503 | 659,471 |
| Events in quadrant B | 4,486,469 | 650,405 |
| Events in quadrant C | 3,122,679 | 630,350 |
| Events in quadrant D | 3,958,037 | 604,665 |
| Mode SS | |||
|---|---|---|---|
| Quadrant | BADHDUFLAG | Total packets | Discarded packets |
| A | 0 | 128 | 0 |
| B | 0 | 128 | 0 |
| C | 0 | 128 | 0 |
| D | 0 | 128 | 0 |
| Mode M9 | |||
|---|---|---|---|
| Quadrant | BADHDUFLAG | Total packets | Discarded packets |
| A | 0 | 15 | 0 |
| B | 0 | 15 | 0 |
| C | 0 | 15 | 0 |
| D | 0 | 16 | 0 |
| Mode M0 | |||
|---|---|---|---|
| Quadrant | BADHDUFLAG | Total packets | Discarded packets |
| A | 0 | 15408 | 3 |
| B | 0 | 17435 | 2 |
| C | 0 | 13161 | 2 |
| D | 0 | 15972 | 2 |
| Quadrant | Total seconds | Saturated seconds | Saturation percentage |
|---|---|---|---|
| A | 6219 | 132 | 2.122528% |
| B | 6219 | 503 | 8.088117% |
| C | 6219 | 49 | 0.787908% |
| D | 6219 | 147 | 2.363724% |
Noise dominated data is calculated using 1-second bins in cleaned event files. If a bin has >2000 counts, and if more than 50% of those come from <1% of pixels, then it is considered to be noise-dominated and hence unusable.
| Quadrant | # 1 sec bins | Bins with >0 counts | Bins with >2000 counts | High rate bins dominated by noise | Noise dominated (total time) | Noise dominated (detector-on time) | Marked lightcurve |
|---|---|---|---|---|---|---|---|
| A | 7555 | 6221 | 21 | 21 | 0.28% | 0.34% | 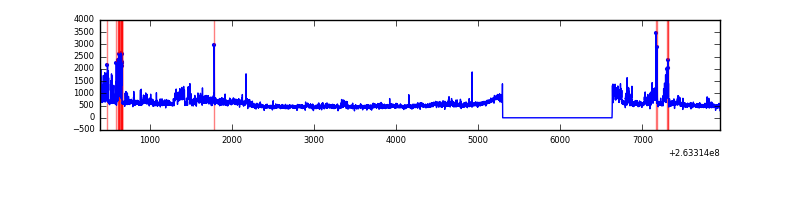 |
| B | 7555 | 6221 | 291 | 291 | 3.85% | 4.68% | 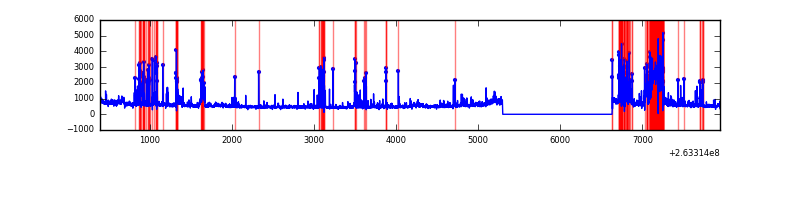 |
| C | 7555 | 6221 | 1 | 1 | 0.01% | 0.02% | 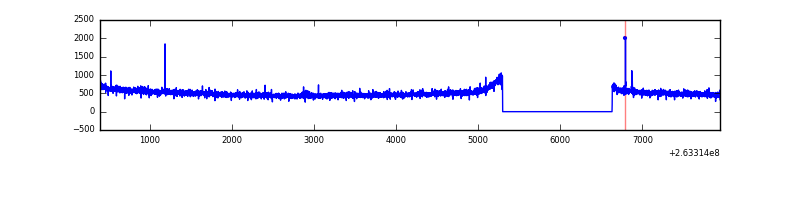 |
| D | 7555 | 6221 | 74 | 74 | 0.98% | 1.19% | 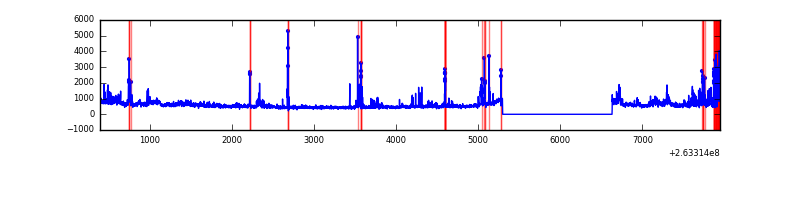 |
Top three noisy pixels from each quadrant. If the there are fewer than three noisy pixels in the level2.evt file, extra rows are filled as -1
| Pixel properties | Quadrant properties | ||||||
|---|---|---|---|---|---|---|---|
| Quadrant | DetID | PixID | Counts | Sigma | Mean | Median | Sigma |
| A | 15 | 222 | 478733 | 2927.96 | 823 | 808 | 163.2 |
| A | 12 | 189 | 92074 | 559.13 | 823 | 808 | 163.2 |
| A | 9 | 143 | 39603 | 237.67 | 823 | 808 | 163.2 |
| B | 10 | 16 | 1178296 | 8032.48 | 791 | 775 | 146.6 |
| B | 10 | 245 | 100643 | 681.25 | 791 | 775 | 146.6 |
| B | 0 | 189 | 33740 | 224.87 | 791 | 775 | 146.6 |
| C | 3 | 233 | 49256 | 270.51 | 786 | 791 | 179.2 |
| C | 0 | 207 | 10803 | 55.88 | 786 | 791 | 179.2 |
| C | 13 | 61 | 5737 | 27.61 | 786 | 791 | 179.2 |
| D | 1 | 52 | 736502 | 4052.77 | 774 | 757 | 181.5 |
| D | 10 | 157 | 80351 | 438.44 | 774 | 757 | 181.5 |
| D | 2 | 152 | 63666 | 346.53 | 774 | 757 | 181.5 |
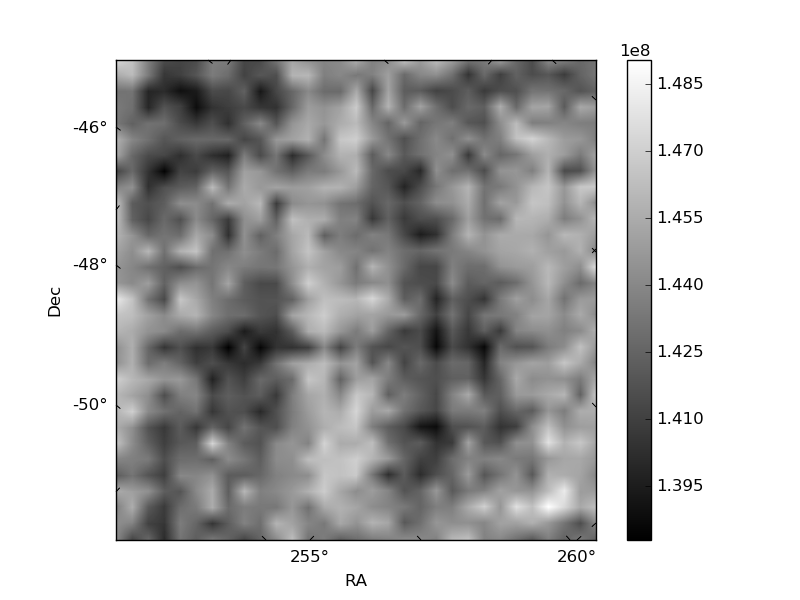
Histogram calculated using DETX and DETY for each event in the final _common_clean file
| Quadrant A |  |
 |
Quadrant B |
|---|---|---|---|
| Quadrant D |  |
 |
Quadrant C |
| Plot type | Count rate plots | Images |
|---|---|---|
| Comparison with Poisson distribution Blue bars denote a histogram of data divided into 1 sec bins. Red curve is a Poisson curve with rate = median count rate of data. |
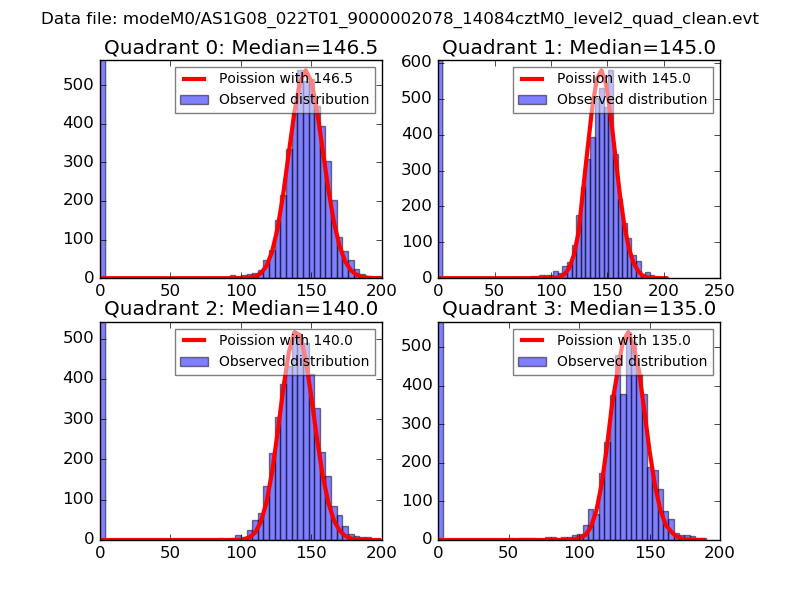 |
 |
| Quadrant-wise count rates Data is divided into 100 sec bins |
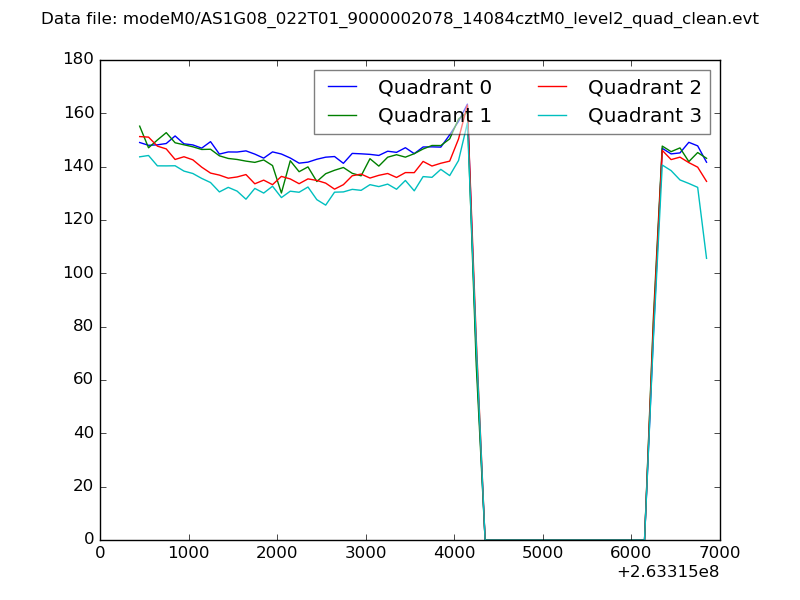 |
|
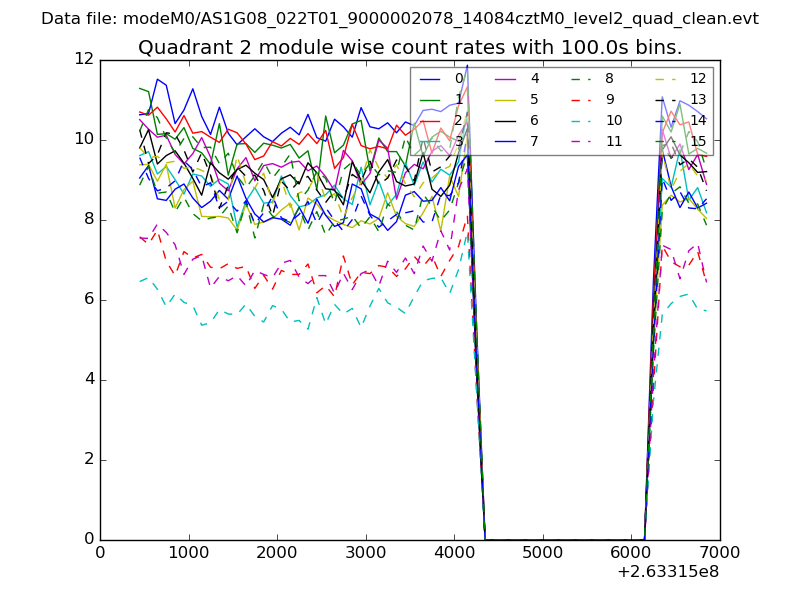
| Module-wise count rates for Quadrant A Data is divided into 100 sec bins |
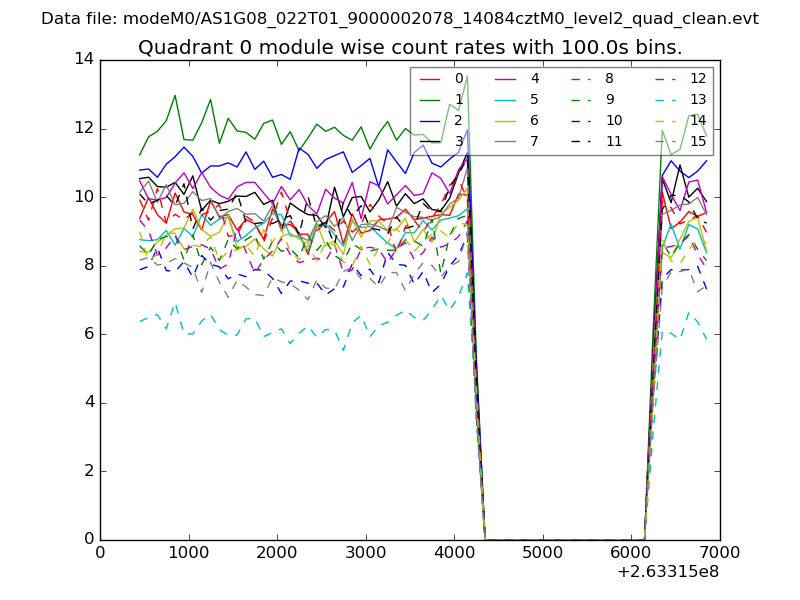 |
 |
| Module-wise count rates for Quadrant B Data is divided into 100 sec bins |
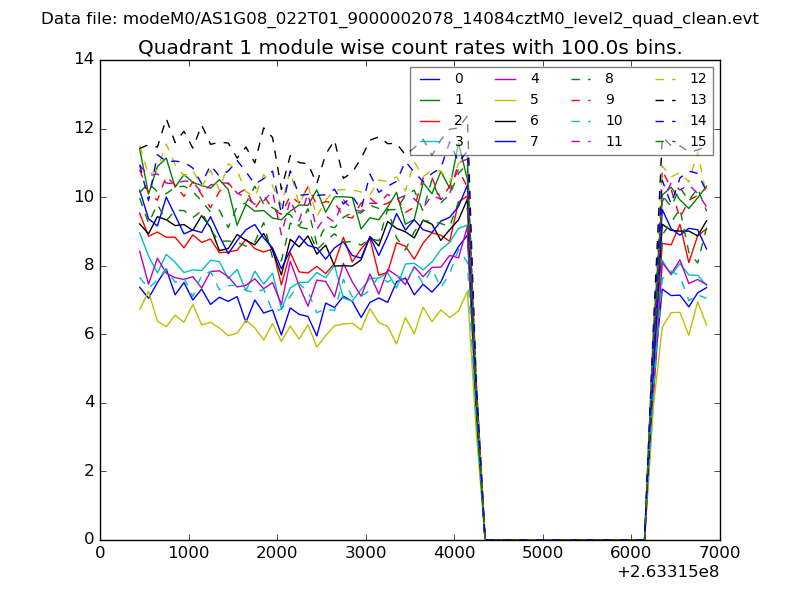 |
 |
| Module-wise count rates for Quadrant C Data is divided into 100 sec bins |
 |
 |
| Module-wise count rates for Quadrant D Data is divided into 100 sec bins |
 |
 |
| Parameter | Plot |
|---|---|
| CZT HV Monitor | 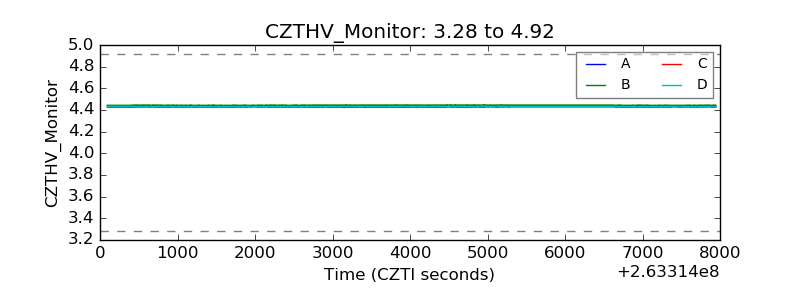 |
| D_VDD |  |
| Temperature 1 |  |
| Veto HV Monitor |  |
| Veto LLD |  |
| Alpha Counter | 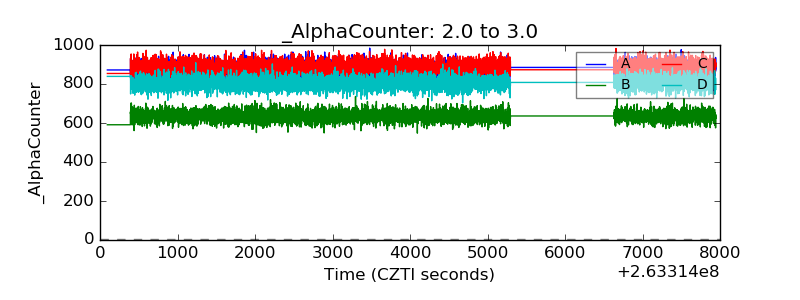 |
| _CPM_Rate | 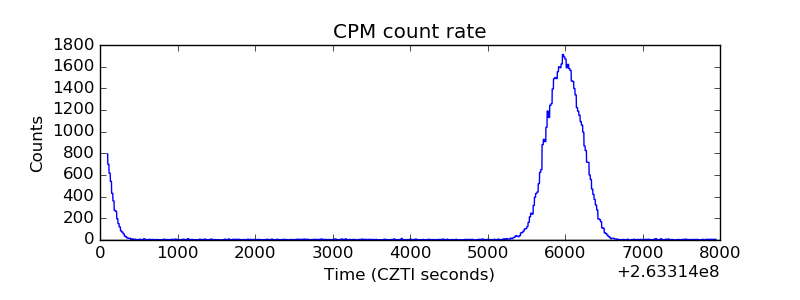 |
| CZT Counter |  |
| +2.5 Volts monitor |  |
| +5 Volts monitor |  |
| _ROLL_ROT |  |
| _Roll_DEC |  |
| _Roll_RA |  |
| Veto Counter |  |