| Param | Original file | Final file |
|---|---|---|
| Filename | modeM0/AS1G08_022T01_9000002078_14085cztM0_level2.evt | modeM0/AS1G08_022T01_9000002078_14085cztM0_level2_quad_clean.evt |
| Size (bytes) | 554,682,240 | 100,255,680 |
| Size | 529.0 MB | 95.6 MB |
| Events in quadrant A | 3,440,530 | 689,554 |
| Events in quadrant B | 5,445,187 | 622,755 |
| Events in quadrant C | 3,059,232 | 659,295 |
| Events in quadrant D | 4,419,561 | 617,657 |
| Mode SS | |||
|---|---|---|---|
| Quadrant | BADHDUFLAG | Total packets | Discarded packets |
| A | 0 | 130 | 0 |
| B | 0 | 130 | 0 |
| C | 0 | 130 | 0 |
| D | 0 | 130 | 0 |
| Mode M9 | |||
|---|---|---|---|
| Quadrant | BADHDUFLAG | Total packets | Discarded packets |
| A | 0 | 12 | 0 |
| B | 0 | 12 | 0 |
| C | 0 | 12 | 0 |
| D | 0 | 13 | 0 |
| Mode M0 | |||
|---|---|---|---|
| Quadrant | BADHDUFLAG | Total packets | Discarded packets |
| A | 0 | 14344 | 3 |
| B | 0 | 20305 | 2 |
| C | 0 | 13274 | 2 |
| D | 0 | 17327 | 2 |
| Quadrant | Total seconds | Saturated seconds | Saturation percentage |
|---|---|---|---|
| A | 6402 | 94 | 1.468291% |
| B | 6402 | 956 | 14.932833% |
| C | 6402 | 29 | 0.452983% |
| D | 6402 | 281 | 4.389253% |
Noise dominated data is calculated using 1-second bins in cleaned event files. If a bin has >2000 counts, and if more than 50% of those come from <1% of pixels, then it is considered to be noise-dominated and hence unusable.
| Quadrant | # 1 sec bins | Bins with >0 counts | Bins with >2000 counts | High rate bins dominated by noise | Noise dominated (total time) | Noise dominated (detector-on time) | Marked lightcurve |
|---|---|---|---|---|---|---|---|
| A | 7548 | 6404 | 15 | 15 | 0.20% | 0.23% | 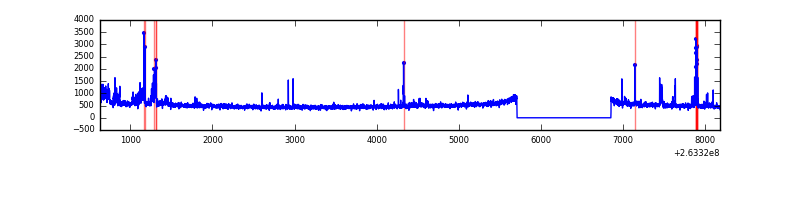 |
| B | 7548 | 6404 | 693 | 693 | 9.18% | 10.82% | 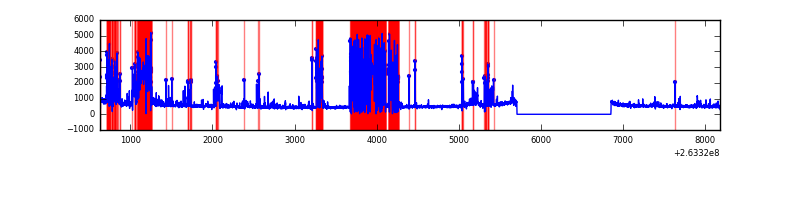 |
| C | 7548 | 6404 | 1 | 1 | 0.01% | 0.02% | 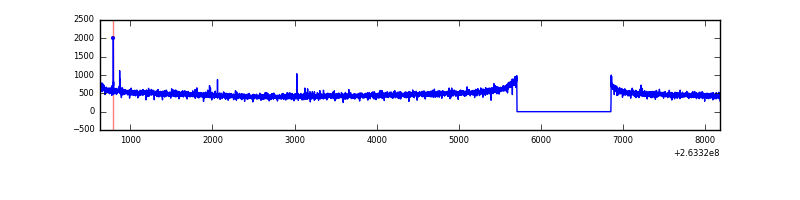 |
| D | 7548 | 6404 | 227 | 227 | 3.01% | 3.54% | 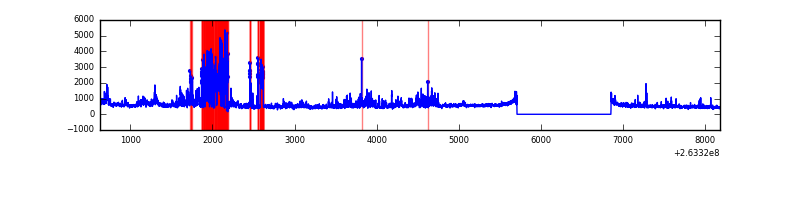 |
Top three noisy pixels from each quadrant. If the there are fewer than three noisy pixels in the level2.evt file, extra rows are filled as -1
| Pixel properties | Quadrant properties | ||||||
|---|---|---|---|---|---|---|---|
| Quadrant | DetID | PixID | Counts | Sigma | Mean | Median | Sigma |
| A | 15 | 222 | 162994 | 987.23 | 811 | 794 | 164.3 |
| A | 9 | 143 | 115769 | 699.8 | 811 | 794 | 164.3 |
| A | 12 | 189 | 27243 | 160.98 | 811 | 794 | 164.3 |
| B | 10 | 16 | 2389876 | 17267.19 | 739 | 722 | 138.4 |
| B | 0 | 189 | 36822 | 260.91 | 739 | 722 | 138.4 |
| B | 0 | 219 | 26640 | 187.32 | 739 | 722 | 138.4 |
| C | 3 | 233 | 24708 | 134.72 | 776 | 780 | 177.6 |
| C | 0 | 207 | 7619 | 38.5 | 776 | 780 | 177.6 |
| C | 13 | 61 | 5662 | 27.48 | 776 | 780 | 177.6 |
| D | 1 | 52 | 1178234 | 6565.11 | 756 | 735 | 179.4 |
| D | 15 | 0 | 128376 | 711.66 | 756 | 735 | 179.4 |
| D | 8 | 195 | 103285 | 571.76 | 756 | 735 | 179.4 |
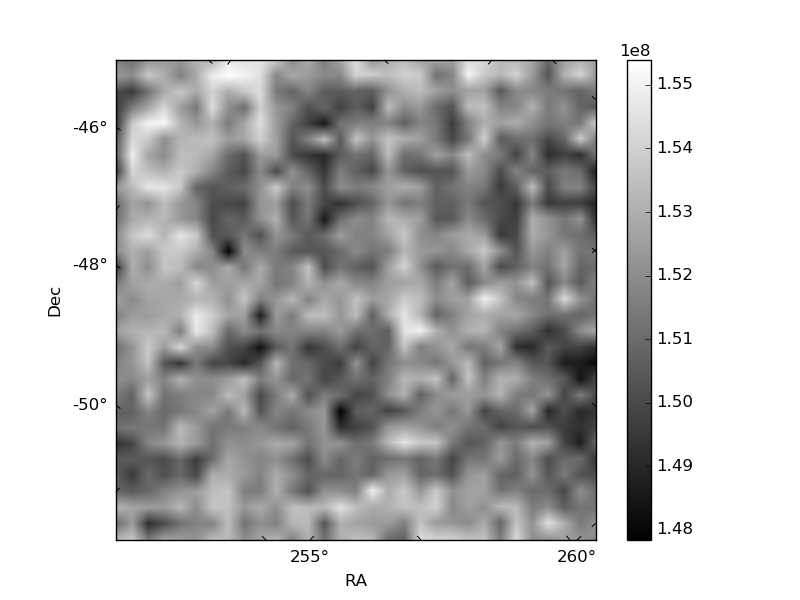
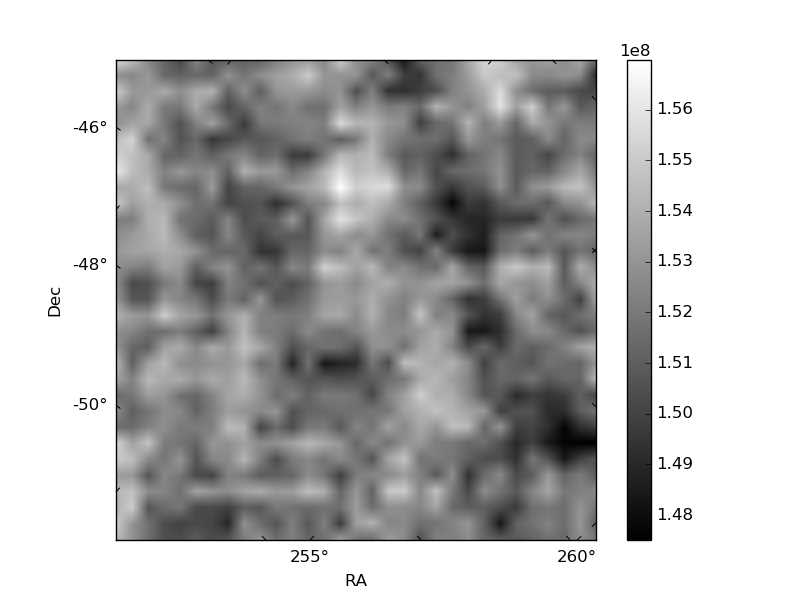
Histogram calculated using DETX and DETY for each event in the final _common_clean file
| Quadrant A |  |
 |
Quadrant B |
|---|---|---|---|
| Quadrant D |  |
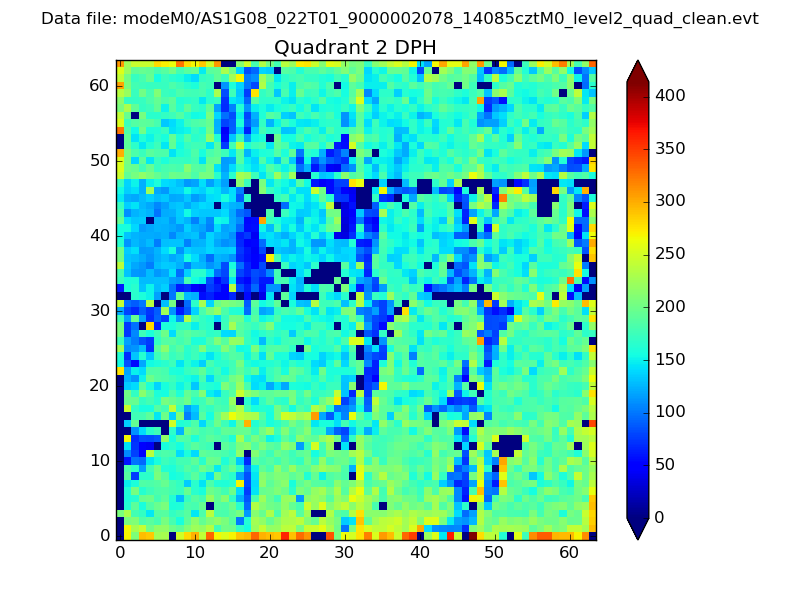 |
Quadrant C |
| Plot type | Count rate plots | Images |
|---|---|---|
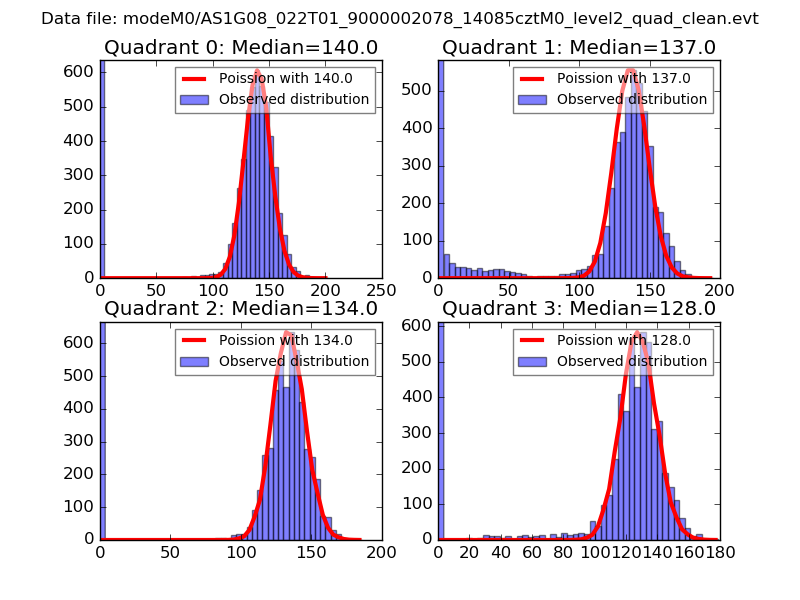
| Comparison with Poisson distribution Blue bars denote a histogram of data divided into 1 sec bins. Red curve is a Poisson curve with rate = median count rate of data. |
 |
 |
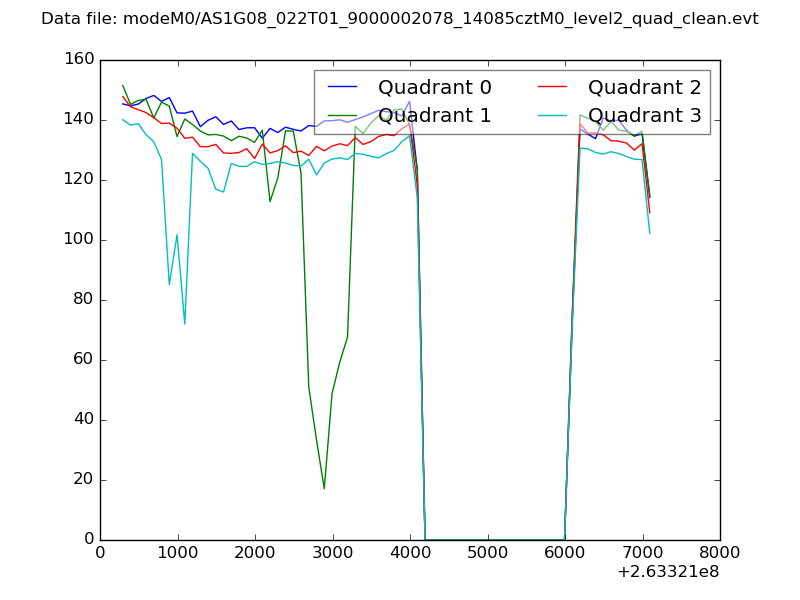
| Quadrant-wise count rates Data is divided into 100 sec bins |
 |
|
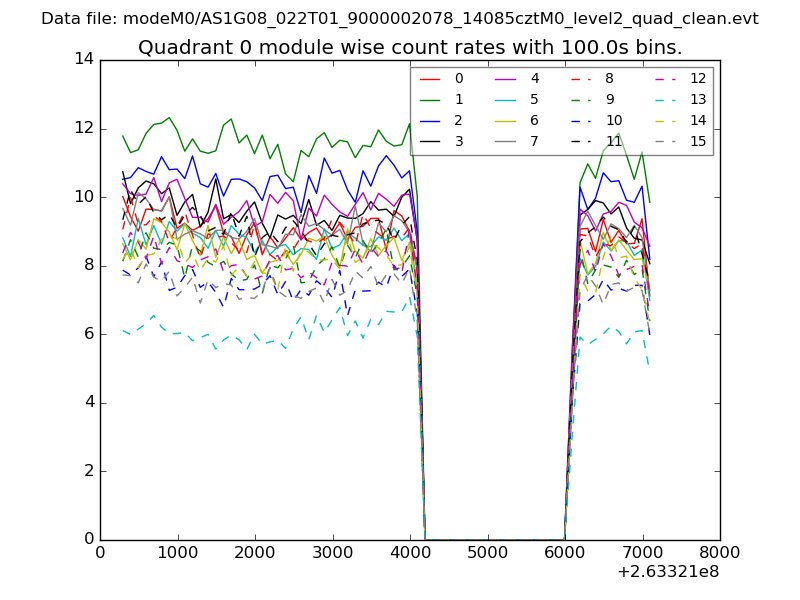
| Module-wise count rates for Quadrant A Data is divided into 100 sec bins |
 |
 |
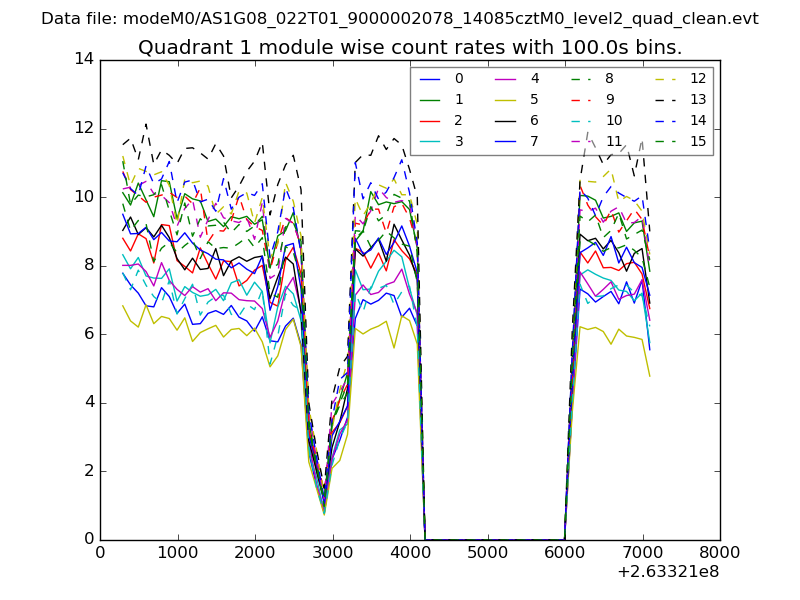
| Module-wise count rates for Quadrant B Data is divided into 100 sec bins |
 |
 |
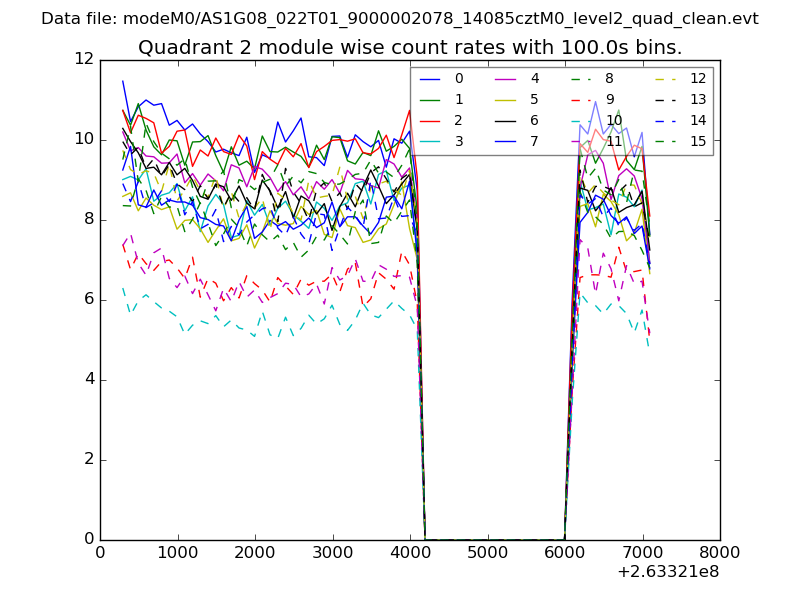
| Module-wise count rates for Quadrant C Data is divided into 100 sec bins |
 |
 |
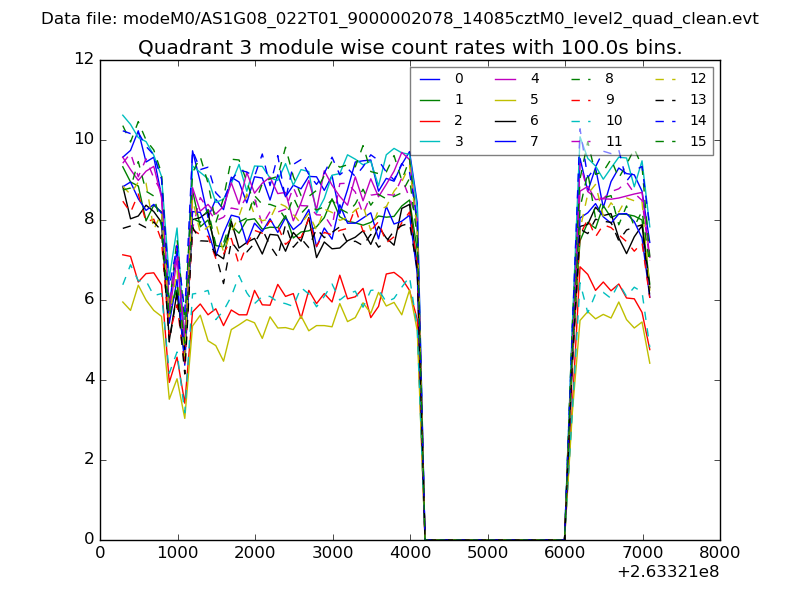
| Module-wise count rates for Quadrant D Data is divided into 100 sec bins |
 |
 |
| Parameter | Plot |
|---|---|
| CZT HV Monitor | 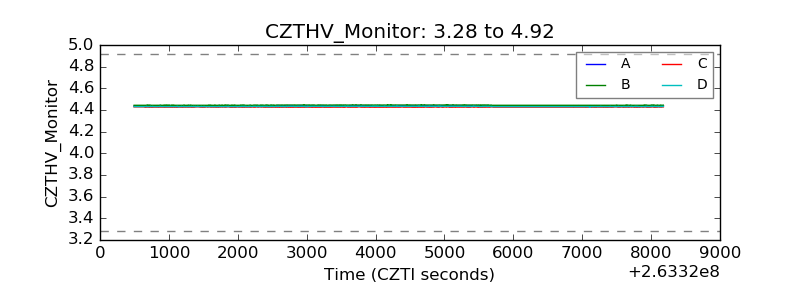 |
| D_VDD | 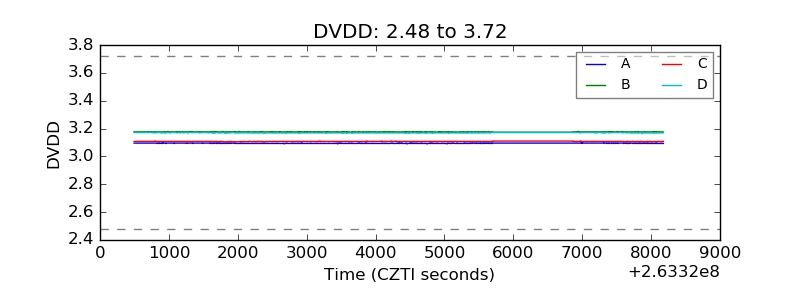 |
| Temperature 1 | 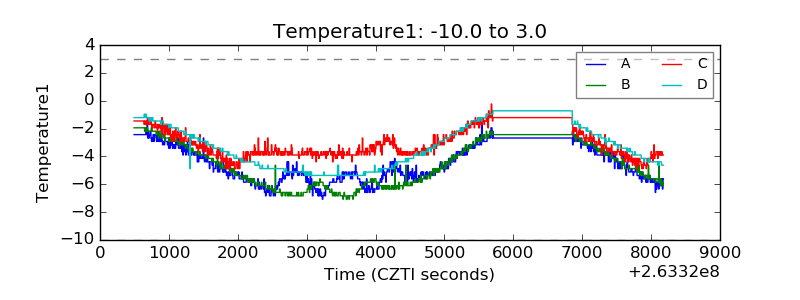 |
| Veto HV Monitor |  |
| Veto LLD |  |
| Alpha Counter | 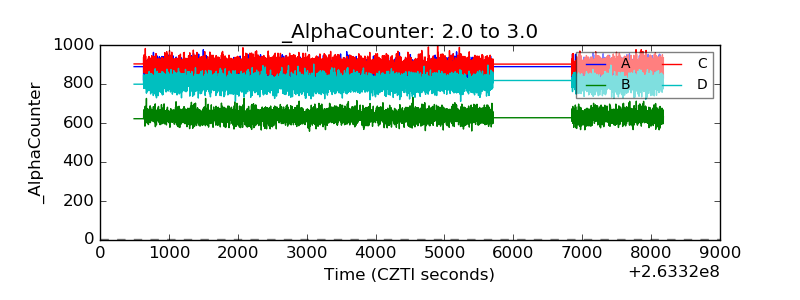 |
| _CPM_Rate | 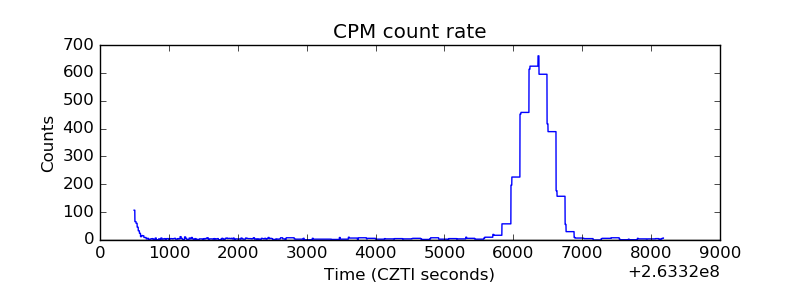 |
| CZT Counter | 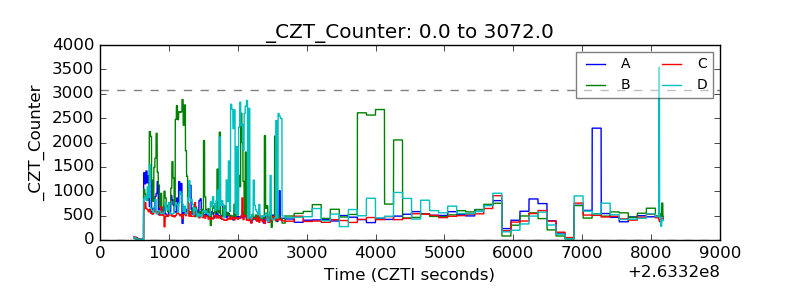 |
| +2.5 Volts monitor |  |
| +5 Volts monitor | 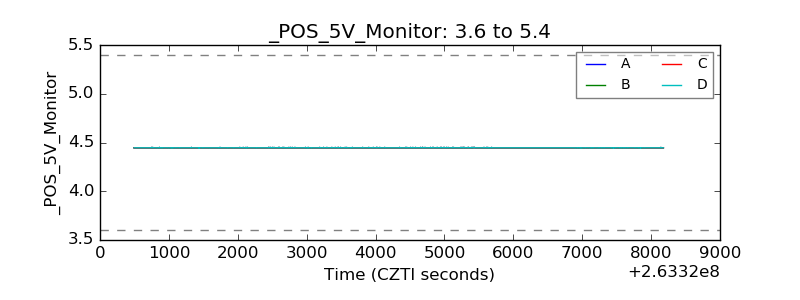 |
| _ROLL_ROT | 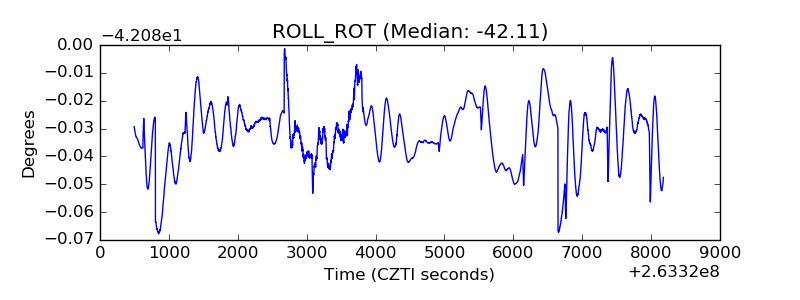 |
| _Roll_DEC | 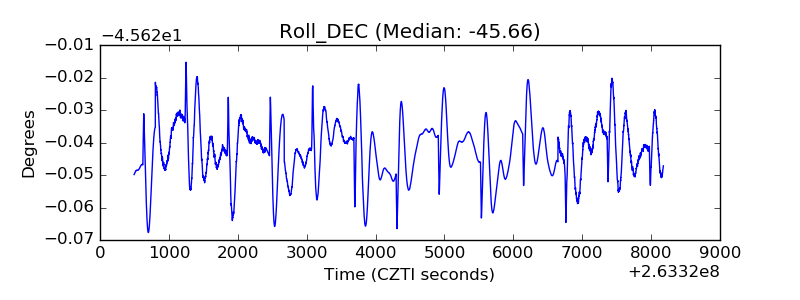 |
| _Roll_RA | 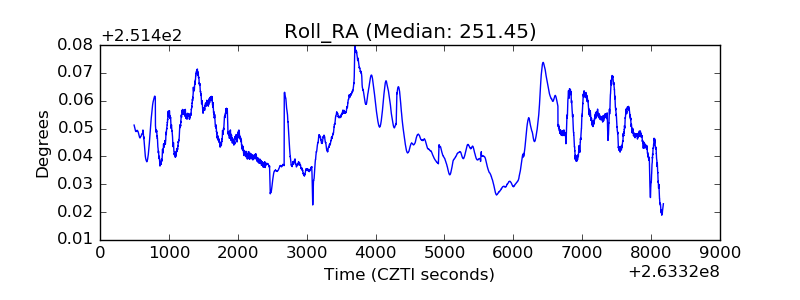 |
| Veto Counter | 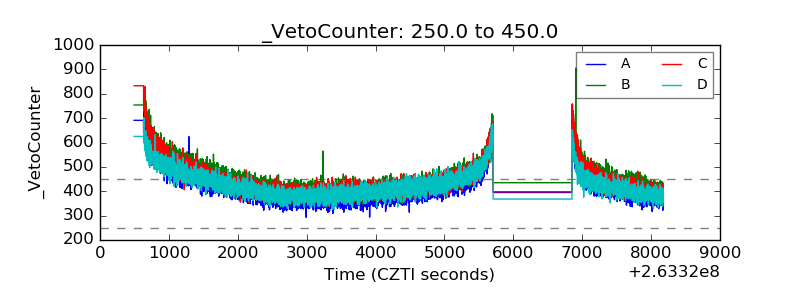 |