| Param | Original file | Final file |
|---|---|---|
| Filename | modeM0/AS1G08_022T01_9000002078_14086cztM0_level2.evt | modeM0/AS1G08_022T01_9000002078_14086cztM0_level2_quad_clean.evt |
| Size (bytes) | 527,627,520 | 104,397,120 |
| Size | 503.2 MB | 99.6 MB |
| Events in quadrant A | 3,457,273 | 700,548 |
| Events in quadrant B | 5,382,941 | 668,685 |
| Events in quadrant C | 3,157,605 | 671,127 |
| Events in quadrant D | 3,520,412 | 647,718 |
| Mode SS | |||
|---|---|---|---|
| Quadrant | BADHDUFLAG | Total packets | Discarded packets |
| A | 0 | 138 | 0 |
| B | 0 | 138 | 0 |
| C | 0 | 138 | 0 |
| D | 0 | 138 | 0 |
| Mode M9 | |||
|---|---|---|---|
| Quadrant | BADHDUFLAG | Total packets | Discarded packets |
| A | 0 | 16 | 0 |
| B | 0 | 16 | 0 |
| C | 0 | 16 | 0 |
| D | 0 | 17 | 0 |
| Mode M0 | |||
|---|---|---|---|
| Quadrant | BADHDUFLAG | Total packets | Discarded packets |
| A | 0 | 14744 | 3 |
| B | 0 | 20464 | 2 |
| C | 0 | 13965 | 2 |
| D | 0 | 15090 | 2 |
| Quadrant | Total seconds | Saturated seconds | Saturation percentage |
|---|---|---|---|
| A | 6794 | 75 | 1.103915% |
| B | 6794 | 647 | 9.523109% |
| C | 6794 | 17 | 0.250221% |
| D | 6794 | 43 | 0.632911% |
Noise dominated data is calculated using 1-second bins in cleaned event files. If a bin has >2000 counts, and if more than 50% of those come from <1% of pixels, then it is considered to be noise-dominated and hence unusable.
| Quadrant | # 1 sec bins | Bins with >0 counts | Bins with >2000 counts | High rate bins dominated by noise | Noise dominated (total time) | Noise dominated (detector-on time) | Marked lightcurve |
|---|---|---|---|---|---|---|---|
| A | 7590 | 6796 | 20 | 20 | 0.26% | 0.29% | 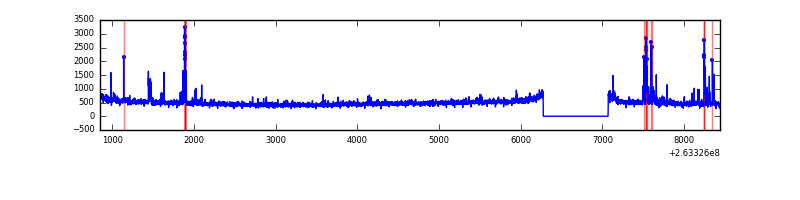 |
| B | 7590 | 6796 | 389 | 389 | 5.13% | 5.72% | 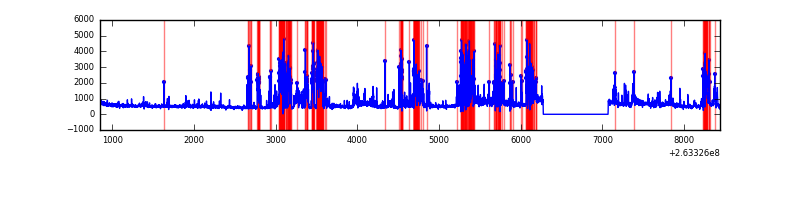 |
| C | 7590 | 6796 | 0 | 0 | 0.00% | 0.00% | 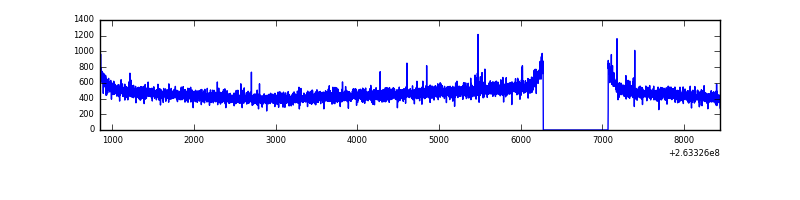 |
| D | 7590 | 6796 | 26 | 26 | 0.34% | 0.38% | 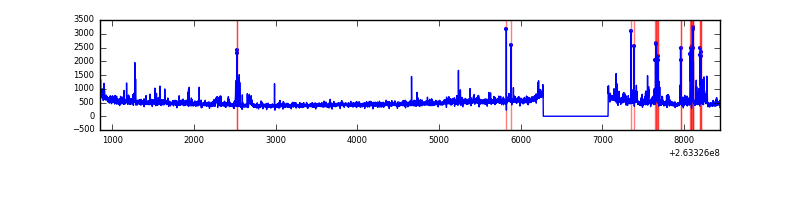 |
Top three noisy pixels from each quadrant. If the there are fewer than three noisy pixels in the level2.evt file, extra rows are filled as -1
| Pixel properties | Quadrant properties | ||||||
|---|---|---|---|---|---|---|---|
| Quadrant | DetID | PixID | Counts | Sigma | Mean | Median | Sigma |
| A | 9 | 143 | 152734 | 903.07 | 827 | 810 | 168.2 |
| A | 12 | 189 | 56362 | 330.22 | 827 | 810 | 168.2 |
| A | 12 | 96 | 43922 | 256.27 | 827 | 810 | 168.2 |
| B | 10 | 16 | 2071670 | 13689.95 | 799 | 778 | 151.3 |
| B | 0 | 189 | 60517 | 394.91 | 799 | 778 | 151.3 |
| B | 0 | 219 | 33990 | 219.55 | 799 | 778 | 151.3 |
| C | 3 | 233 | 33625 | 177.18 | 799 | 803 | 185.2 |
| C | 0 | 207 | 7757 | 37.54 | 799 | 803 | 185.2 |
| C | 13 | 61 | 5680 | 26.33 | 799 | 803 | 185.2 |
| D | 1 | 52 | 266563 | 1401.15 | 788 | 769 | 189.7 |
| D | 8 | 195 | 98287 | 514.07 | 788 | 769 | 189.7 |
| D | 2 | 152 | 44570 | 230.9 | 788 | 769 | 189.7 |
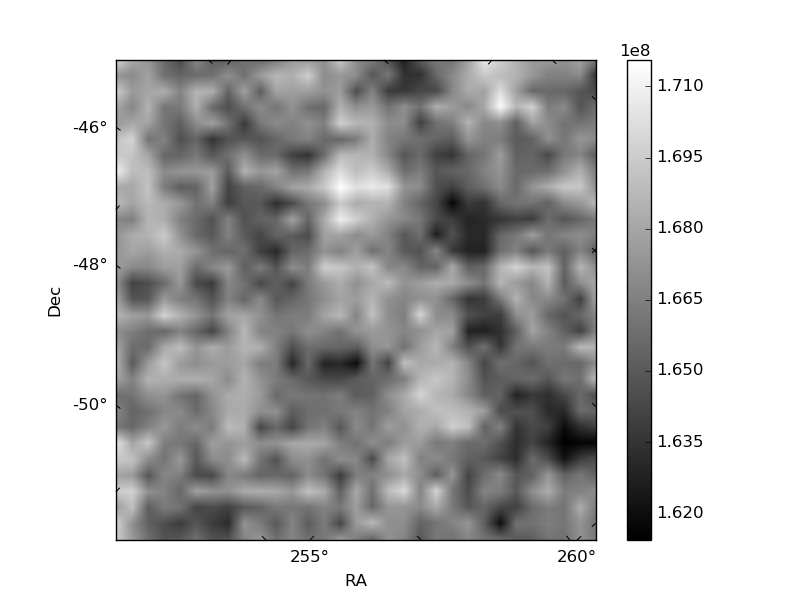
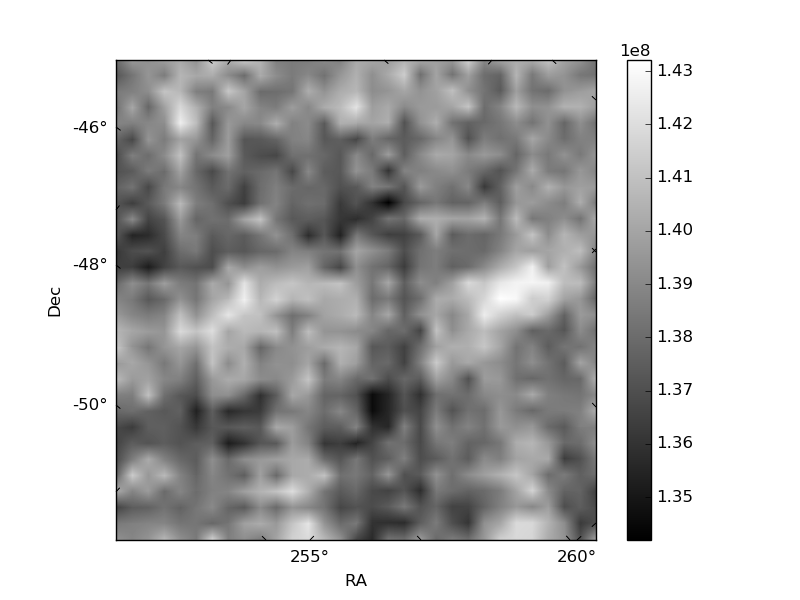
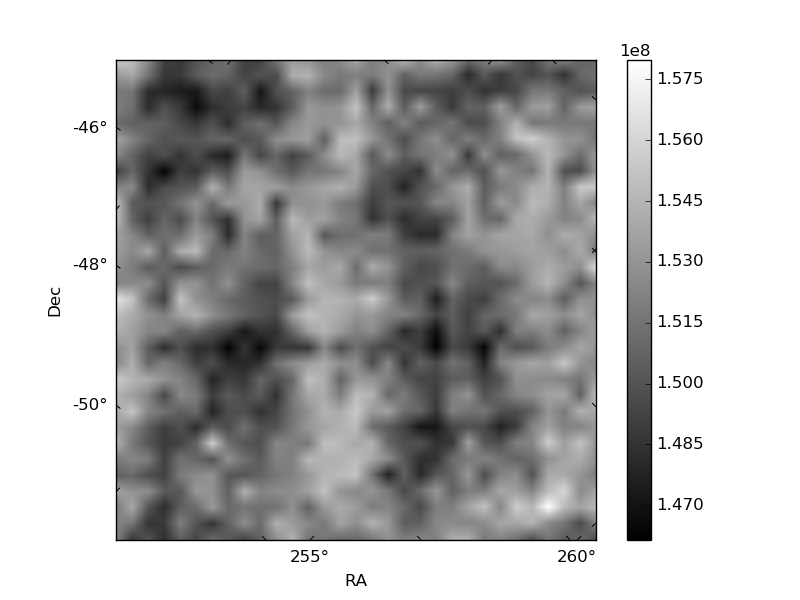
Histogram calculated using DETX and DETY for each event in the final _common_clean file
| Quadrant A | 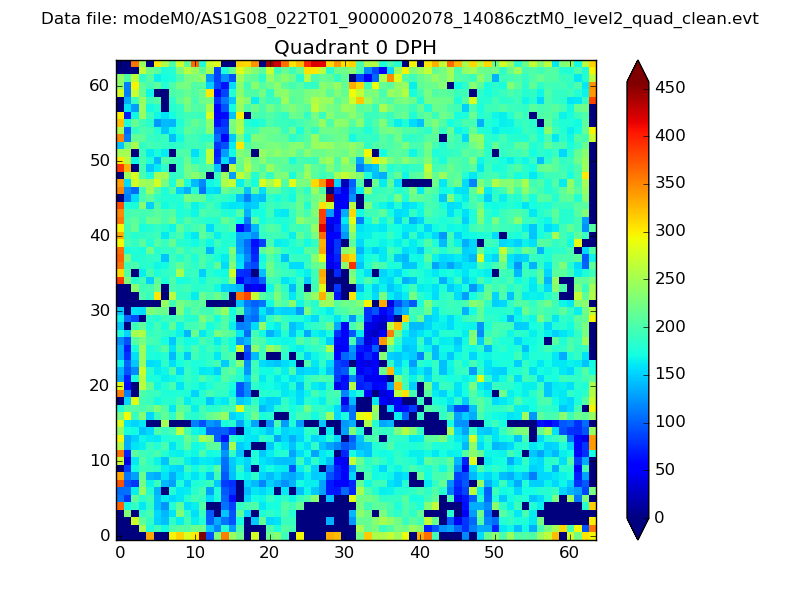 |
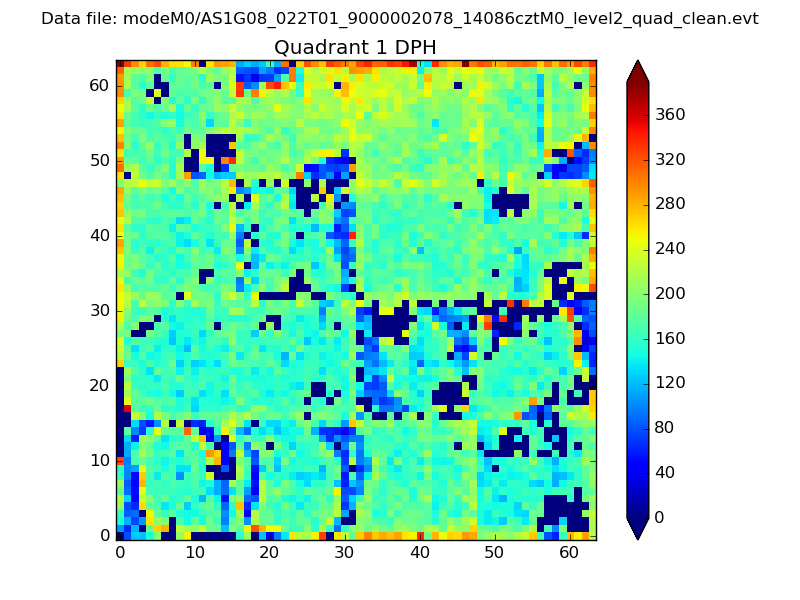 |
Quadrant B |
|---|---|---|---|
| Quadrant D | 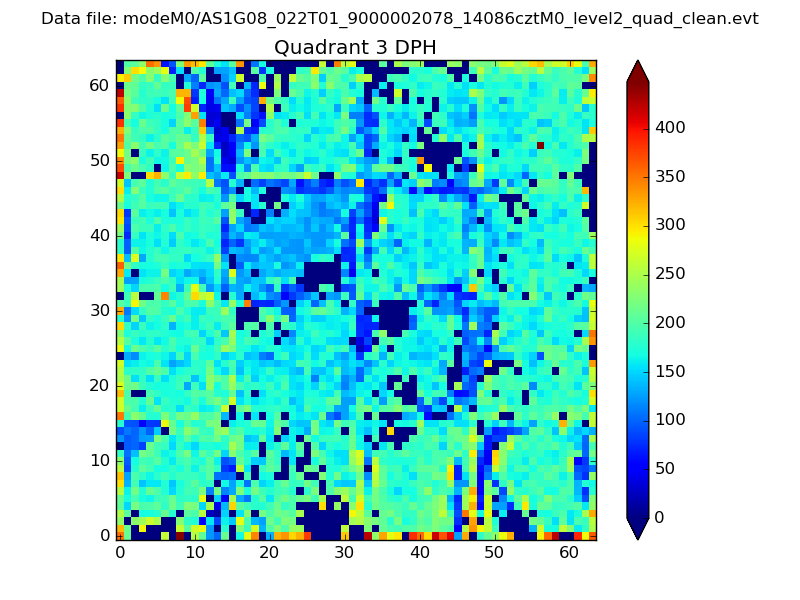 |
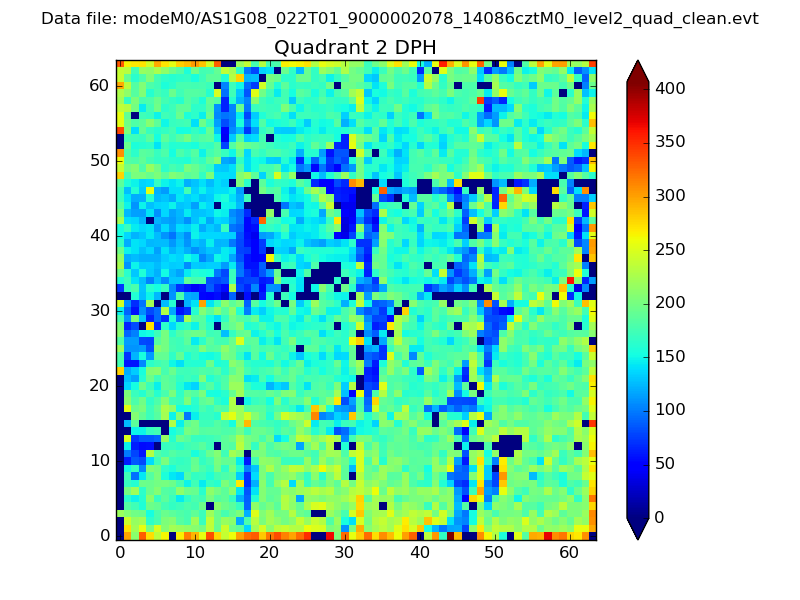 |
Quadrant C |
| Plot type | Count rate plots | Images |
|---|---|---|
| Comparison with Poisson distribution Blue bars denote a histogram of data divided into 1 sec bins. Red curve is a Poisson curve with rate = median count rate of data. |
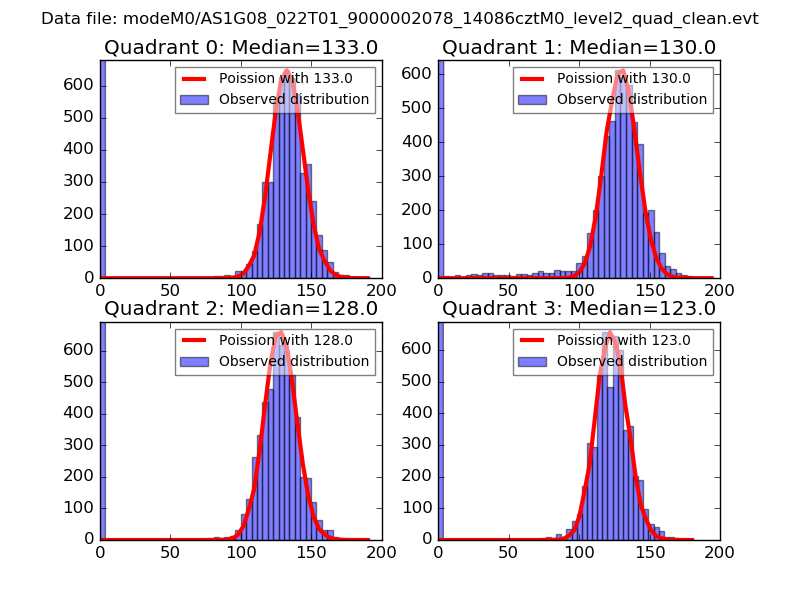 |
 |
| Quadrant-wise count rates Data is divided into 100 sec bins |
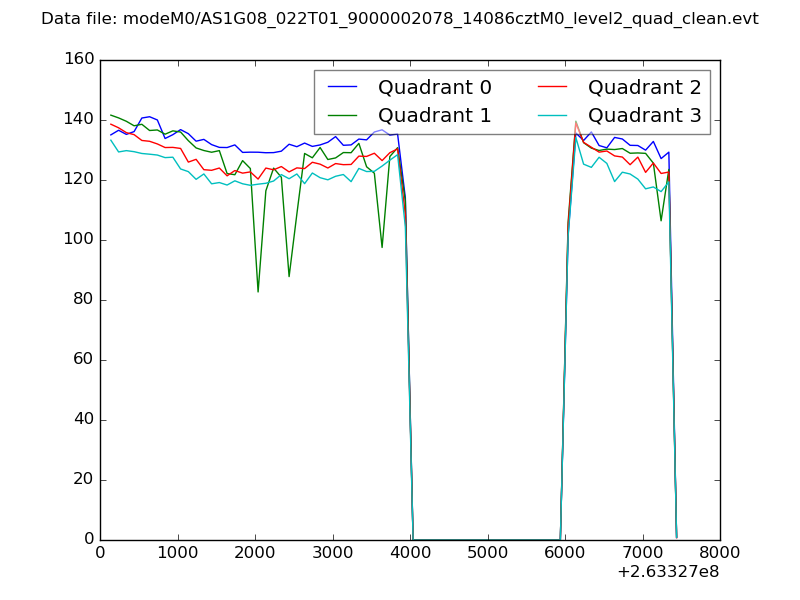 |
|
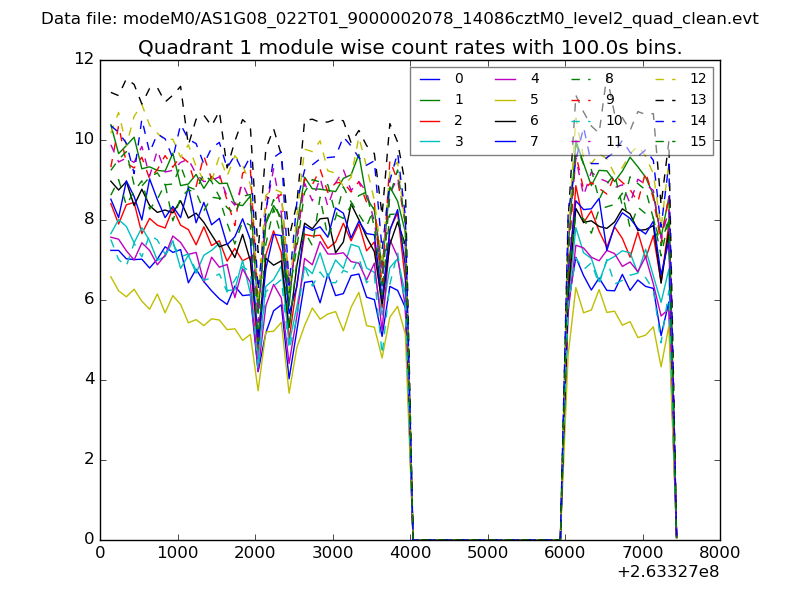
| Module-wise count rates for Quadrant A Data is divided into 100 sec bins |
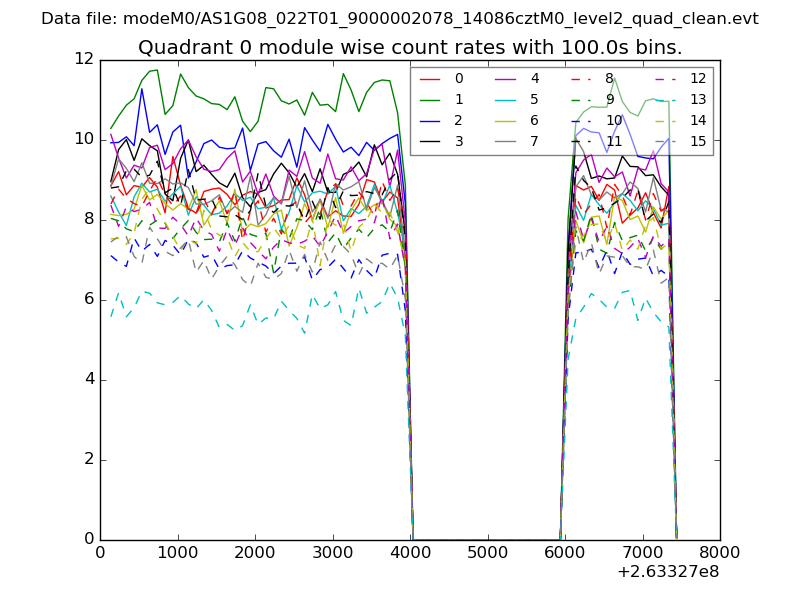 |
 |
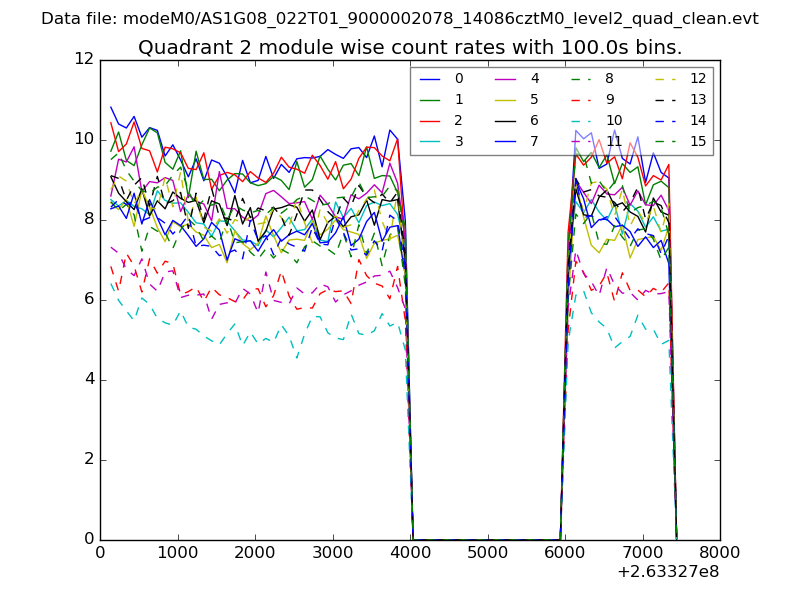
| Module-wise count rates for Quadrant B Data is divided into 100 sec bins |
 |
 |
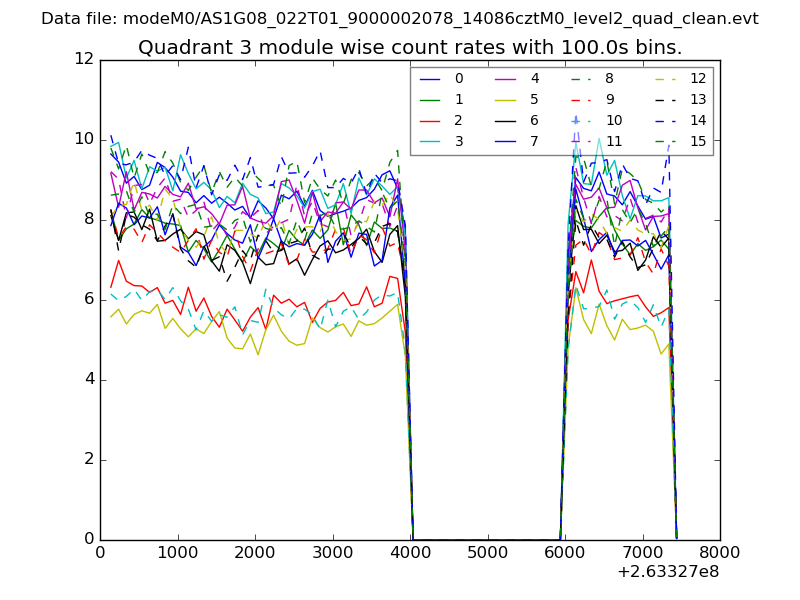
| Module-wise count rates for Quadrant C Data is divided into 100 sec bins |
 |
 |
| Module-wise count rates for Quadrant D Data is divided into 100 sec bins |
 |
 |
| Parameter | Plot |
|---|---|
| CZT HV Monitor | 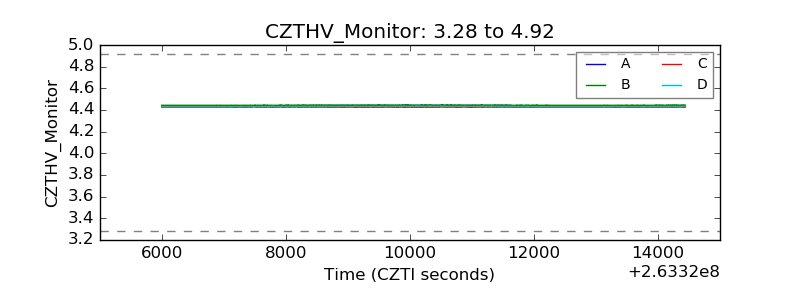 |
| D_VDD | 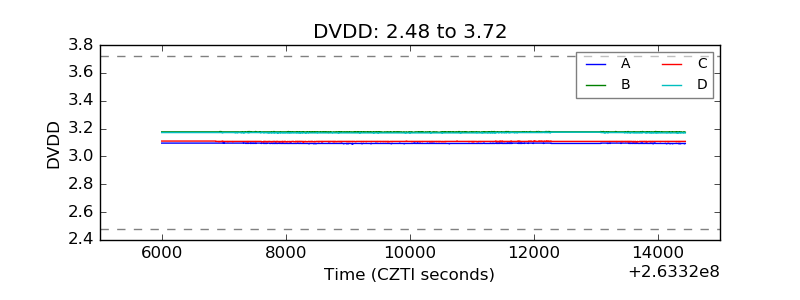 |
| Temperature 1 | 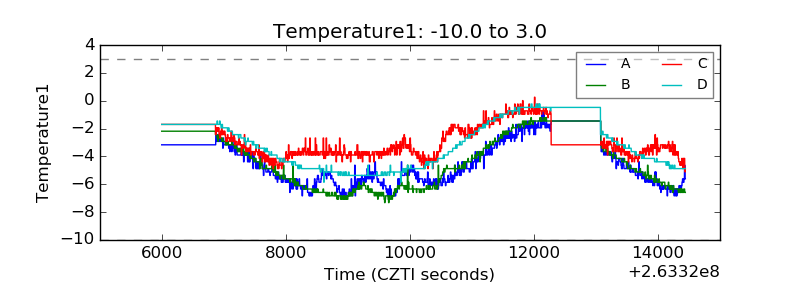 |
| Veto HV Monitor | 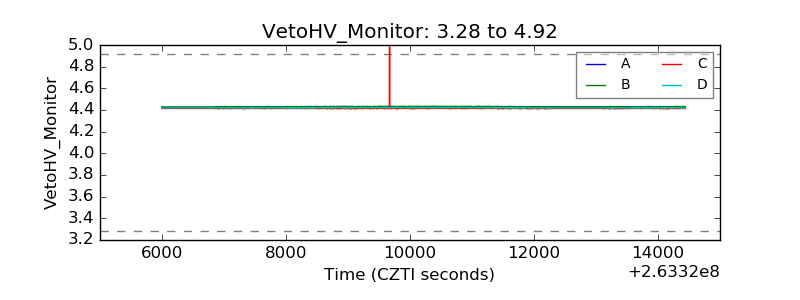 |
| Veto LLD | 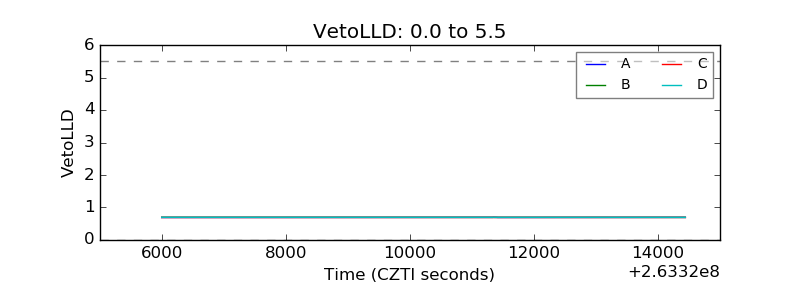 |
| Alpha Counter |  |
| _CPM_Rate |  |
| CZT Counter | 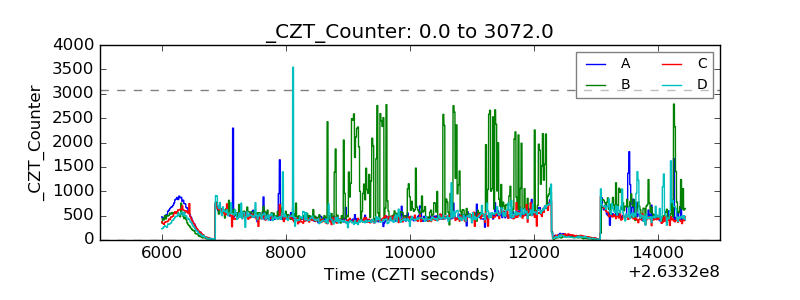 |
| +2.5 Volts monitor |  |
| +5 Volts monitor |  |
| _ROLL_ROT | 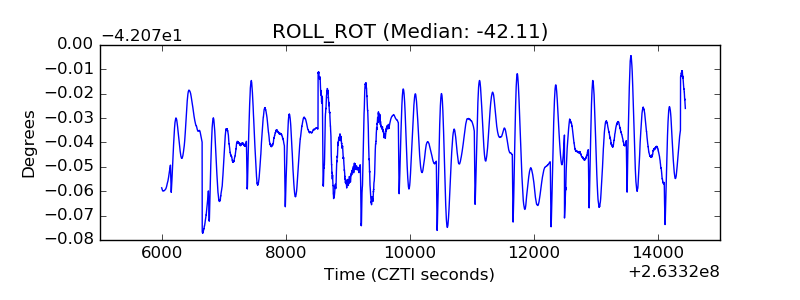 |
| _Roll_DEC | 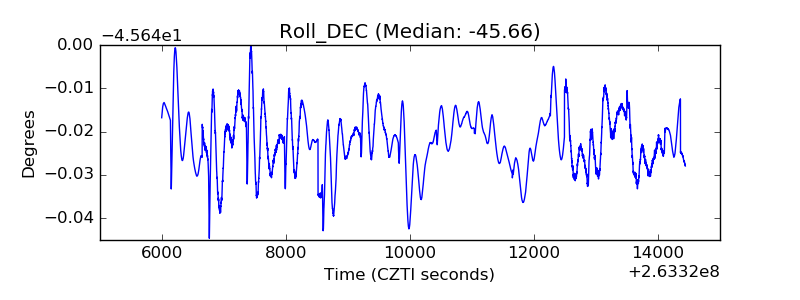 |
| _Roll_RA |  |
| Veto Counter | 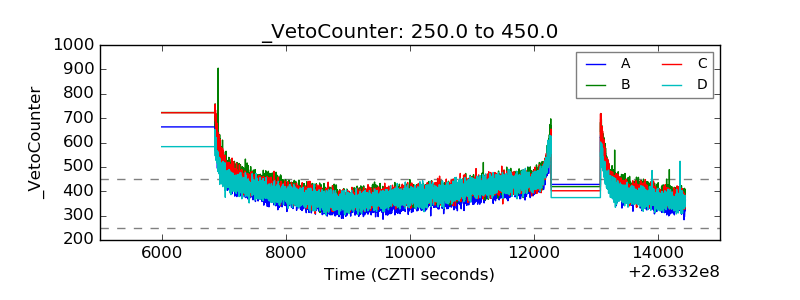 |