| Param | Original file | Final file |
|---|---|---|
| Filename | modeM0/AS1G08_022T01_9000002078_14087cztM0_level2.evt | modeM0/AS1G08_022T01_9000002078_14087cztM0_level2_quad_clean.evt |
| Size (bytes) | 635,941,440 | 105,946,560 |
| Size | 606.5 MB | 101.0 MB |
| Events in quadrant A | 3,859,448 | 702,503 |
| Events in quadrant B | 5,282,242 | 689,513 |
| Events in quadrant C | 3,488,011 | 671,632 |
| Events in quadrant D | 6,124,574 | 625,588 |
| Mode SS | |||
|---|---|---|---|
| Quadrant | BADHDUFLAG | Total packets | Discarded packets |
| A | 0 | 154 | 0 |
| B | 0 | 154 | 0 |
| C | 0 | 154 | 0 |
| D | 0 | 154 | 0 |
| Mode M9 | |||
|---|---|---|---|
| Quadrant | BADHDUFLAG | Total packets | Discarded packets |
| A | 0 | 12 | 0 |
| B | 0 | 12 | 0 |
| C | 0 | 12 | 0 |
| D | 0 | 12 | 0 |
| Mode M0 | |||
|---|---|---|---|
| Quadrant | BADHDUFLAG | Total packets | Discarded packets |
| A | 0 | 16424 | 3 |
| B | 0 | 20774 | 2 |
| C | 0 | 15386 | 2 |
| D | 0 | 23363 | 2 |
| Quadrant | Total seconds | Saturated seconds | Saturation percentage |
|---|---|---|---|
| A | 7459 | 90 | 1.206596% |
| B | 7459 | 619 | 8.298700% |
| C | 7459 | 19 | 0.254726% |
| D | 7459 | 472 | 6.327926% |
Noise dominated data is calculated using 1-second bins in cleaned event files. If a bin has >2000 counts, and if more than 50% of those come from <1% of pixels, then it is considered to be noise-dominated and hence unusable.
| Quadrant | # 1 sec bins | Bins with >0 counts | Bins with >2000 counts | High rate bins dominated by noise | Noise dominated (total time) | Noise dominated (detector-on time) | Marked lightcurve |
|---|---|---|---|---|---|---|---|
| A | 8640 | 7462 | 26 | 26 | 0.30% | 0.35% | 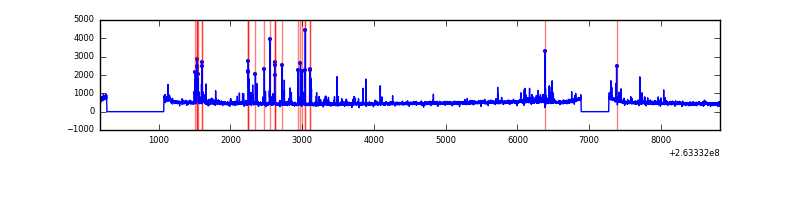 |
| B | 8640 | 7462 | 211 | 211 | 2.44% | 2.83% | 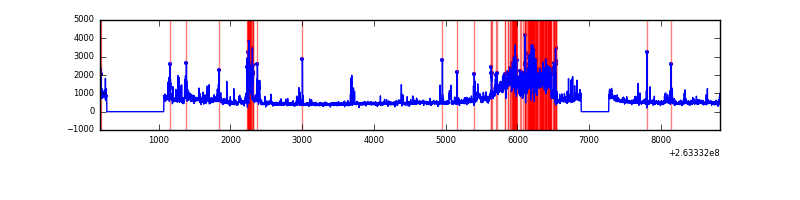 |
| C | 8640 | 7462 | 0 | 0 | 0.00% | 0.00% | 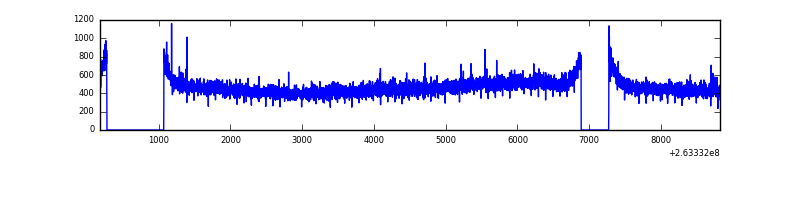 |
| D | 8640 | 7462 | 443 | 443 | 5.13% | 5.94% | 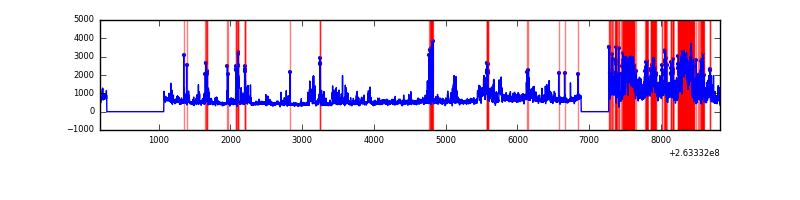 |
Top three noisy pixels from each quadrant. If the there are fewer than three noisy pixels in the level2.evt file, extra rows are filled as -1
| Pixel properties | Quadrant properties | ||||||
|---|---|---|---|---|---|---|---|
| Quadrant | DetID | PixID | Counts | Sigma | Mean | Median | Sigma |
| A | 12 | 96 | 170103 | 923.73 | 902 | 882 | 183.2 |
| A | 9 | 143 | 121954 | 660.9 | 902 | 882 | 183.2 |
| A | 12 | 189 | 68889 | 371.23 | 902 | 882 | 183.2 |
| B | 10 | 16 | 1573271 | 9341.62 | 883 | 858 | 168.3 |
| B | 0 | 189 | 71907 | 422.1 | 883 | 858 | 168.3 |
| B | 3 | 209 | 28589 | 164.75 | 883 | 858 | 168.3 |
| C | 3 | 233 | 66879 | 326.63 | 873 | 874 | 202.1 |
| C | 13 | 61 | 6409 | 27.39 | 873 | 874 | 202.1 |
| C | 0 | 207 | 5557 | 23.17 | 873 | 874 | 202.1 |
| D | 1 | 52 | 2331302 | 11228.21 | 847 | 824 | 207.6 |
| D | 8 | 195 | 204886 | 983.17 | 847 | 824 | 207.6 |
| D | 2 | 152 | 143868 | 689.18 | 847 | 824 | 207.6 |
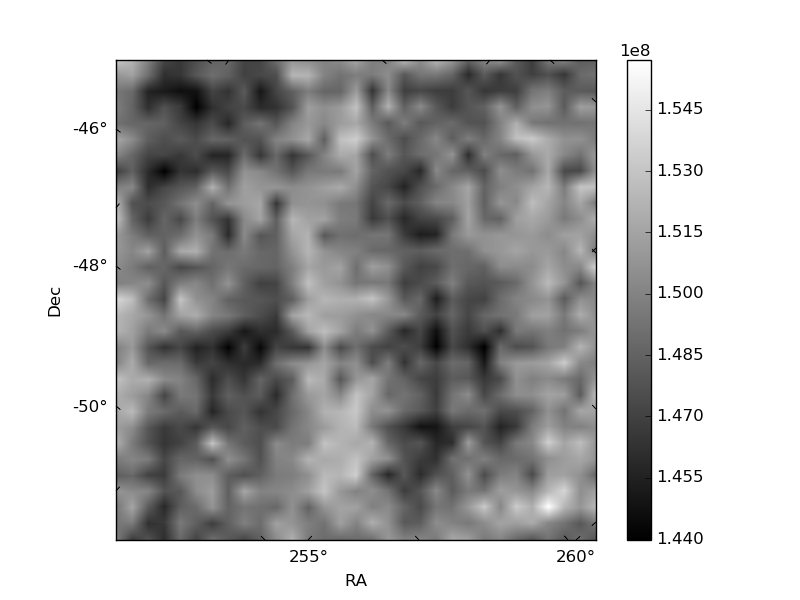
Histogram calculated using DETX and DETY for each event in the final _common_clean file
| Quadrant A | 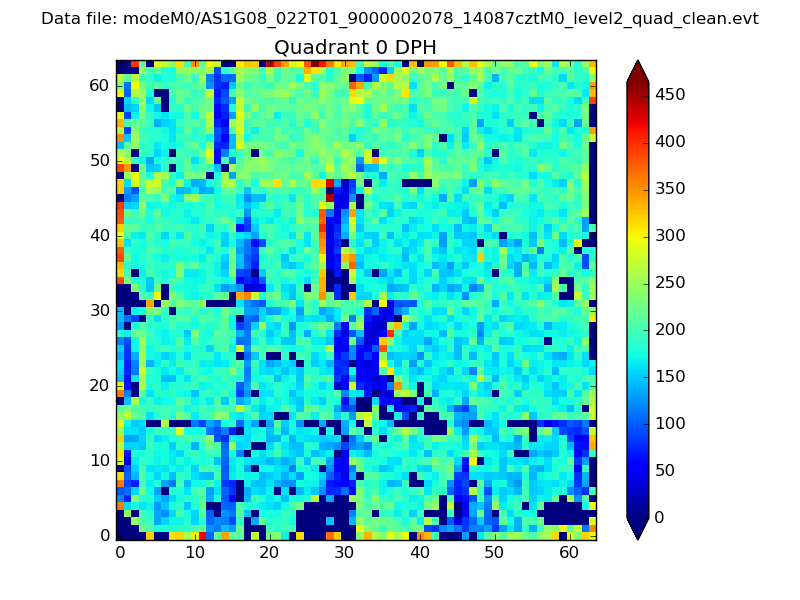 |
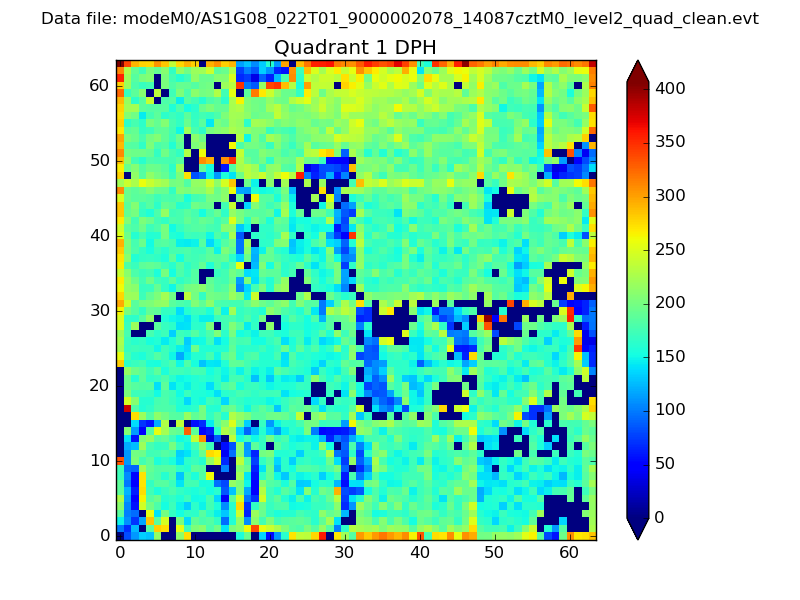 |
Quadrant B |
|---|---|---|---|
| Quadrant D |  |
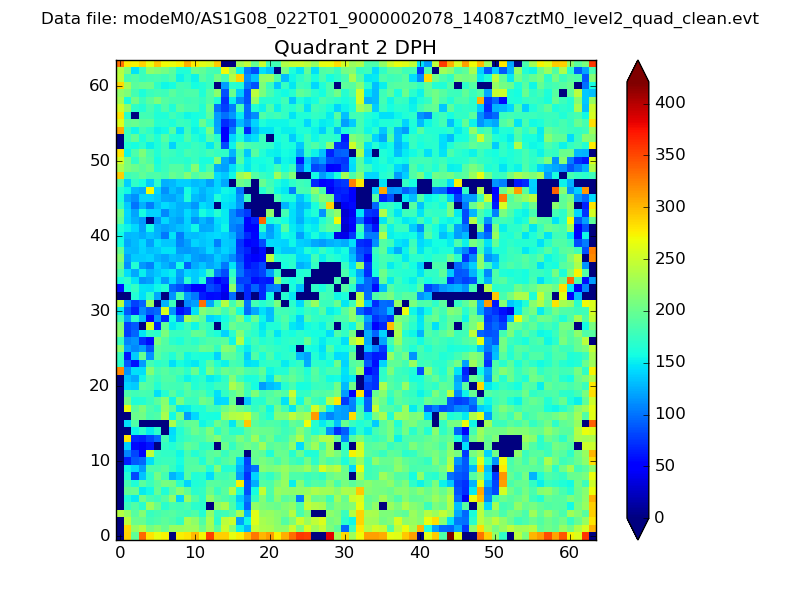 |
Quadrant C |
| Plot type | Count rate plots | Images |
|---|---|---|
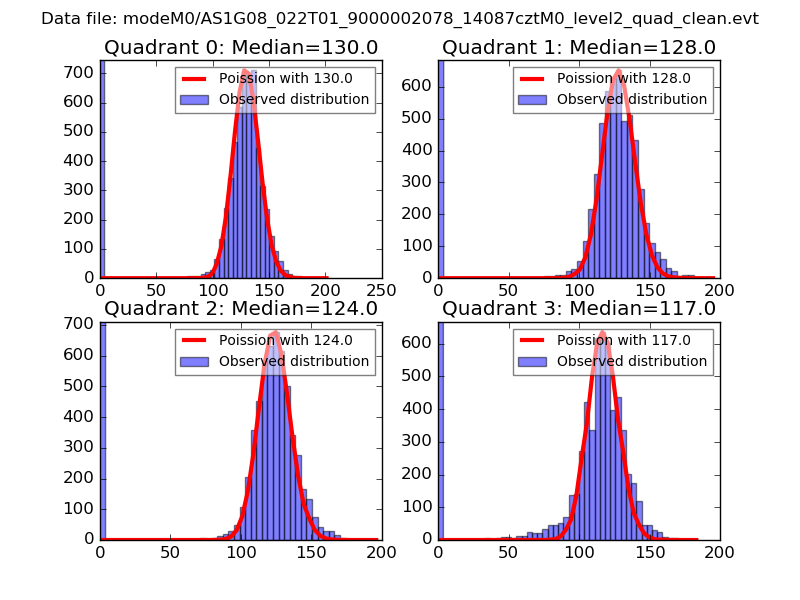
| Comparison with Poisson distribution Blue bars denote a histogram of data divided into 1 sec bins. Red curve is a Poisson curve with rate = median count rate of data. |
 |
 |
| Quadrant-wise count rates Data is divided into 100 sec bins |
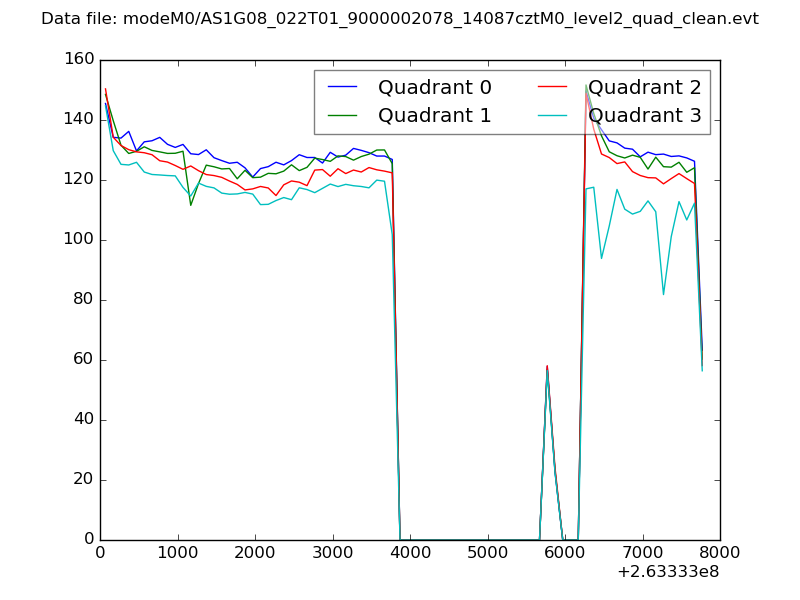 |
|
| Module-wise count rates for Quadrant A Data is divided into 100 sec bins |
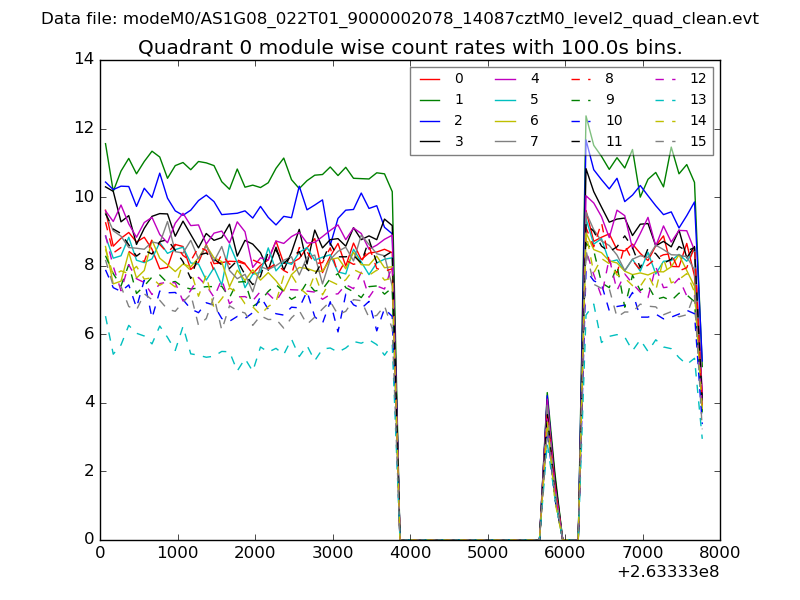 |
 |
| Module-wise count rates for Quadrant B Data is divided into 100 sec bins |
 |
 |
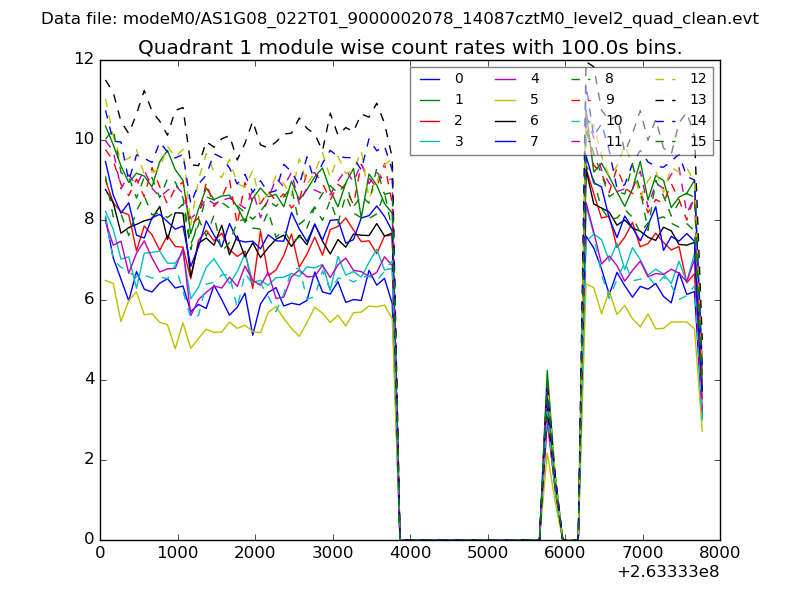
| Module-wise count rates for Quadrant C Data is divided into 100 sec bins |
 |
 |
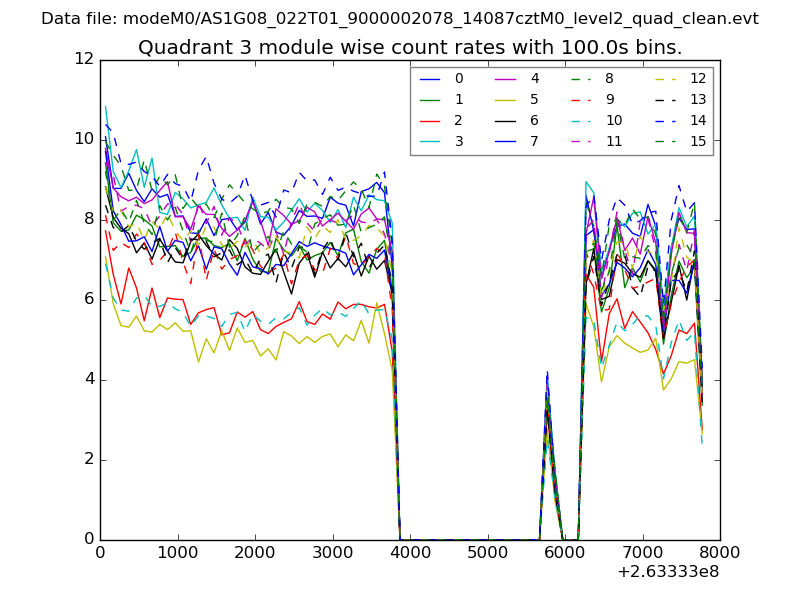
| Module-wise count rates for Quadrant D Data is divided into 100 sec bins |
 |
 |
| Parameter | Plot |
|---|---|
| CZT HV Monitor | 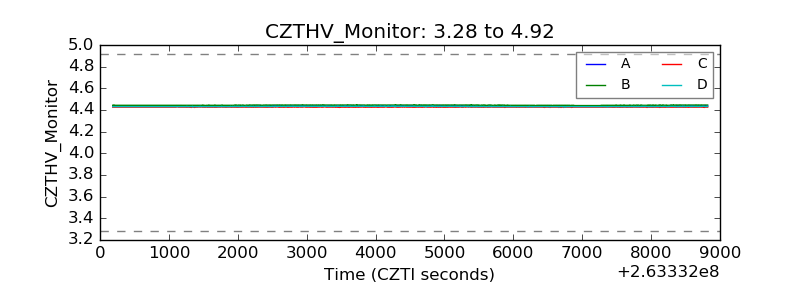 |
| D_VDD | 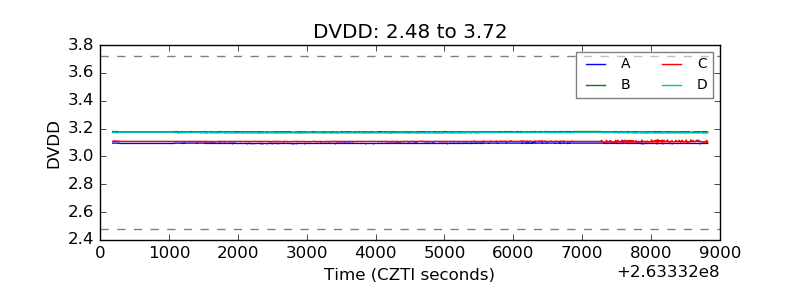 |
| Temperature 1 | 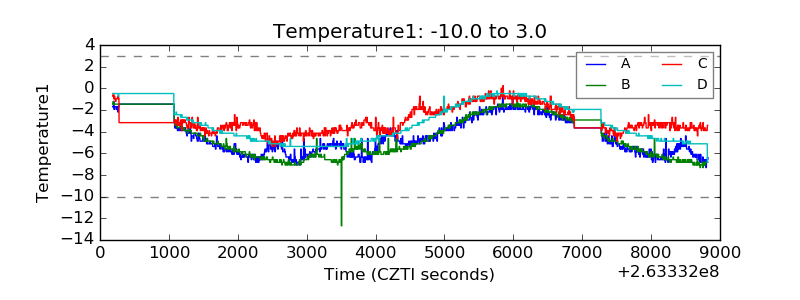 |
| Veto HV Monitor | 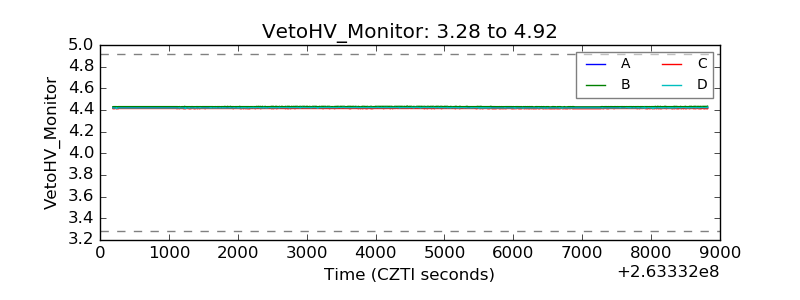 |
| Veto LLD | 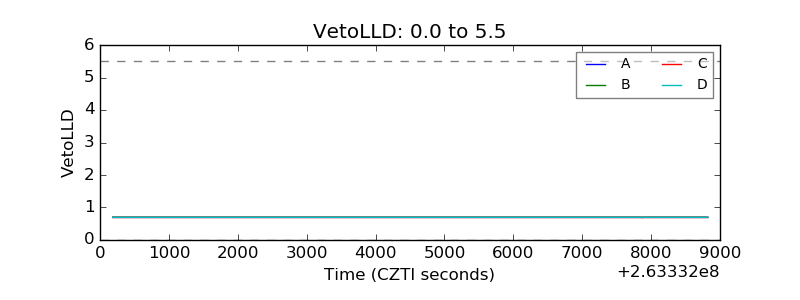 |
| Alpha Counter | 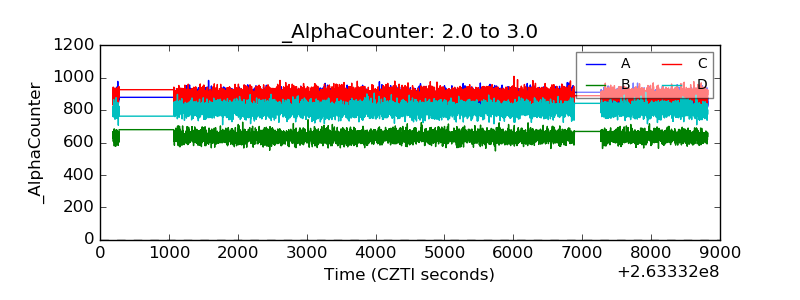 |
| _CPM_Rate | 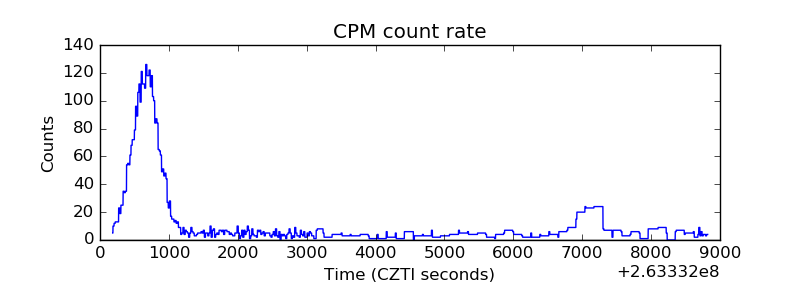 |
| CZT Counter | 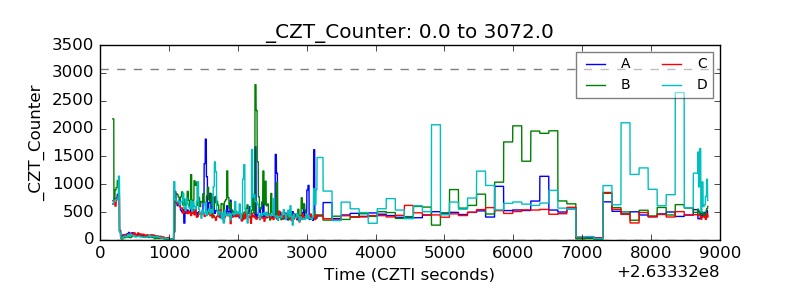 |
| +2.5 Volts monitor |  |
| +5 Volts monitor | 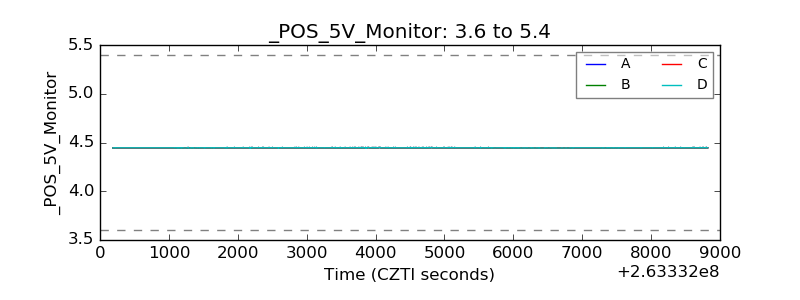 |
| _ROLL_ROT | 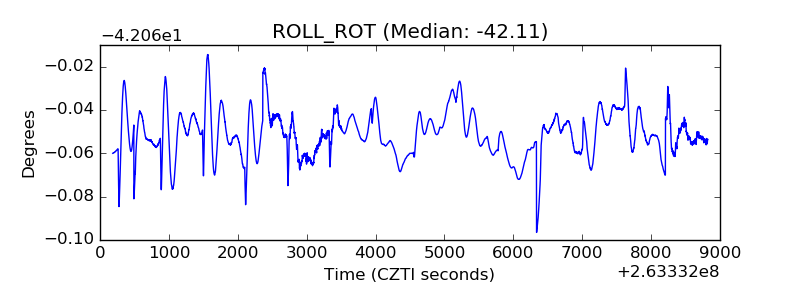 |
| _Roll_DEC | 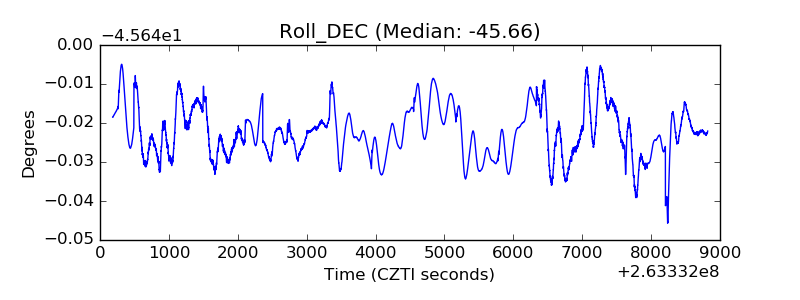 |
| _Roll_RA | 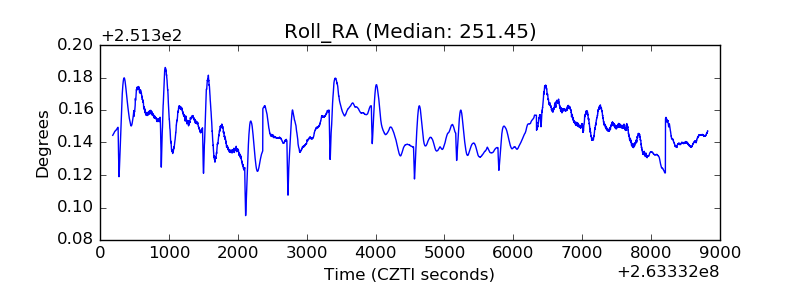 |
| Veto Counter | 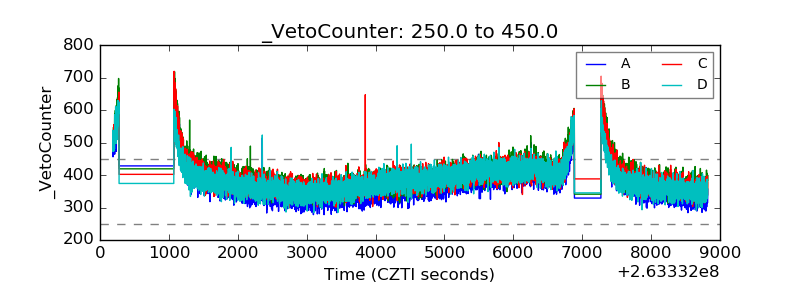 |