| Param | Original file | Final file |
|---|---|---|
| Filename | modeM0/AS1G08_022T01_9000002078_14091cztM0_level2.evt | modeM0/AS1G08_022T01_9000002078_14091cztM0_level2_quad_clean.evt |
| Size (bytes) | 2,433,084,480 | 335,180,160 |
| Size | 2.3 GB | 319.7 MB |
| Events in quadrant A | 12,477,121 | 2,231,536 |
| Events in quadrant B | 20,725,243 | 2,056,355 |
| Events in quadrant C | 12,105,851 | 2,140,354 |
| Events in quadrant D | 26,655,876 | 1,961,429 |
| Mode SS | |||
|---|---|---|---|
| Quadrant | BADHDUFLAG | Total packets | Discarded packets |
| A | 0 | 520 | 0 |
| B | 0 | 520 | 0 |
| C | 0 | 520 | 0 |
| D | 0 | 520 | 0 |
| Mode M9 | |||
|---|---|---|---|
| Quadrant | BADHDUFLAG | Total packets | Discarded packets |
| A | 0 | 21 | 0 |
| B | 0 | 21 | 0 |
| C | 0 | 21 | 0 |
| D | 0 | 21 | 0 |
| Mode M0 | |||
|---|---|---|---|
| Quadrant | BADHDUFLAG | Total packets | Discarded packets |
| A | 0 | 53930 | 6 |
| B | 0 | 78620 | 5 |
| C | 0 | 52761 | 5 |
| D | 0 | 96907 | 5 |
| Quadrant | Total seconds | Saturated seconds | Saturation percentage |
|---|---|---|---|
| A | 25611 | 205 | 0.800437% |
| B | 25611 | 2891 | 11.288118% |
| C | 25611 | 169 | 0.659873% |
| D | 25611 | 2823 | 11.022607% |
Noise dominated data is calculated using 1-second bins in cleaned event files. If a bin has >2000 counts, and if more than 50% of those come from <1% of pixels, then it is considered to be noise-dominated and hence unusable.
| Quadrant | # 1 sec bins | Bins with >0 counts | Bins with >2000 counts | High rate bins dominated by noise | Noise dominated (total time) | Noise dominated (detector-on time) | Marked lightcurve |
|---|---|---|---|---|---|---|---|
| A | 27662 | 25618 | 45 | 45 | 0.16% | 0.18% | 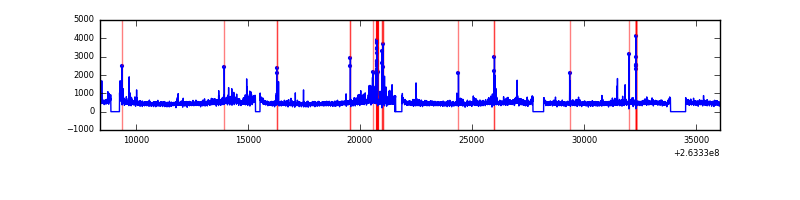 |
| B | 27662 | 25614 | 1729 | 1729 | 6.25% | 6.75% | 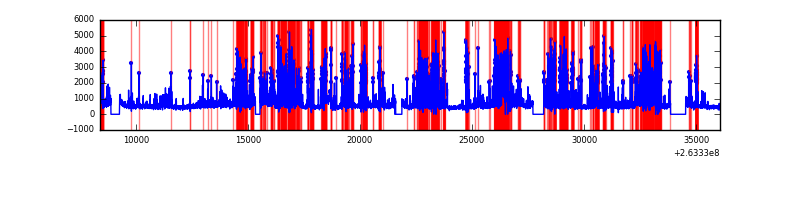 |
| C | 27662 | 25618 | 25 | 25 | 0.09% | 0.10% | 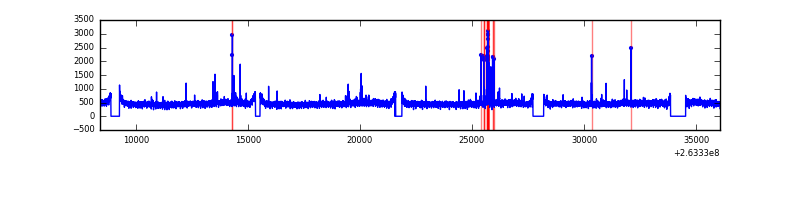 |
| D | 27662 | 25618 | 2407 | 2407 | 8.70% | 9.40% | 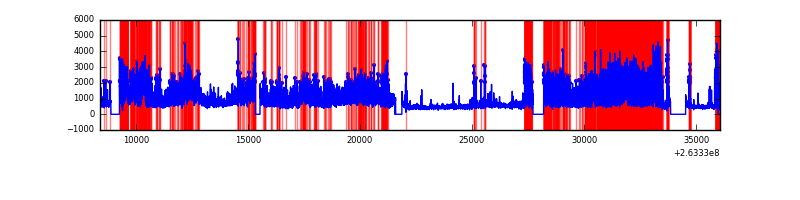 |
Top three noisy pixels from each quadrant. If the there are fewer than three noisy pixels in the level2.evt file, extra rows are filled as -1
| Pixel properties | Quadrant properties | ||||||
|---|---|---|---|---|---|---|---|
| Quadrant | DetID | PixID | Counts | Sigma | Mean | Median | Sigma |
| A | 9 | 143 | 317066 | 509.32 | 3059 | 2984 | 616.7 |
| A | 12 | 189 | 298827 | 479.74 | 3059 | 2984 | 616.7 |
| A | 15 | 222 | 43499 | 65.7 | 3059 | 2984 | 616.7 |
| B | 10 | 16 | 8507585 | 15577.9 | 2896 | 2816 | 546.0 |
| B | 0 | 189 | 299960 | 544.27 | 2896 | 2816 | 546.0 |
| B | 0 | 85 | 207614 | 375.12 | 2896 | 2816 | 546.0 |
| C | 3 | 233 | 291264 | 419.94 | 2969 | 2984 | 686.5 |
| C | 0 | 207 | 198077 | 284.19 | 2969 | 2984 | 686.5 |
| C | 13 | 61 | 21506 | 26.98 | 2969 | 2984 | 686.5 |
| D | 1 | 52 | 14088392 | 19814.78 | 2844 | 2773 | 710.9 |
| D | 8 | 195 | 650020 | 910.51 | 2844 | 2773 | 710.9 |
| D | 7 | 80 | 271229 | 377.65 | 2844 | 2773 | 710.9 |
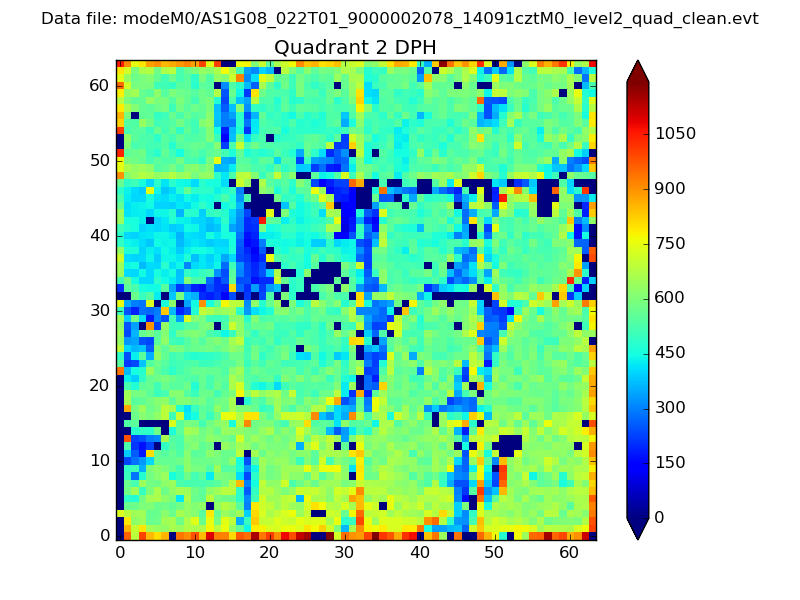
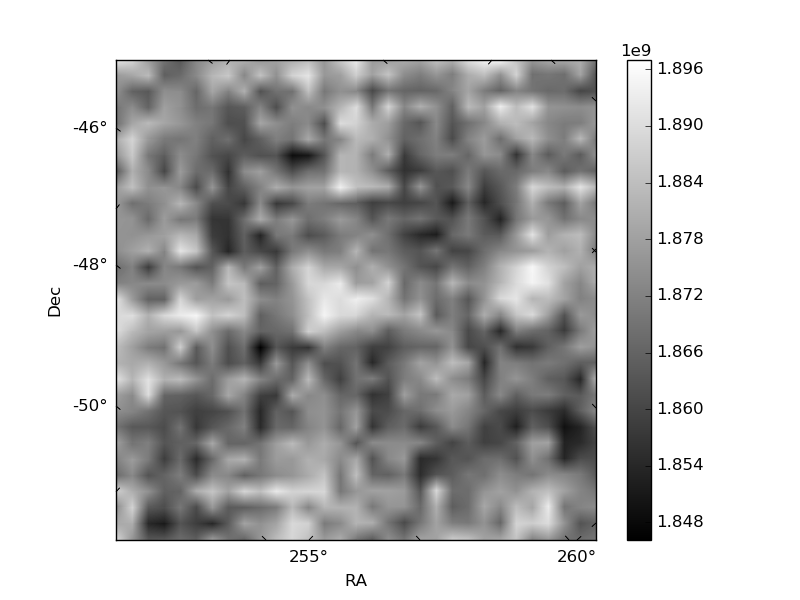
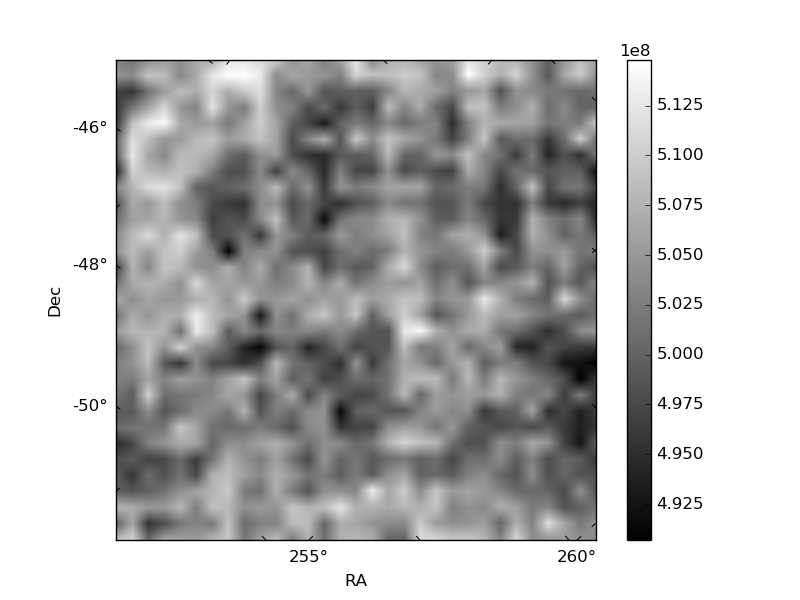
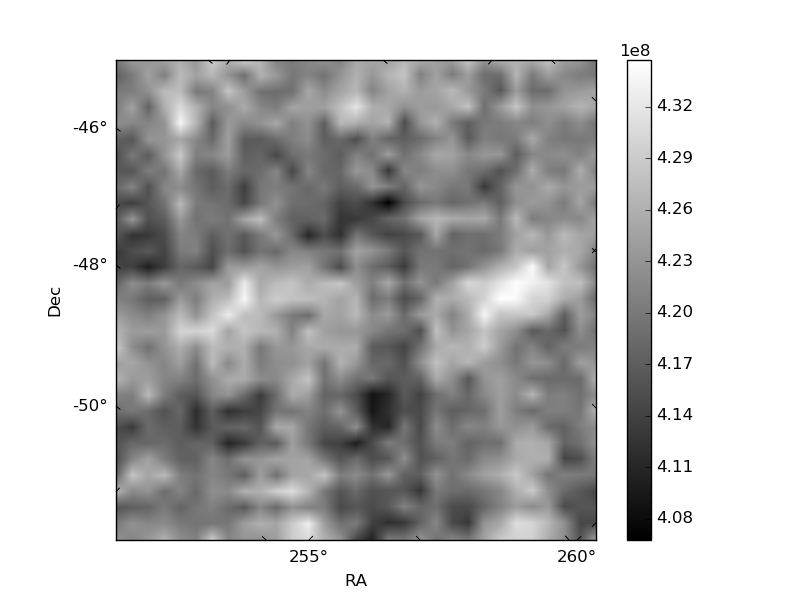
Histogram calculated using DETX and DETY for each event in the final _common_clean file
| Quadrant A | 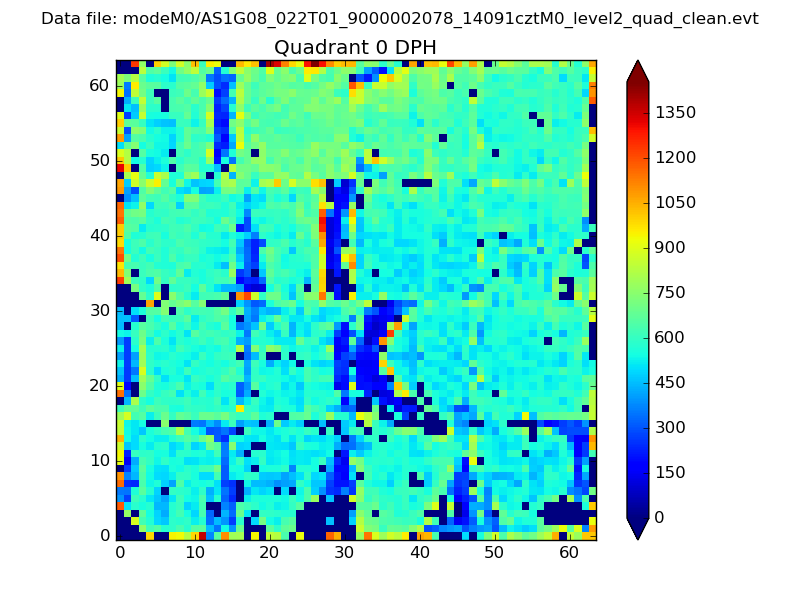 |
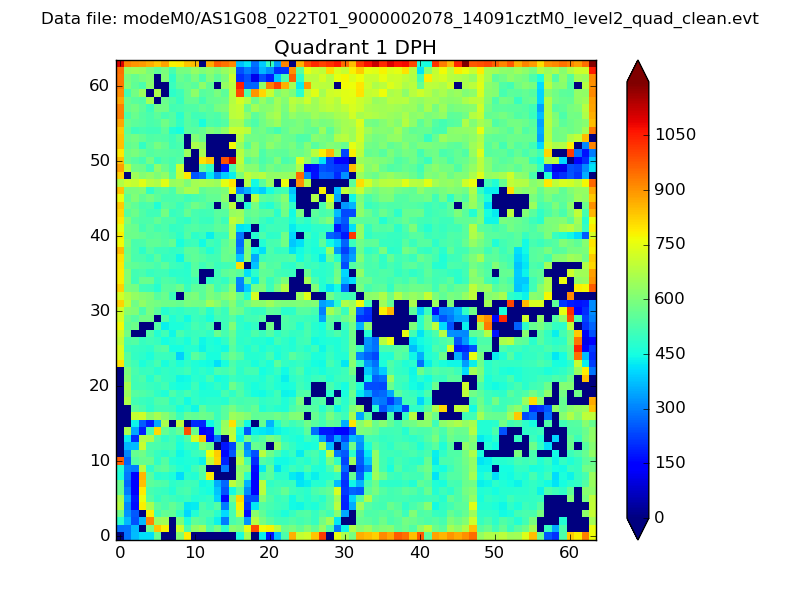 |
Quadrant B |
|---|---|---|---|
| Quadrant D | 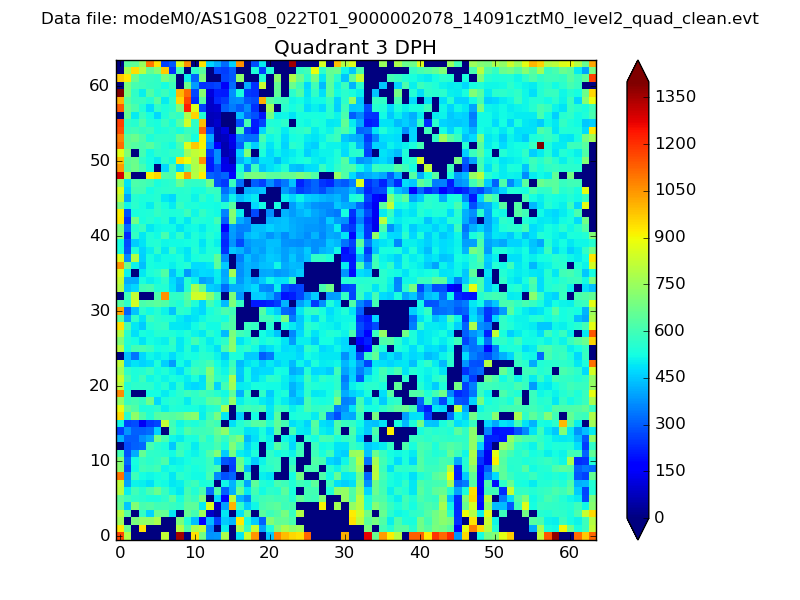 |
 |
Quadrant C |
| Plot type | Count rate plots | Images |
|---|---|---|
| Comparison with Poisson distribution Blue bars denote a histogram of data divided into 1 sec bins. Red curve is a Poisson curve with rate = median count rate of data. |
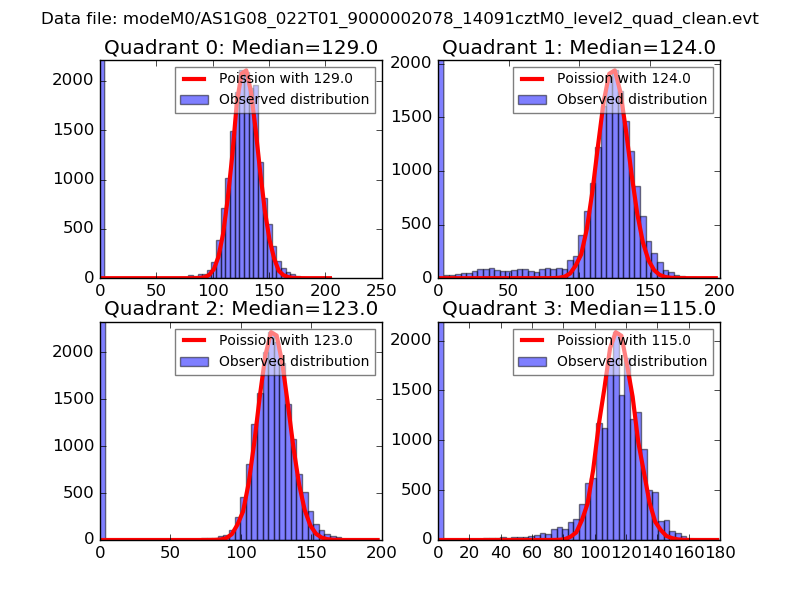 |
 |
| Quadrant-wise count rates Data is divided into 100 sec bins |
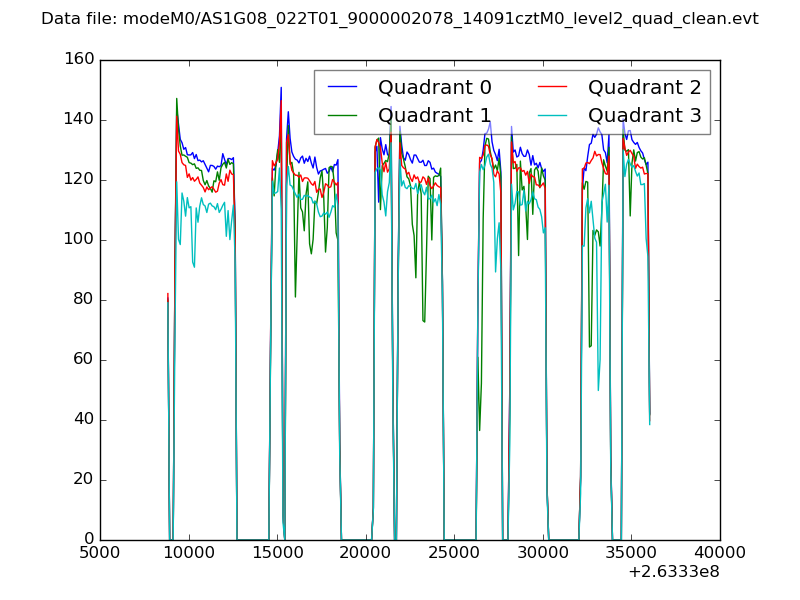 |
|
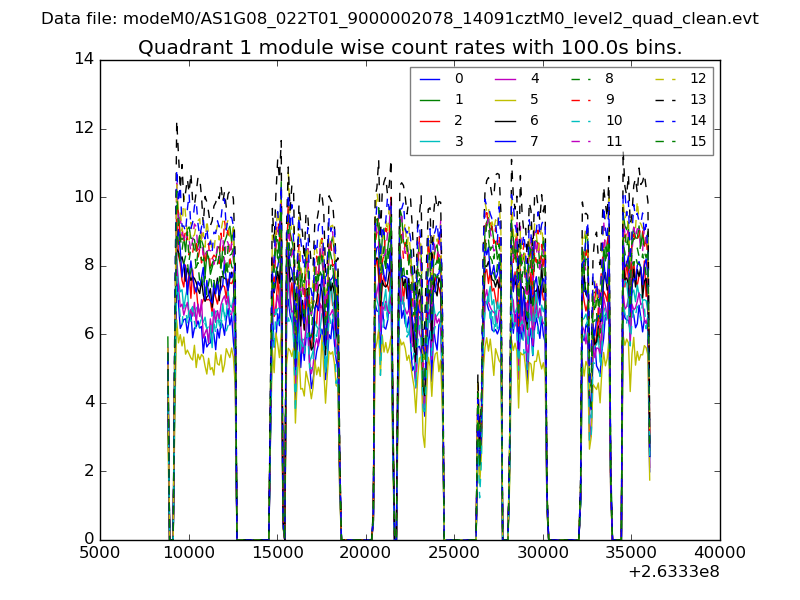
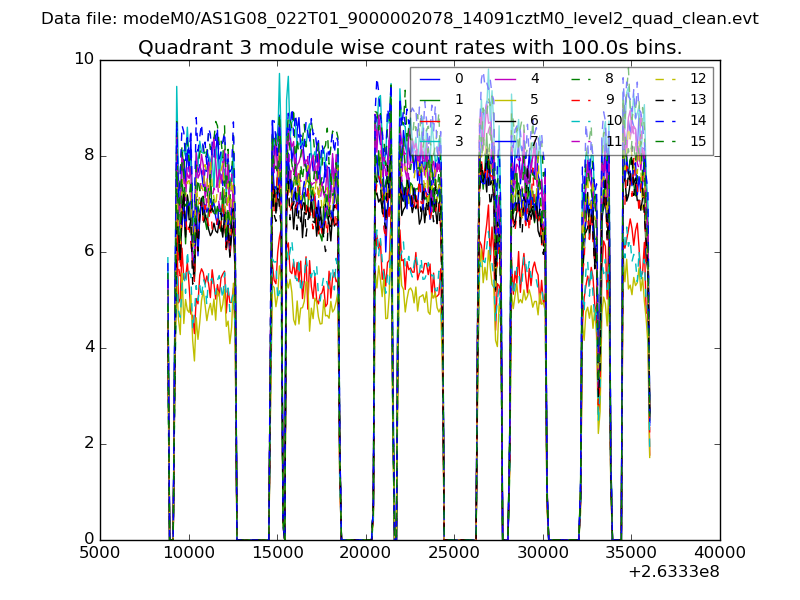
| Module-wise count rates for Quadrant A Data is divided into 100 sec bins |
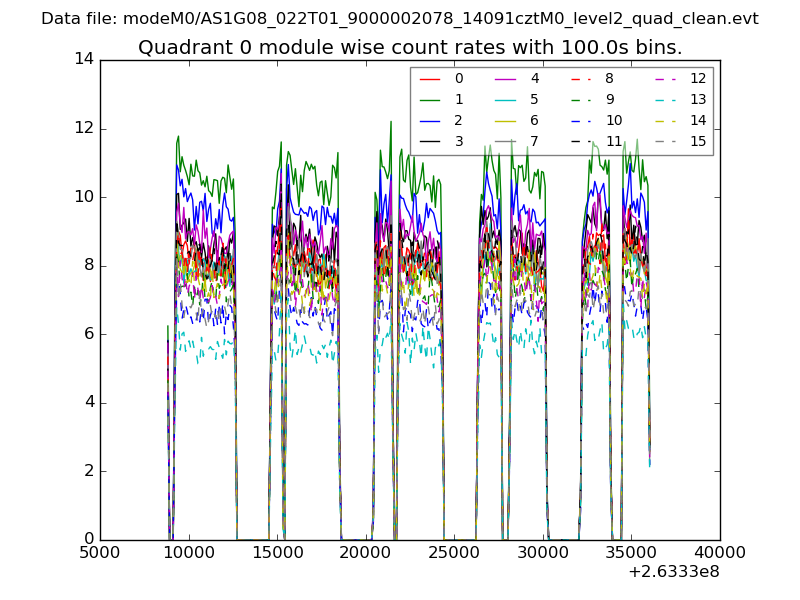 |
 |
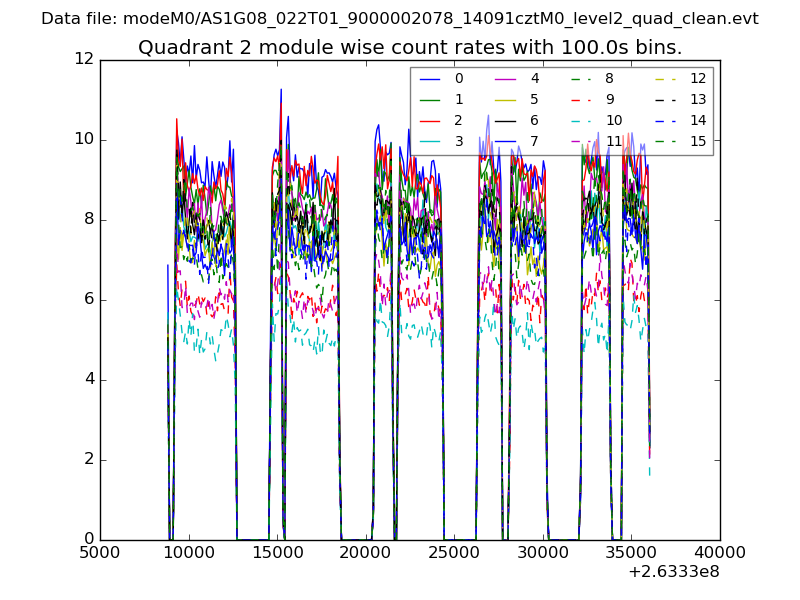
| Module-wise count rates for Quadrant B Data is divided into 100 sec bins |
 |
 |
| Module-wise count rates for Quadrant C Data is divided into 100 sec bins |
 |
 |
| Module-wise count rates for Quadrant D Data is divided into 100 sec bins |
 |
 |
| Parameter | Plot |
|---|---|
| CZT HV Monitor | 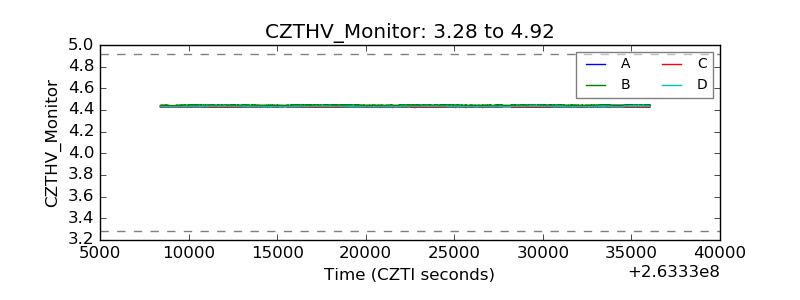 |
| D_VDD |  |
| Temperature 1 | 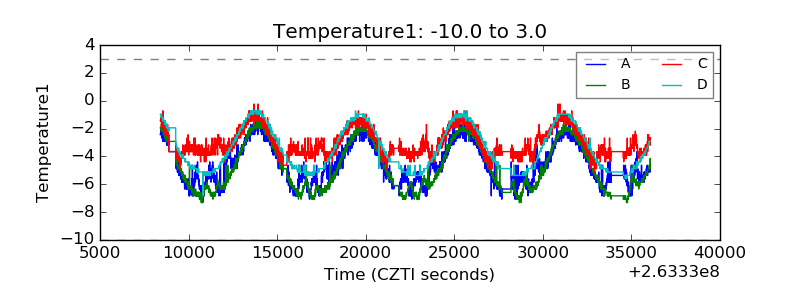 |
| Veto HV Monitor | 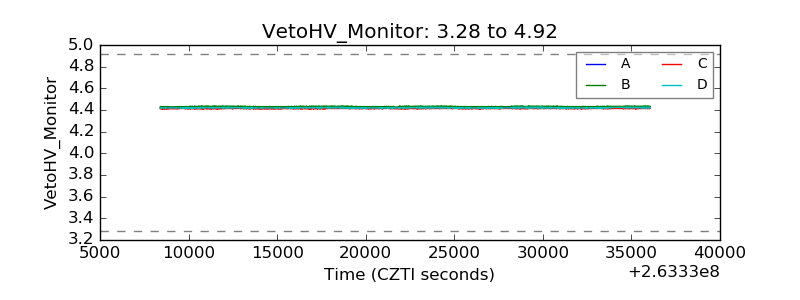 |
| Veto LLD | 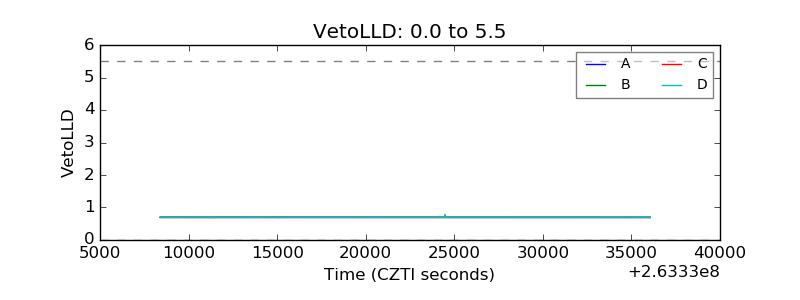 |
| Alpha Counter | 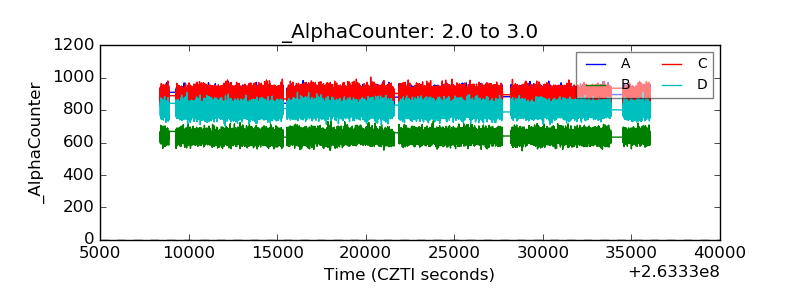 |
| _CPM_Rate | 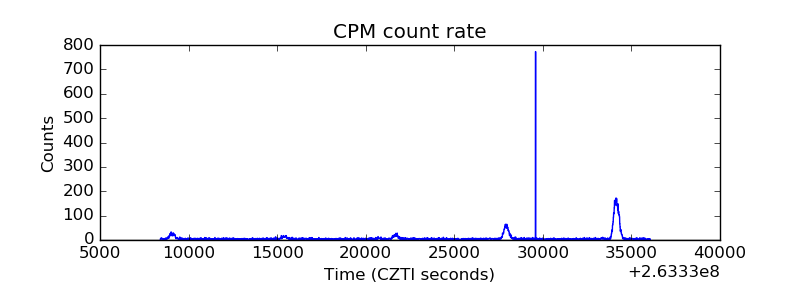 |
| CZT Counter | 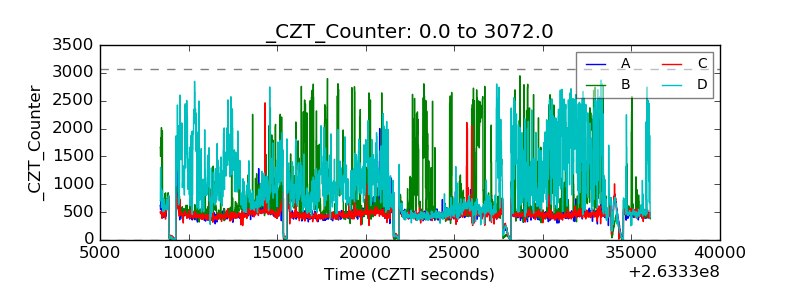 |
| +2.5 Volts monitor |  |
| +5 Volts monitor |  |
| _ROLL_ROT | 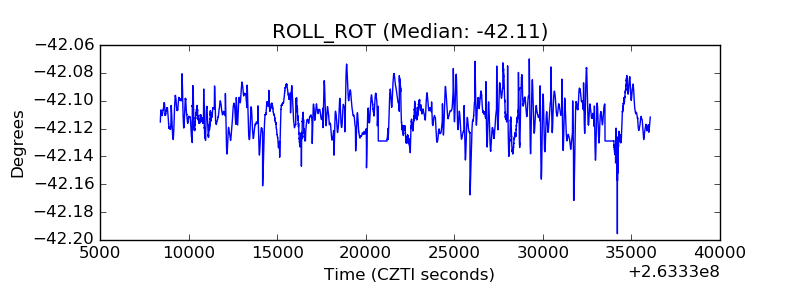 |
| _Roll_DEC | 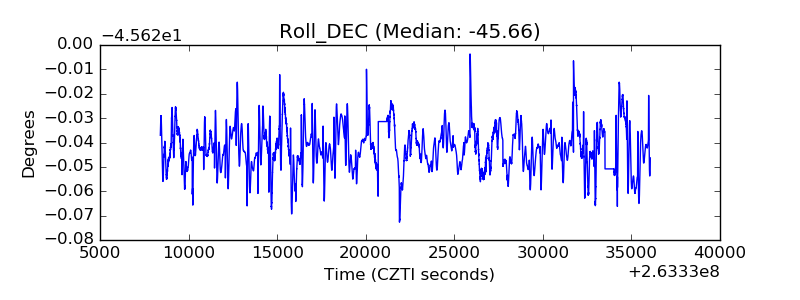 |
| _Roll_RA | 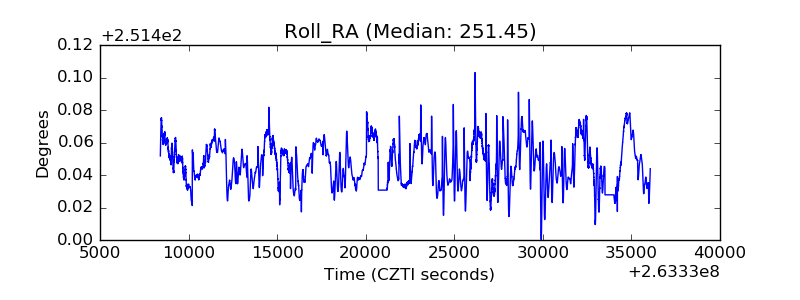 |
| Veto Counter | 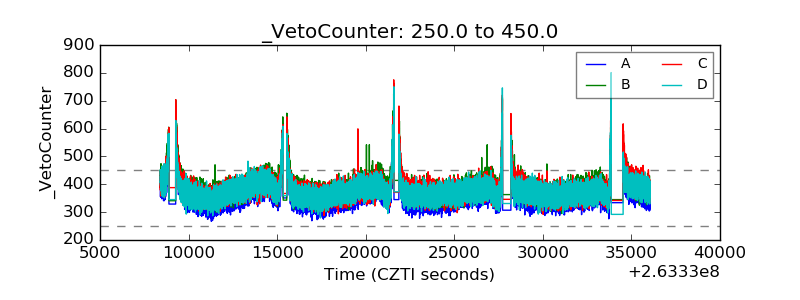 |