| Param | Original file | Final file |
|---|---|---|
| Filename | modeM0/AS1G08_022T01_9000002078_14092cztM0_level2.evt | modeM0/AS1G08_022T01_9000002078_14092cztM0_level2_quad_clean.evt |
| Size (bytes) | 482,961,600 | 80,225,280 |
| Size | 460.6 MB | 76.5 MB |
| Events in quadrant A | 2,920,122 | 527,172 |
| Events in quadrant B | 4,625,309 | 495,125 |
| Events in quadrant C | 2,888,069 | 508,014 |
| Events in quadrant D | 3,778,608 | 472,817 |
| Mode SS | |||
|---|---|---|---|
| Quadrant | BADHDUFLAG | Total packets | Discarded packets |
| A | 0 | 124 | 0 |
| B | 0 | 124 | 0 |
| C | 0 | 124 | 0 |
| D | 0 | 124 | 0 |
| Mode M9 | |||
|---|---|---|---|
| Quadrant | BADHDUFLAG | Total packets | Discarded packets |
| A | 0 | 9 | 0 |
| B | 0 | 9 | 0 |
| C | 0 | 9 | 0 |
| D | 0 | 9 | 0 |
| Mode M0 | |||
|---|---|---|---|
| Quadrant | BADHDUFLAG | Total packets | Discarded packets |
| A | 0 | 12627 | 2 |
| B | 0 | 17654 | 1 |
| C | 0 | 12454 | 1 |
| D | 0 | 15074 | 1 |
| Quadrant | Total seconds | Saturated seconds | Saturation percentage |
|---|---|---|---|
| A | 6101 | 61 | 0.999836% |
| B | 6101 | 646 | 10.588428% |
| C | 6101 | 38 | 0.622849% |
| D | 6101 | 294 | 4.818882% |
Noise dominated data is calculated using 1-second bins in cleaned event files. If a bin has >2000 counts, and if more than 50% of those come from <1% of pixels, then it is considered to be noise-dominated and hence unusable.
| Quadrant | # 1 sec bins | Bins with >0 counts | Bins with >2000 counts | High rate bins dominated by noise | Noise dominated (total time) | Noise dominated (detector-on time) | Marked lightcurve |
|---|---|---|---|---|---|---|---|
| A | 6927 | 6103 | 7 | 7 | 0.10% | 0.11% | 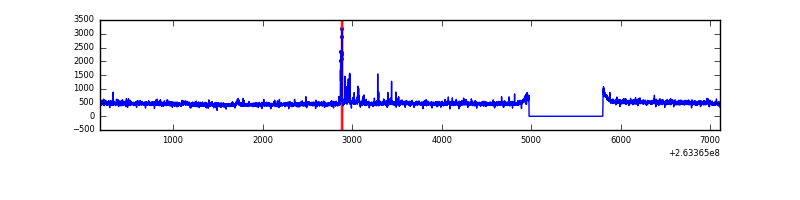 |
| B | 6927 | 6102 | 317 | 317 | 4.58% | 5.20% | 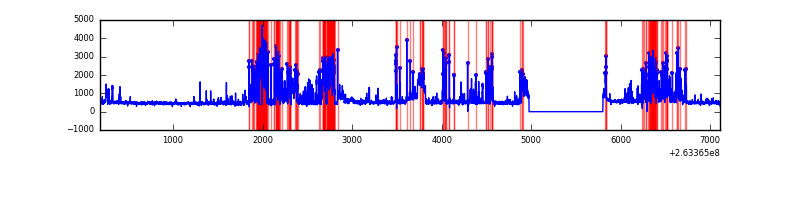 |
| C | 6927 | 6103 | 2 | 2 | 0.03% | 0.03% | 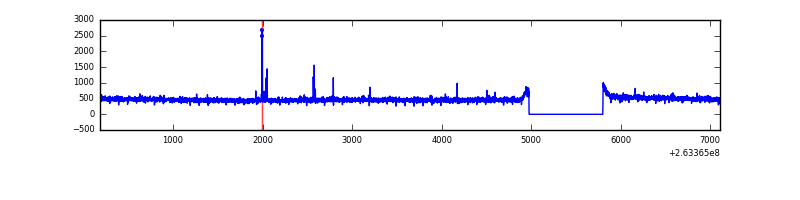 |
| D | 6927 | 6102 | 162 | 162 | 2.34% | 2.65% | 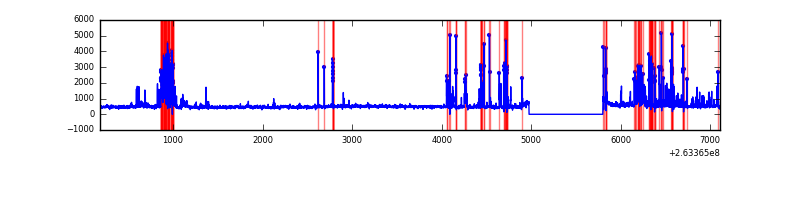 |
Top three noisy pixels from each quadrant. If the there are fewer than three noisy pixels in the level2.evt file, extra rows are filled as -1
| Pixel properties | Quadrant properties | ||||||
|---|---|---|---|---|---|---|---|
| Quadrant | DetID | PixID | Counts | Sigma | Mean | Median | Sigma |
| A | 9 | 143 | 70655 | 471.71 | 730 | 715 | 148.3 |
| A | 12 | 189 | 30317 | 199.65 | 730 | 715 | 148.3 |
| A | 8 | 15 | 9541 | 59.53 | 730 | 715 | 148.3 |
| B | 10 | 16 | 1791843 | 13543.37 | 691 | 673 | 132.3 |
| B | 0 | 189 | 47866 | 356.84 | 691 | 673 | 132.3 |
| B | 0 | 214 | 20234 | 147.9 | 691 | 673 | 132.3 |
| C | 3 | 233 | 86024 | 515.69 | 710 | 713 | 165.4 |
| C | 0 | 207 | 20359 | 118.76 | 710 | 713 | 165.4 |
| C | 8 | 128 | 6914 | 37.48 | 710 | 713 | 165.4 |
| D | 1 | 52 | 329987 | 1781.94 | 688 | 674 | 184.8 |
| D | 7 | 80 | 278015 | 1500.71 | 688 | 674 | 184.8 |
| D | 10 | 157 | 190377 | 1026.5 | 688 | 674 | 184.8 |
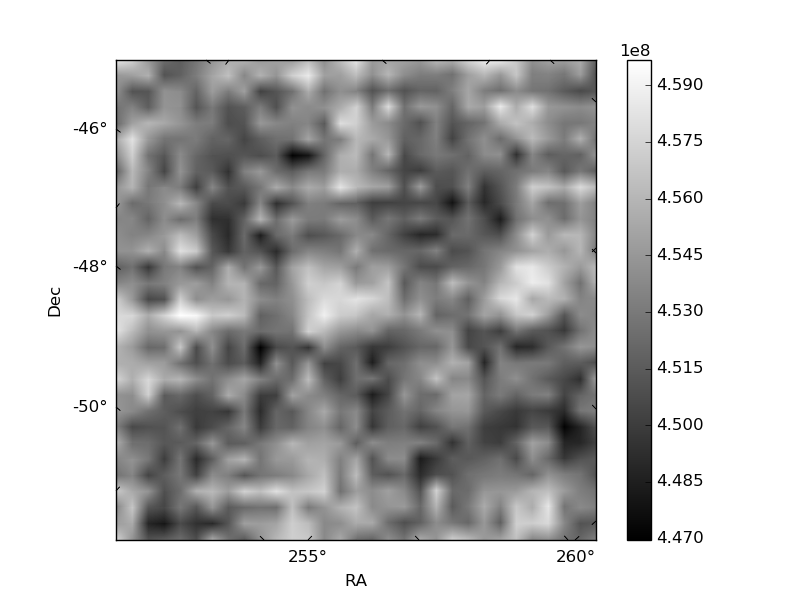
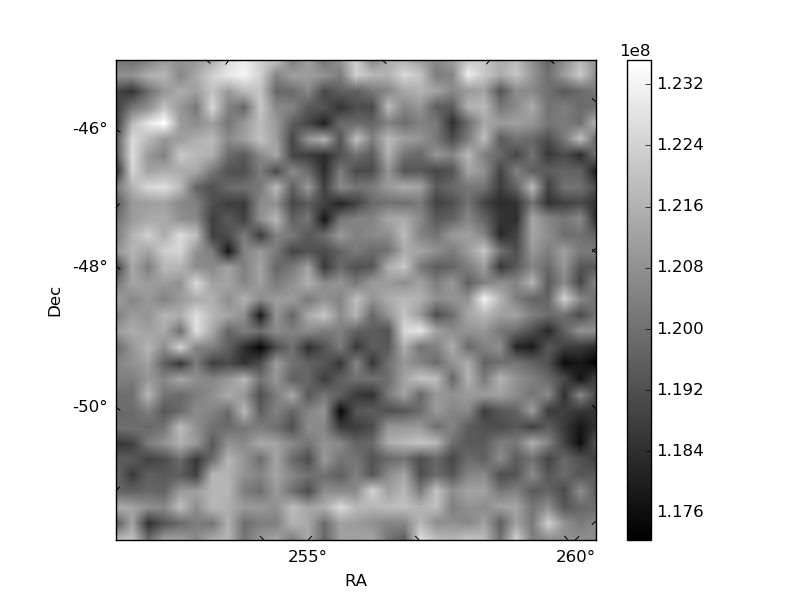
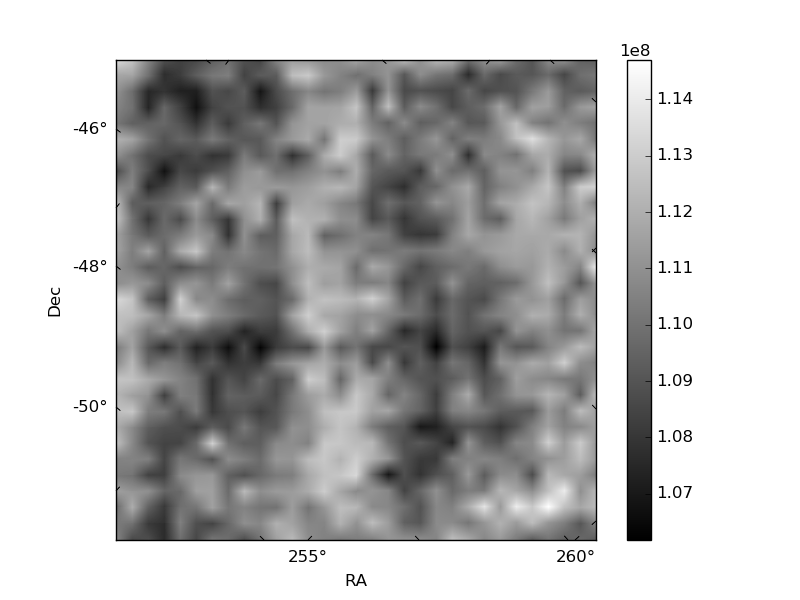
Histogram calculated using DETX and DETY for each event in the final _common_clean file
| Quadrant A | 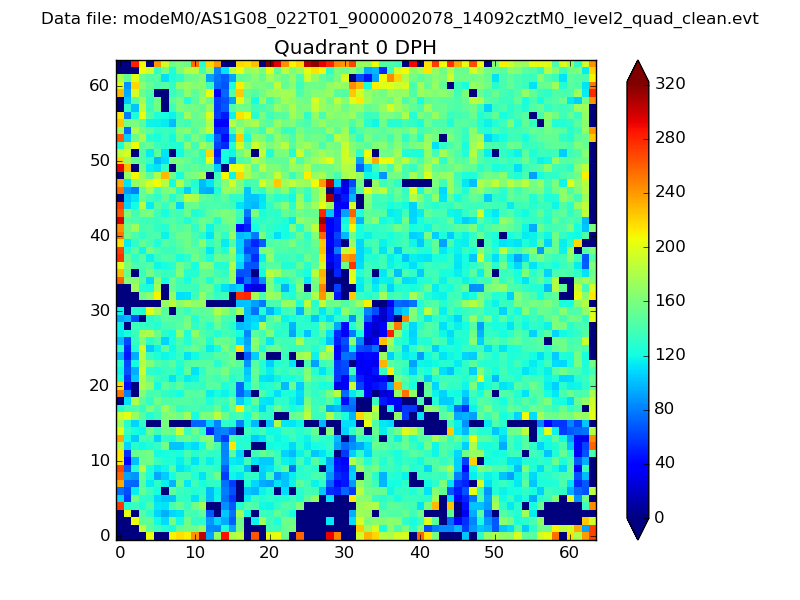 |
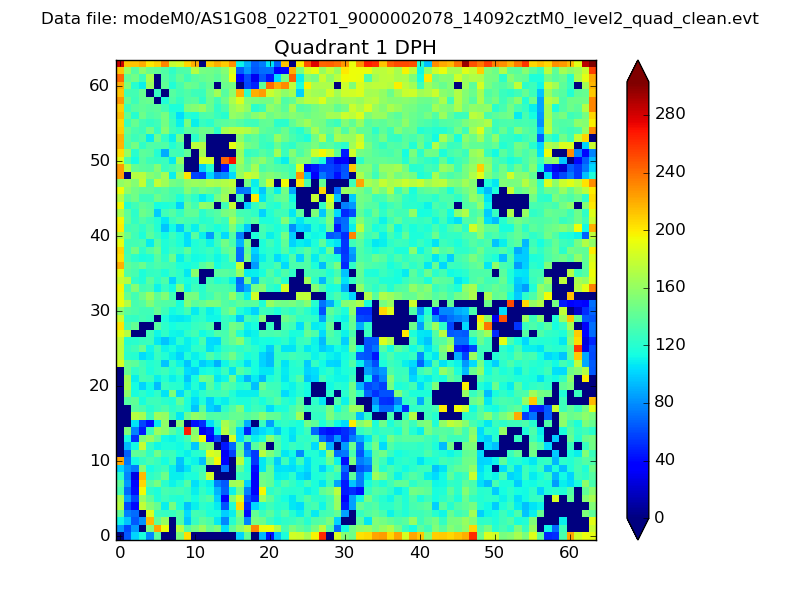 |
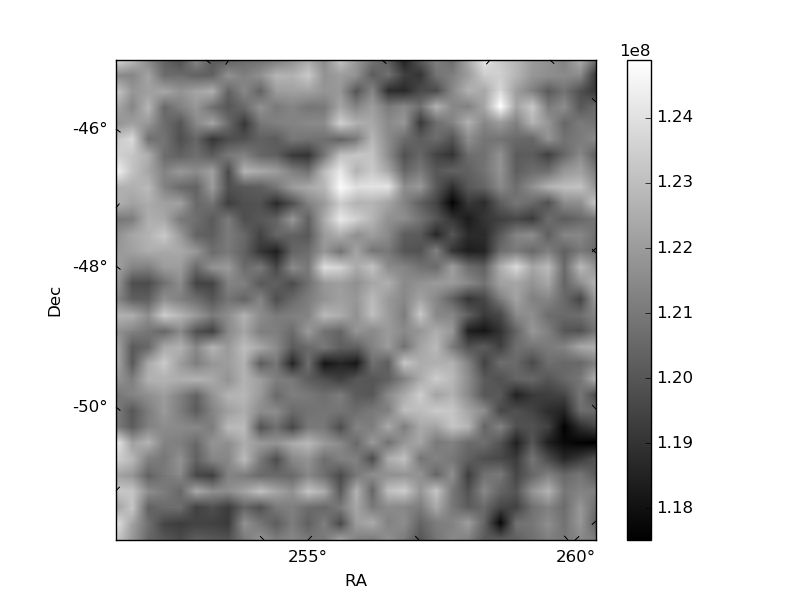
Quadrant B |
|---|---|---|---|
| Quadrant D | 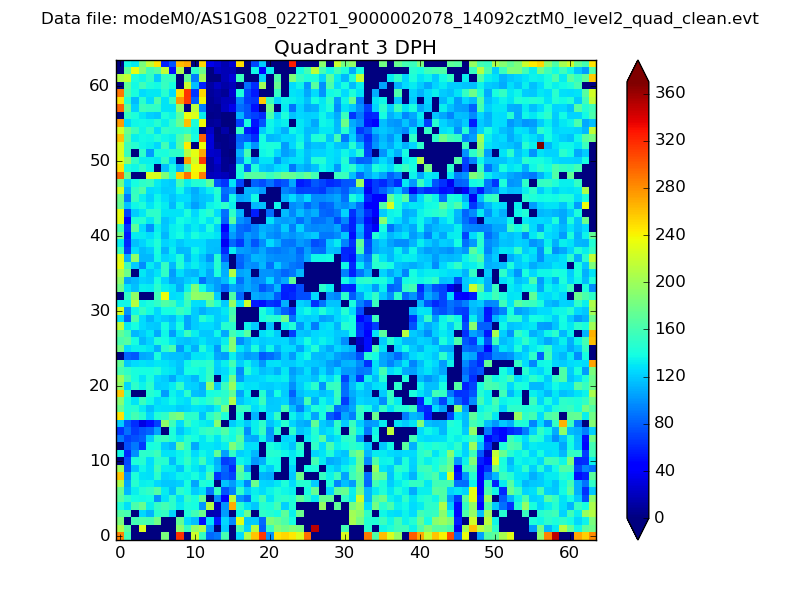 |
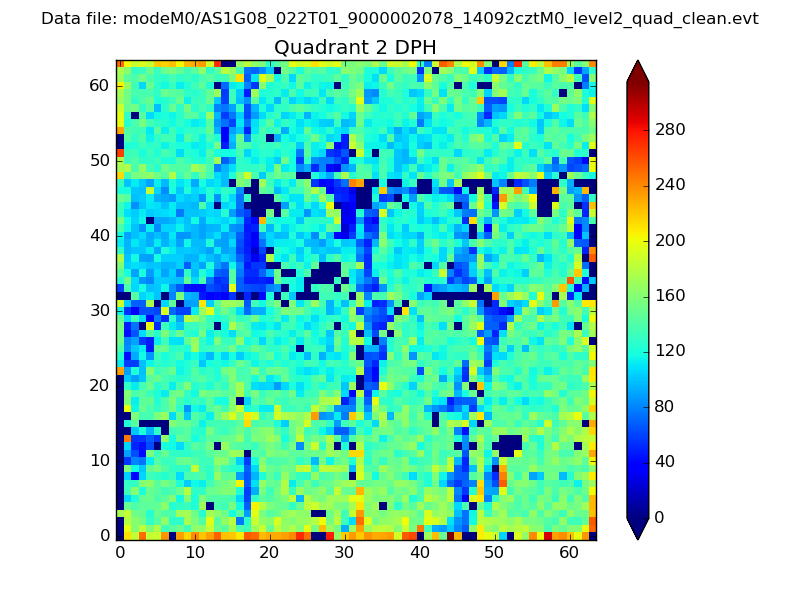 |
Quadrant C |
| Plot type | Count rate plots | Images |
|---|---|---|
| Comparison with Poisson distribution Blue bars denote a histogram of data divided into 1 sec bins. Red curve is a Poisson curve with rate = median count rate of data. |
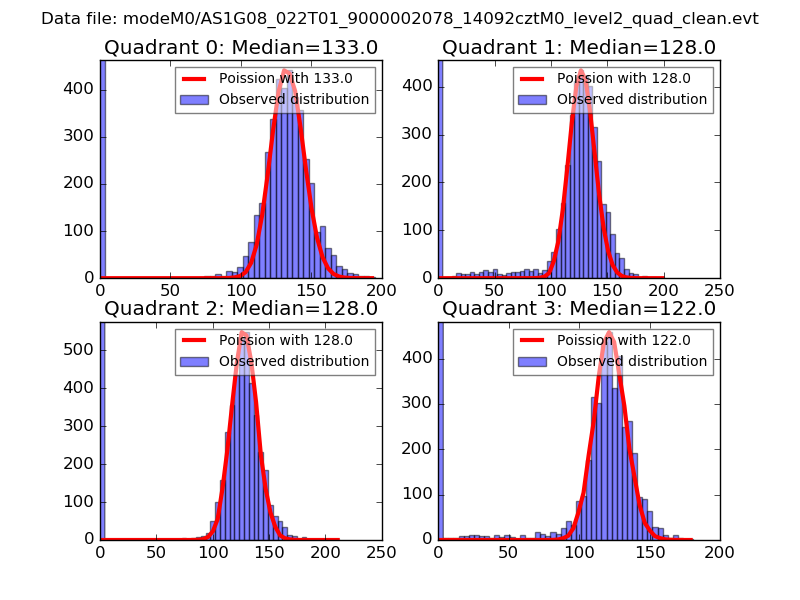 |
 |
| Quadrant-wise count rates Data is divided into 100 sec bins |
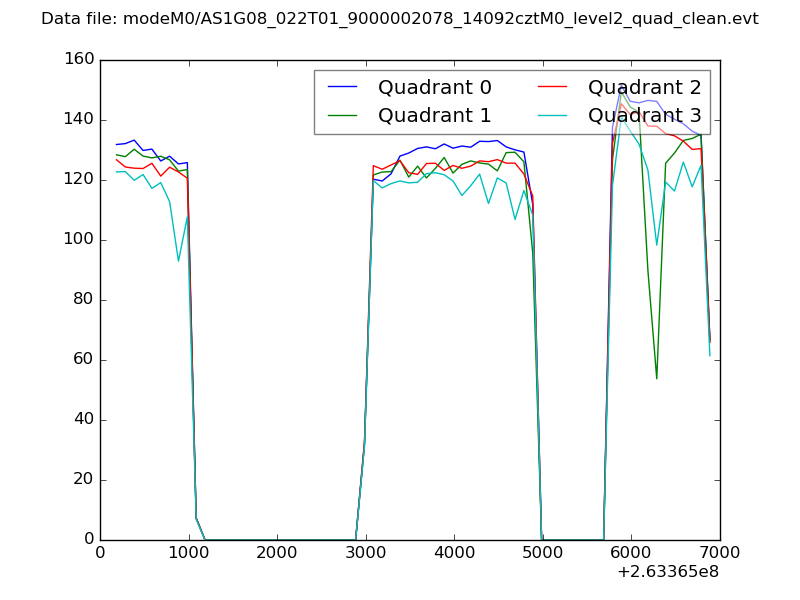 |
|
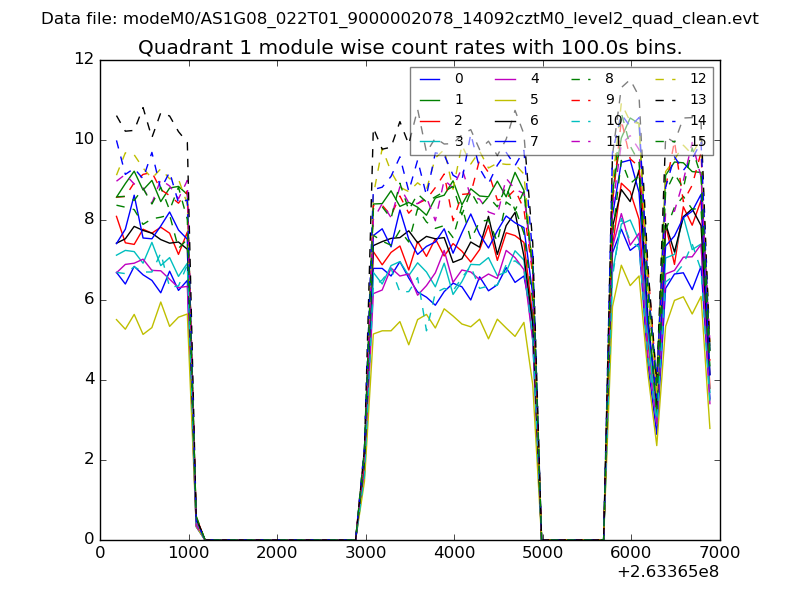
| Module-wise count rates for Quadrant A Data is divided into 100 sec bins |
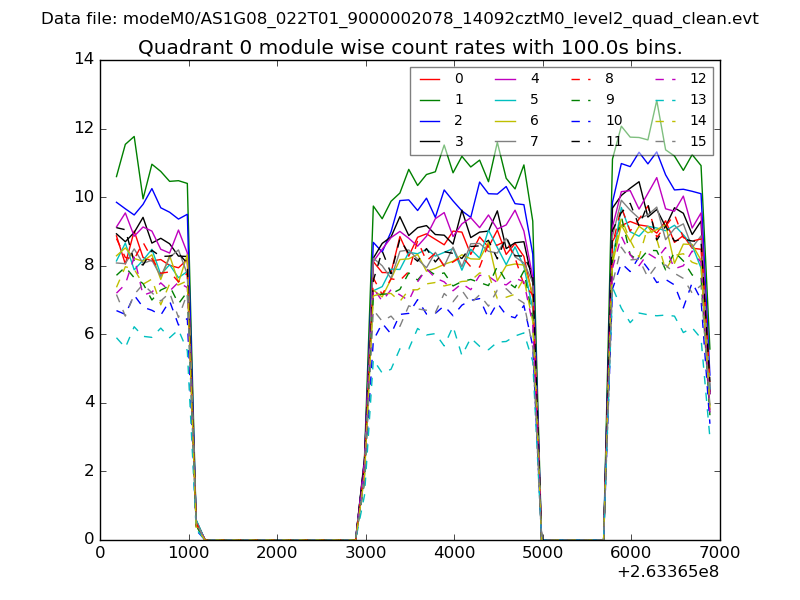 |
 |
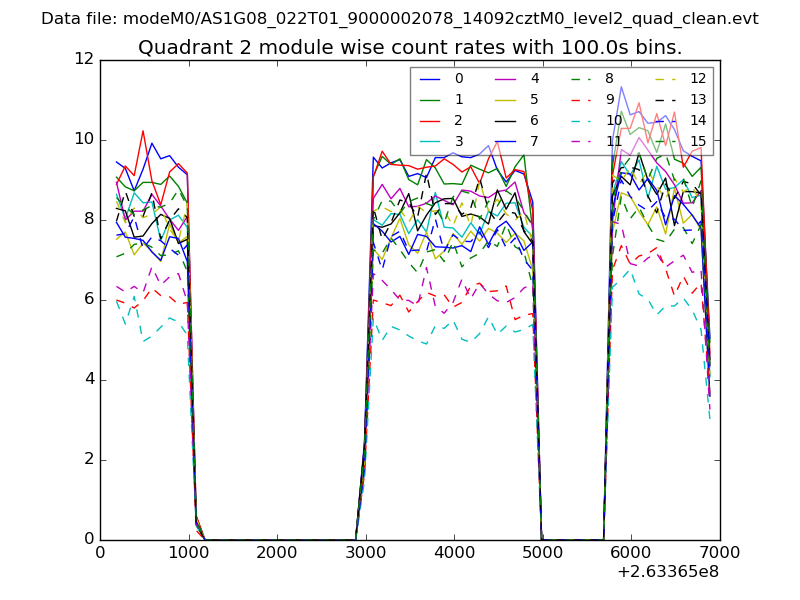
| Module-wise count rates for Quadrant B Data is divided into 100 sec bins |
 |
 |
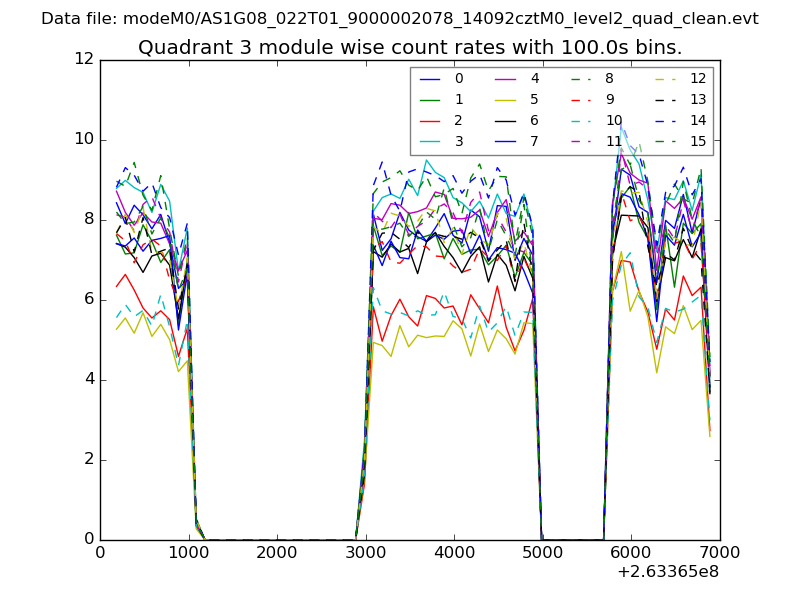
| Module-wise count rates for Quadrant C Data is divided into 100 sec bins |
 |
 |
| Module-wise count rates for Quadrant D Data is divided into 100 sec bins |
 |
 |
| Parameter | Plot |
|---|---|
| CZT HV Monitor | 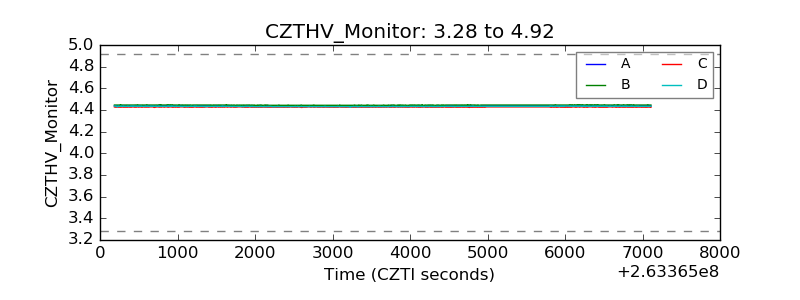 |
| D_VDD | 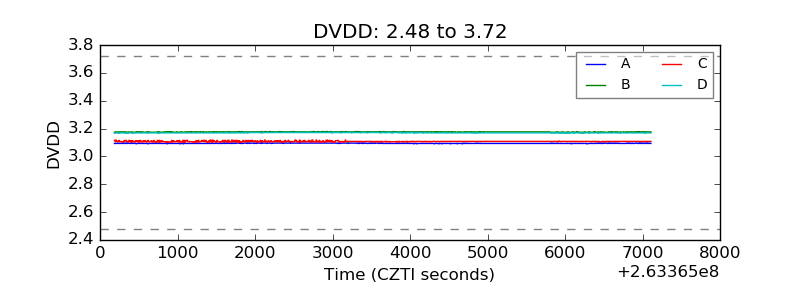 |
| Temperature 1 |  |
| Veto HV Monitor | 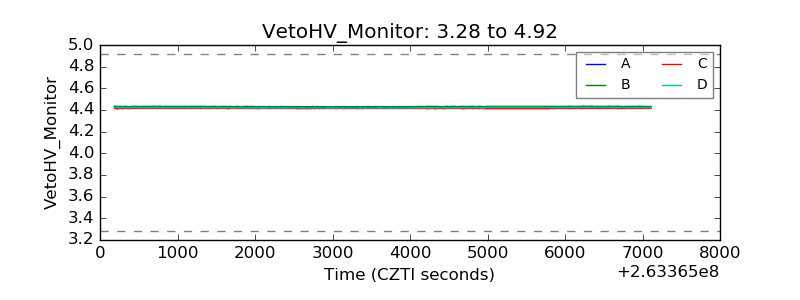 |
| Veto LLD | 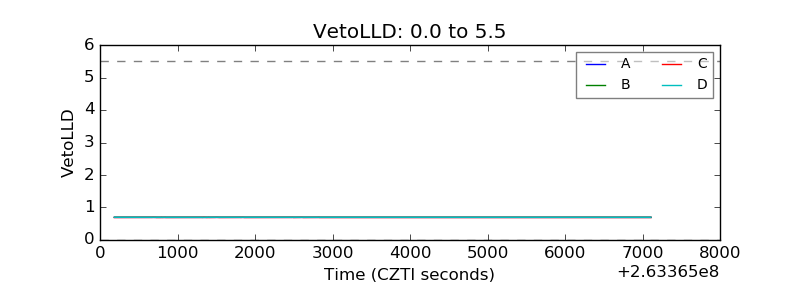 |
| Alpha Counter | 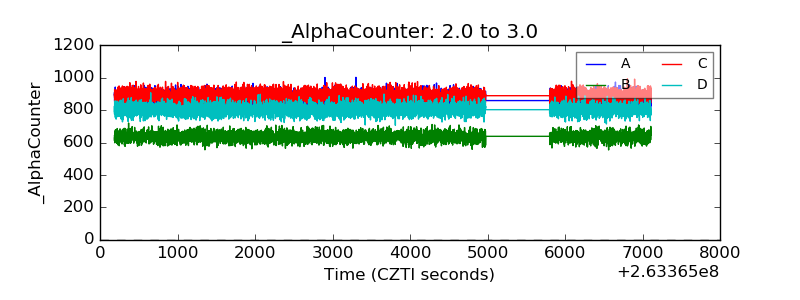 |
| _CPM_Rate | 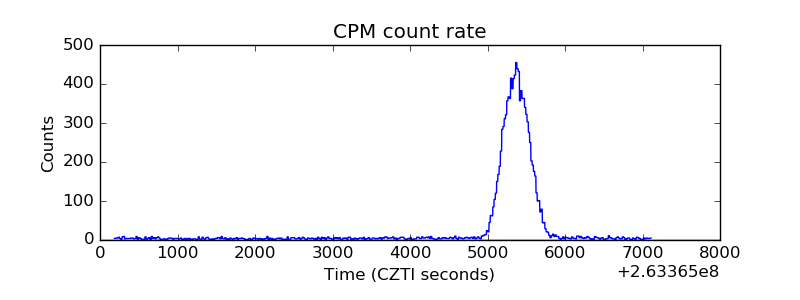 |
| CZT Counter | 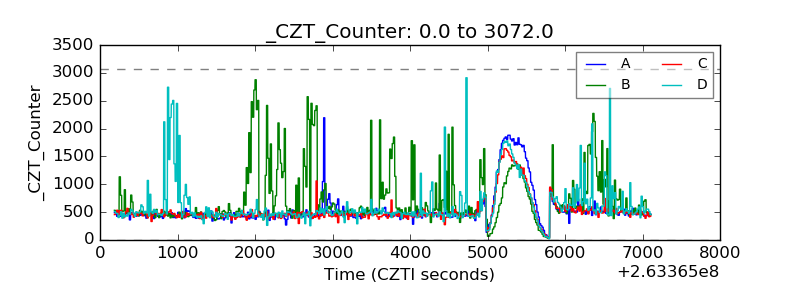 |
| +2.5 Volts monitor |  |
| +5 Volts monitor |  |
| _ROLL_ROT |  |
| _Roll_DEC | 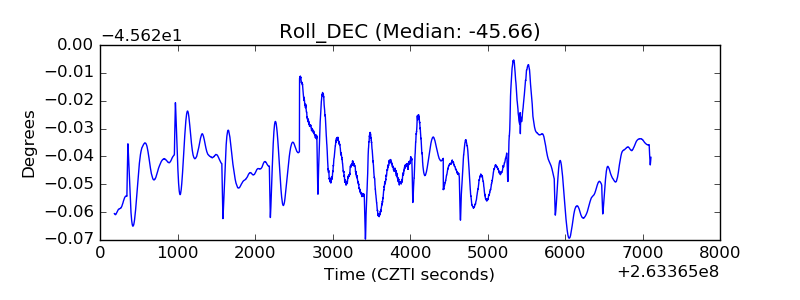 |
| _Roll_RA | 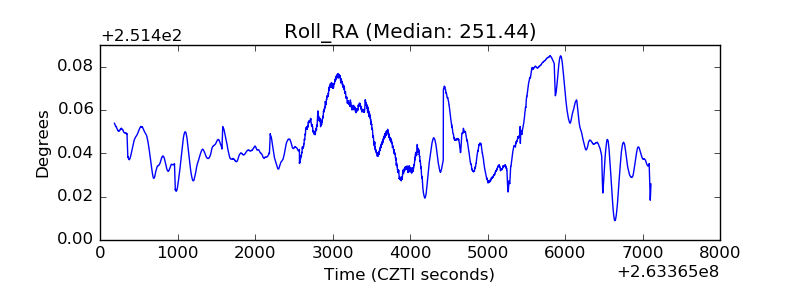 |
| Veto Counter |  |