| Param | Original file | Final file |
|---|---|---|
| Filename | modeM0/AS1G08_022T01_9000002078_14093cztM0_level2.evt | modeM0/AS1G08_022T01_9000002078_14093cztM0_level2_quad_clean.evt |
| Size (bytes) | 628,652,160 | 74,577,600 |
| Size | 599.5 MB | 71.1 MB |
| Events in quadrant A | 4,473,185 | 486,599 |
| Events in quadrant B | 5,727,593 | 436,217 |
| Events in quadrant C | 3,026,339 | 481,303 |
| Events in quadrant D | 5,389,565 | 418,380 |
| Mode SS | |||
|---|---|---|---|
| Quadrant | BADHDUFLAG | Total packets | Discarded packets |
| A | 0 | 126 | 0 |
| B | 0 | 126 | 0 |
| C | 0 | 126 | 0 |
| D | 0 | 126 | 0 |
| Mode M9 | |||
|---|---|---|---|
| Quadrant | BADHDUFLAG | Total packets | Discarded packets |
| A | 0 | 10 | 0 |
| B | 0 | 10 | 0 |
| C | 0 | 10 | 0 |
| D | 0 | 10 | 0 |
| Mode M0 | |||
|---|---|---|---|
| Quadrant | BADHDUFLAG | Total packets | Discarded packets |
| A | 0 | 17197 | 2 |
| B | 0 | 21110 | 1 |
| C | 0 | 12968 | 1 |
| D | 0 | 20100 | 1 |
| Quadrant | Total seconds | Saturated seconds | Saturation percentage |
|---|---|---|---|
| A | 6234 | 530 | 8.501765% |
| B | 6234 | 978 | 15.688162% |
| C | 6234 | 50 | 0.802053% |
| D | 6234 | 984 | 15.784408% |
Noise dominated data is calculated using 1-second bins in cleaned event files. If a bin has >2000 counts, and if more than 50% of those come from <1% of pixels, then it is considered to be noise-dominated and hence unusable.
| Quadrant | # 1 sec bins | Bins with >0 counts | Bins with >2000 counts | High rate bins dominated by noise | Noise dominated (total time) | Noise dominated (detector-on time) | Marked lightcurve |
|---|---|---|---|---|---|---|---|
| A | 7225 | 6236 | 374 | 374 | 5.18% | 6.00% | 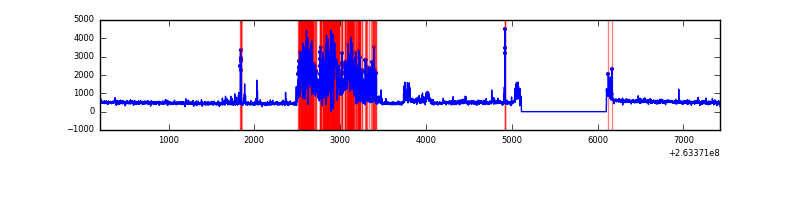 |
| B | 7225 | 6235 | 532 | 532 | 7.36% | 8.53% | 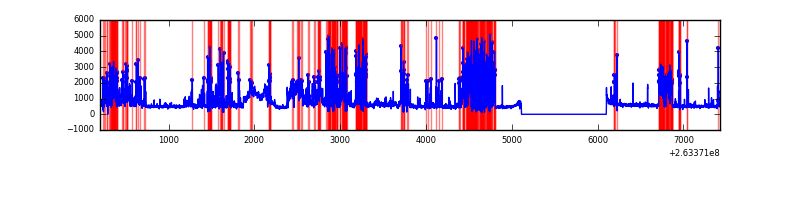 |
| C | 7225 | 6236 | 2 | 2 | 0.03% | 0.03% | 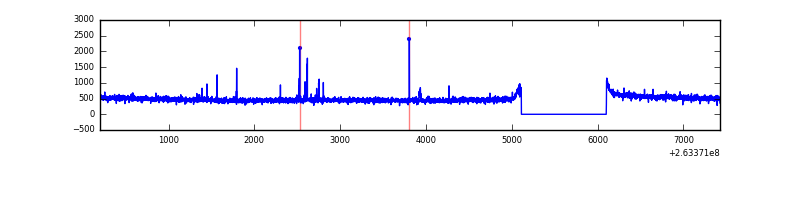 |
| D | 7225 | 6235 | 561 | 561 | 7.76% | 9.00% | 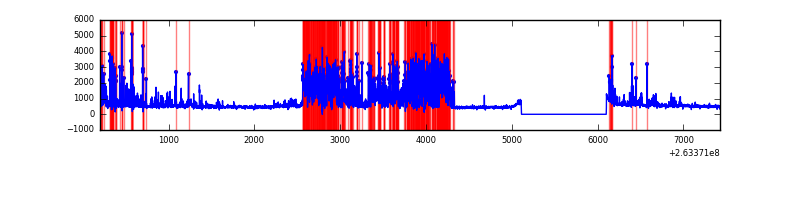 |
Top three noisy pixels from each quadrant. If the there are fewer than three noisy pixels in the level2.evt file, extra rows are filled as -1
| Pixel properties | Quadrant properties | ||||||
|---|---|---|---|---|---|---|---|
| Quadrant | DetID | PixID | Counts | Sigma | Mean | Median | Sigma |
| A | 15 | 222 | 1326944 | 8850.25 | 738 | 721 | 149.9 |
| A | 9 | 143 | 232427 | 1546.24 | 738 | 721 | 149.9 |
| A | 12 | 189 | 43479 | 285.34 | 738 | 721 | 149.9 |
| B | 10 | 16 | 2501497 | 18769.42 | 700 | 682 | 133.2 |
| B | 10 | 245 | 368626 | 2761.54 | 700 | 682 | 133.2 |
| B | 4 | 80 | 45096 | 333.34 | 700 | 682 | 133.2 |
| C | 3 | 233 | 104814 | 611.37 | 741 | 745 | 170.2 |
| C | 0 | 207 | 24390 | 138.91 | 741 | 745 | 170.2 |
| C | 10 | 22 | 7179 | 37.8 | 741 | 745 | 170.2 |
| D | 1 | 52 | 2296956 | 13641.76 | 695 | 672 | 168.3 |
| D | 2 | 152 | 159294 | 942.34 | 695 | 672 | 168.3 |
| D | 8 | 195 | 96585 | 569.8 | 695 | 672 | 168.3 |
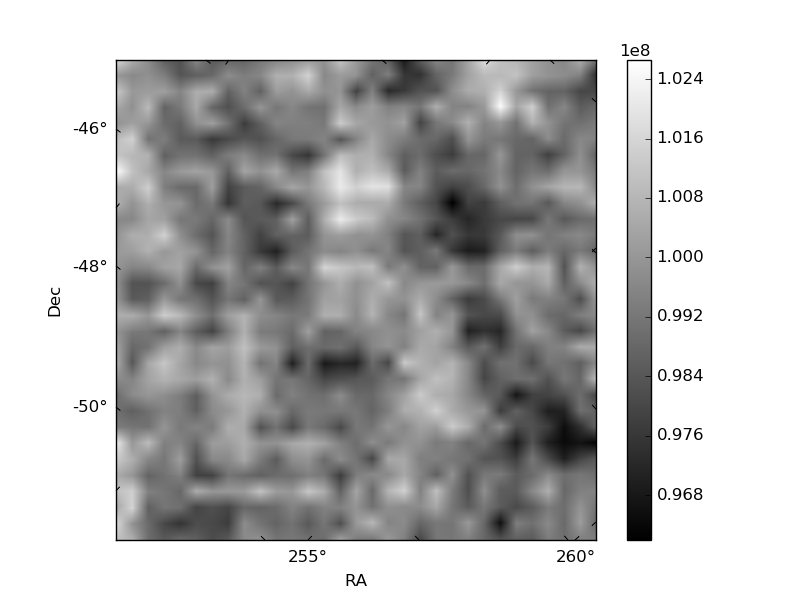
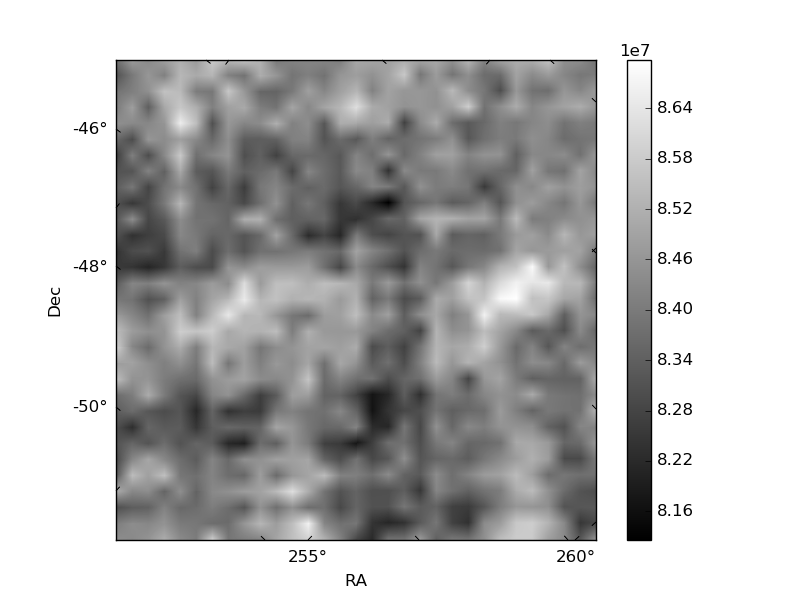
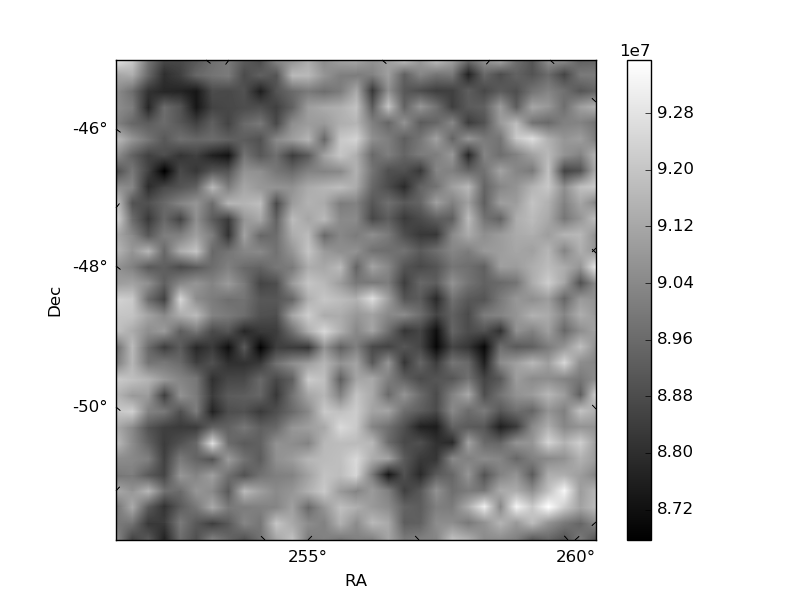
Histogram calculated using DETX and DETY for each event in the final _common_clean file
| Quadrant A | 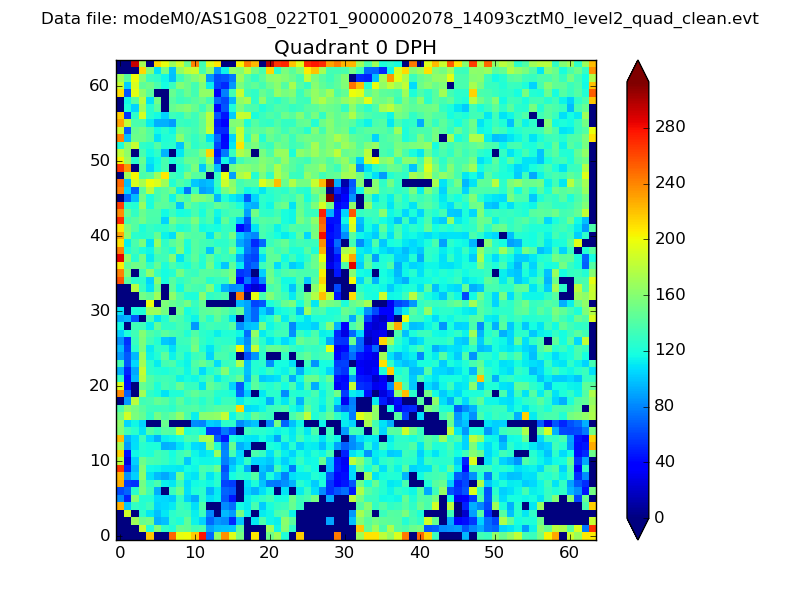 |
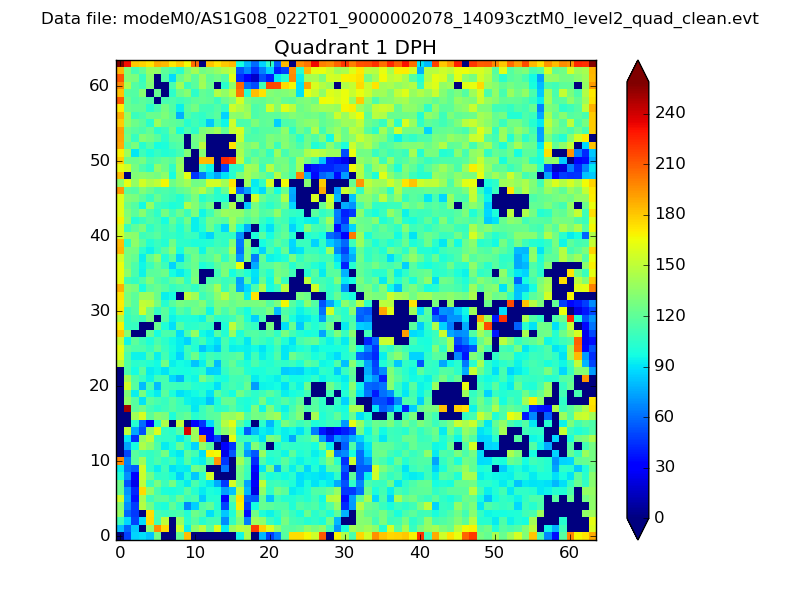 |
Quadrant B |
|---|---|---|---|
| Quadrant D | 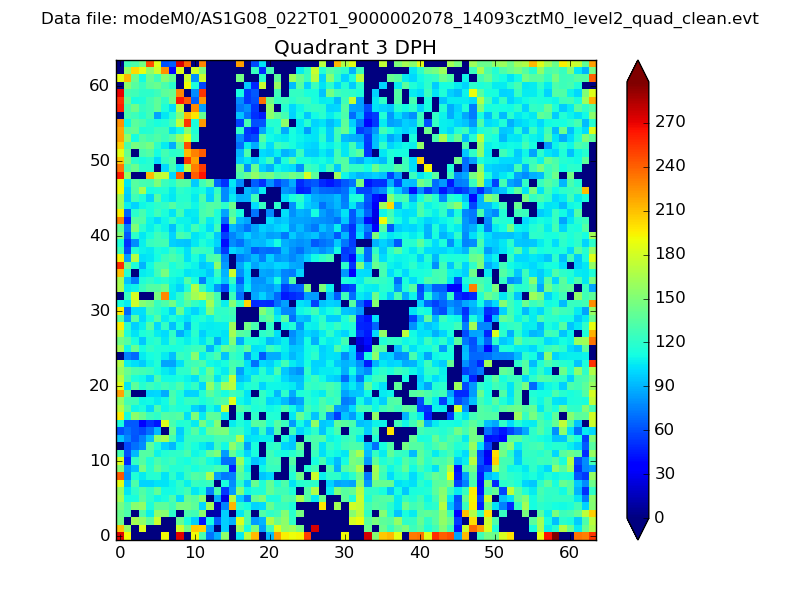 |
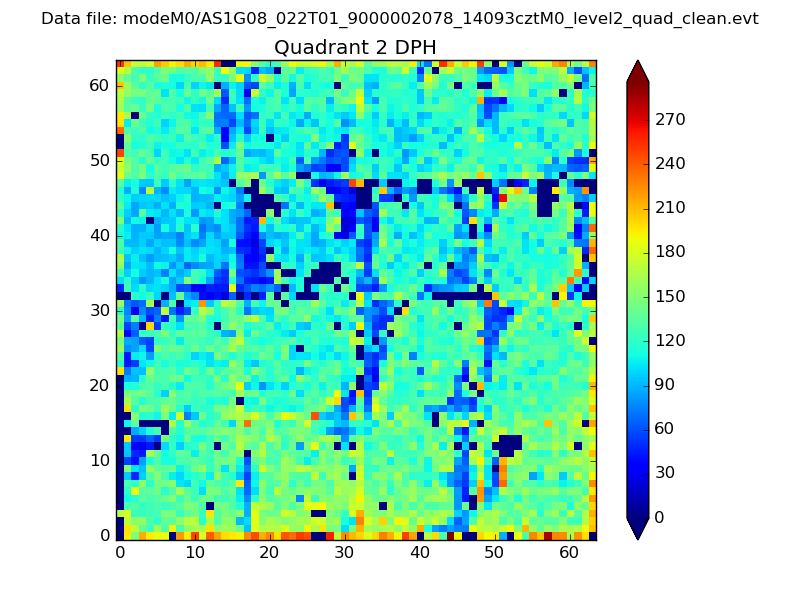 |
Quadrant C |
| Plot type | Count rate plots | Images |
|---|---|---|
| Comparison with Poisson distribution Blue bars denote a histogram of data divided into 1 sec bins. Red curve is a Poisson curve with rate = median count rate of data. |
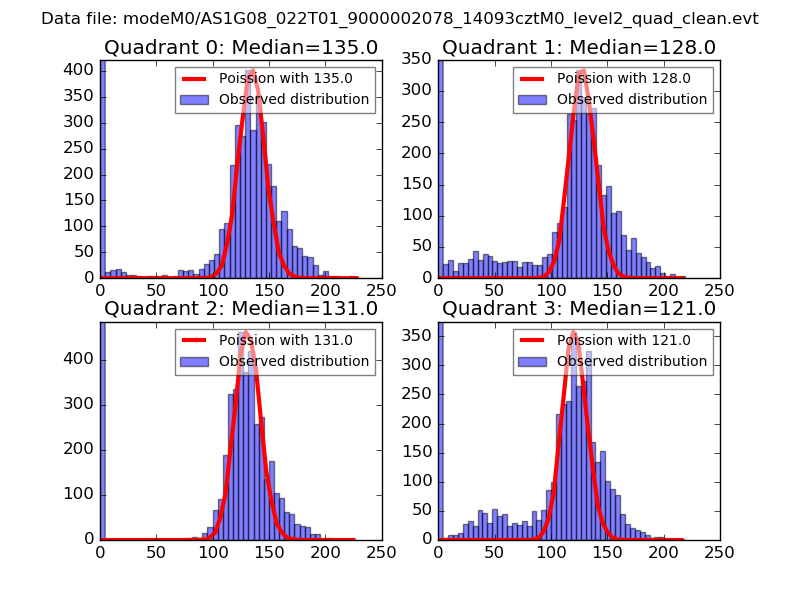 |
 |
| Quadrant-wise count rates Data is divided into 100 sec bins |
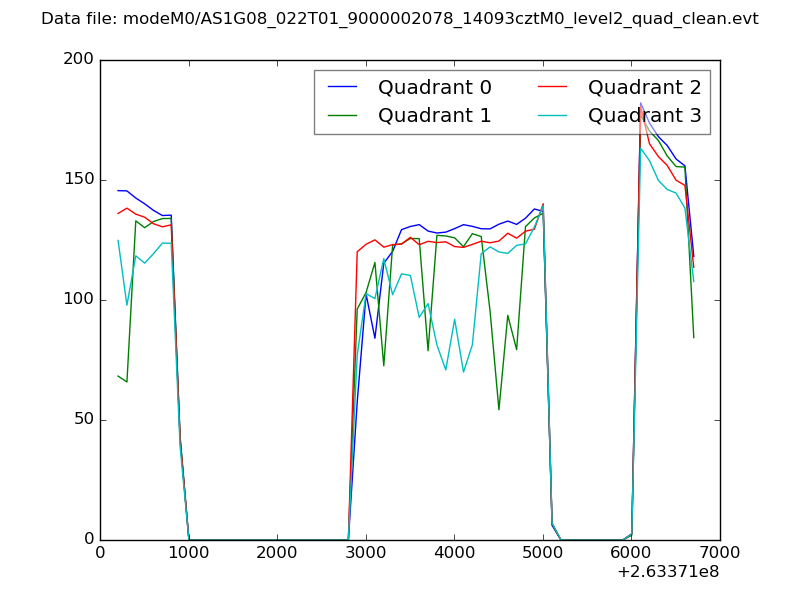 |
|
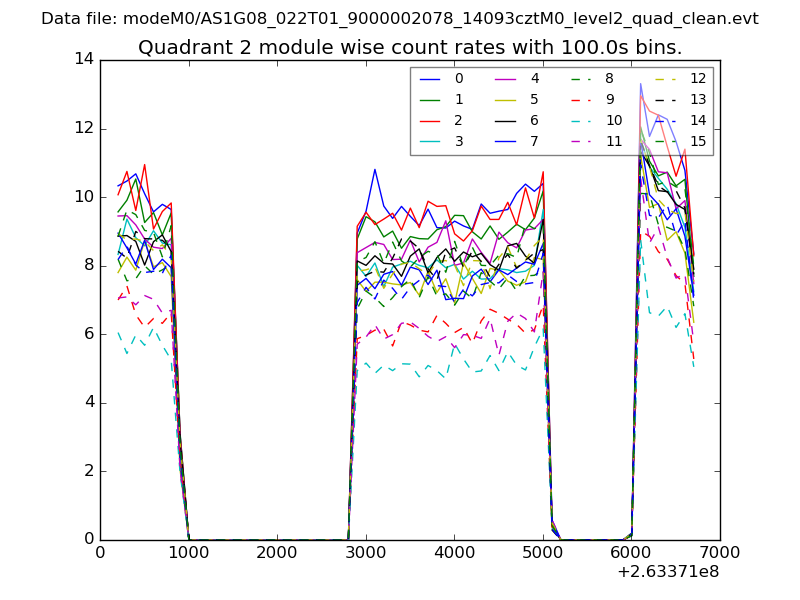
| Module-wise count rates for Quadrant A Data is divided into 100 sec bins |
 |
 |
| Module-wise count rates for Quadrant B Data is divided into 100 sec bins |
 |
 |
| Module-wise count rates for Quadrant C Data is divided into 100 sec bins |
 |
 |
| Module-wise count rates for Quadrant D Data is divided into 100 sec bins |
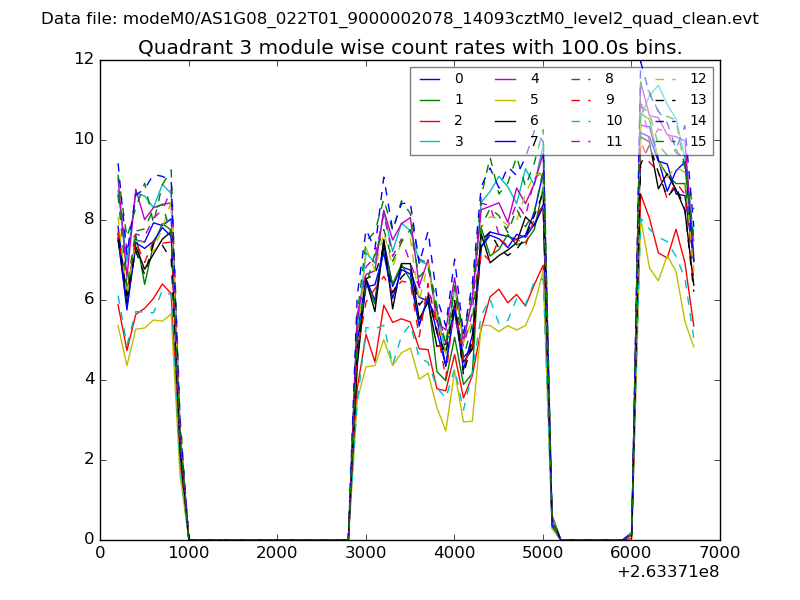 |
 |
| Parameter | Plot |
|---|---|
| CZT HV Monitor | 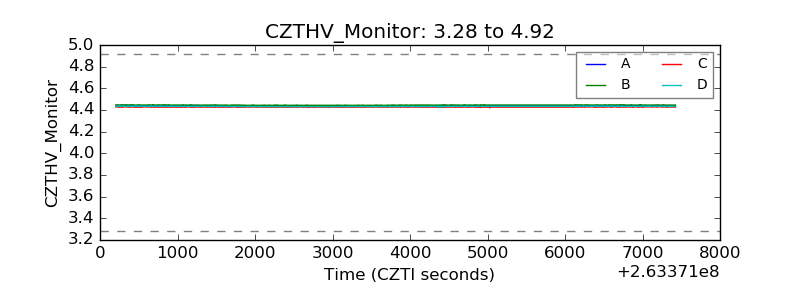 |
| D_VDD | 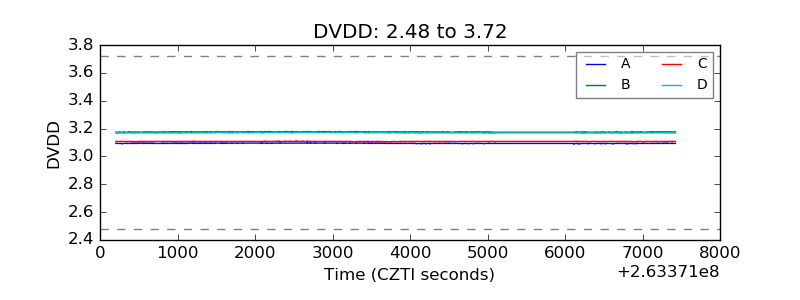 |
| Temperature 1 | 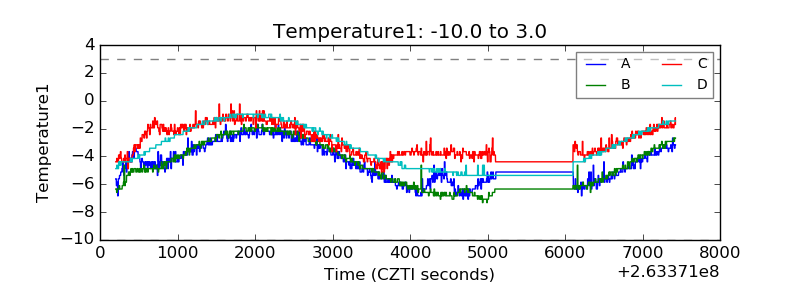 |
| Veto HV Monitor | 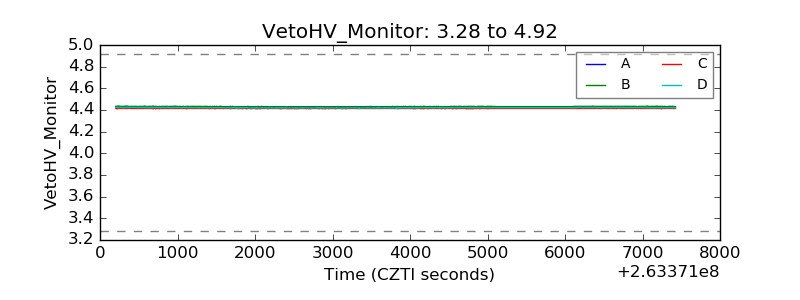 |
| Veto LLD |  |
| Alpha Counter | 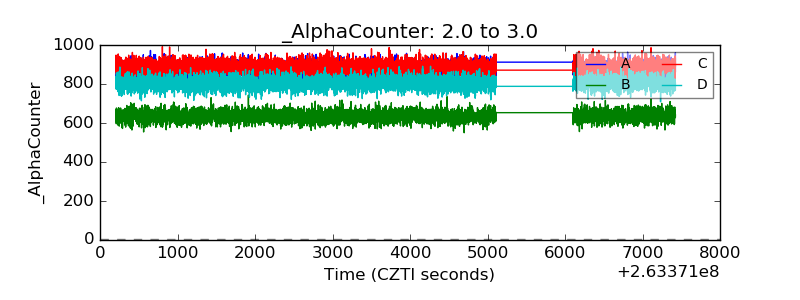 |
| _CPM_Rate | 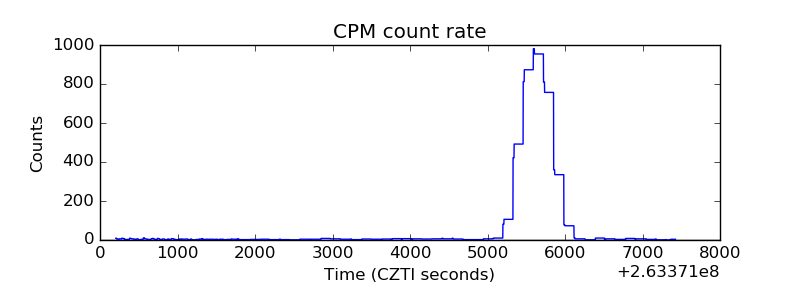 |
| CZT Counter | 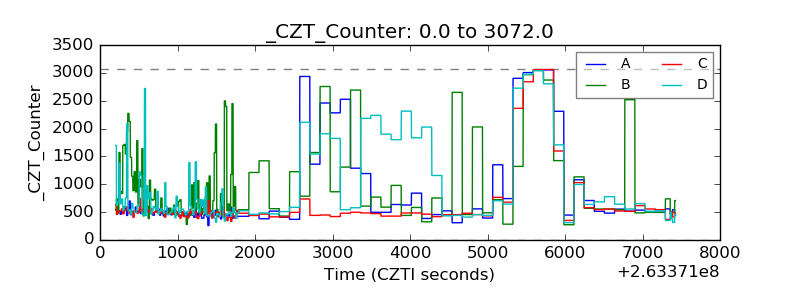 |
| +2.5 Volts monitor |  |
| +5 Volts monitor |  |
| _ROLL_ROT | 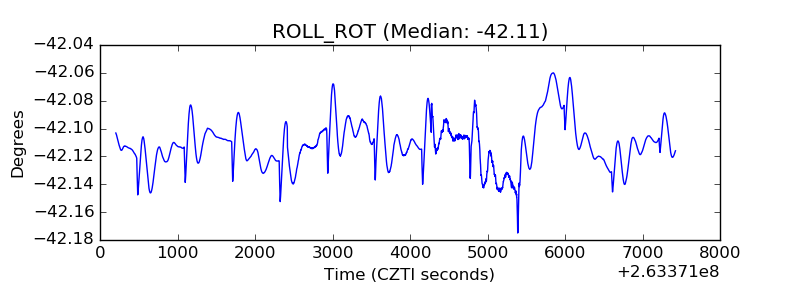 |
| _Roll_DEC | 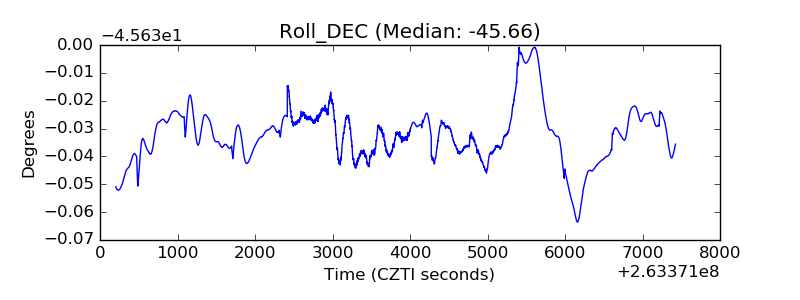 |
| _Roll_RA | 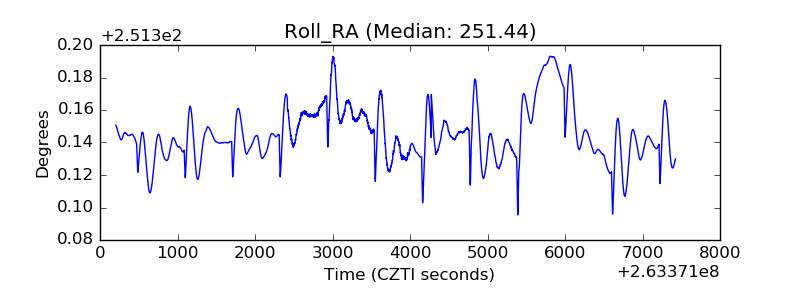 |
| Veto Counter | 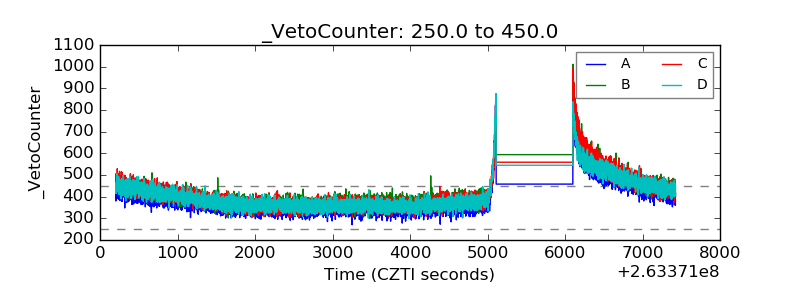 |