| Param | Original file | Final file |
|---|---|---|
| Filename | modeM0/AS1G08_022T01_9000002078_14095cztM0_level2.evt | modeM0/AS1G08_022T01_9000002078_14095cztM0_level2_quad_clean.evt |
| Size (bytes) | 522,915,840 | 77,889,600 |
| Size | 498.7 MB | 74.3 MB |
| Events in quadrant A | 3,481,439 | 492,218 |
| Events in quadrant B | 4,829,899 | 471,840 |
| Events in quadrant C | 3,427,909 | 471,790 |
| Events in quadrant D | 3,640,976 | 453,941 |
| Mode SS | |||
|---|---|---|---|
| Quadrant | BADHDUFLAG | Total packets | Discarded packets |
| A | 0 | 136 | 0 |
| B | 0 | 136 | 0 |
| C | 0 | 136 | 0 |
| D | 0 | 136 | 0 |
| Mode M9 | |||
|---|---|---|---|
| Quadrant | BADHDUFLAG | Total packets | Discarded packets |
| A | 0 | 14 | 0 |
| B | 0 | 14 | 0 |
| C | 0 | 14 | 0 |
| D | 0 | 15 | 0 |
| Mode M0 | |||
|---|---|---|---|
| Quadrant | BADHDUFLAG | Total packets | Discarded packets |
| A | 0 | 14751 | 3 |
| B | 0 | 18789 | 2 |
| C | 0 | 14477 | 2 |
| D | 0 | 15165 | 2 |
| Quadrant | Total seconds | Saturated seconds | Saturation percentage |
|---|---|---|---|
| A | 6725 | 103 | 1.531599% |
| B | 6725 | 493 | 7.330855% |
| C | 6725 | 76 | 1.130112% |
| D | 6725 | 119 | 1.769517% |
Noise dominated data is calculated using 1-second bins in cleaned event files. If a bin has >2000 counts, and if more than 50% of those come from <1% of pixels, then it is considered to be noise-dominated and hence unusable.
| Quadrant | # 1 sec bins | Bins with >0 counts | Bins with >2000 counts | High rate bins dominated by noise | Noise dominated (total time) | Noise dominated (detector-on time) | Marked lightcurve |
|---|---|---|---|---|---|---|---|
| A | 7846 | 6727 | 2 | 2 | 0.03% | 0.03% | 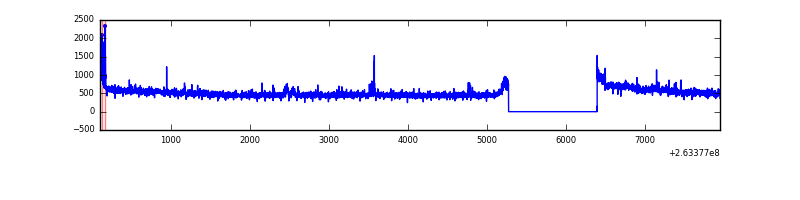 |
| B | 7846 | 6724 | 246 | 246 | 3.14% | 3.66% | 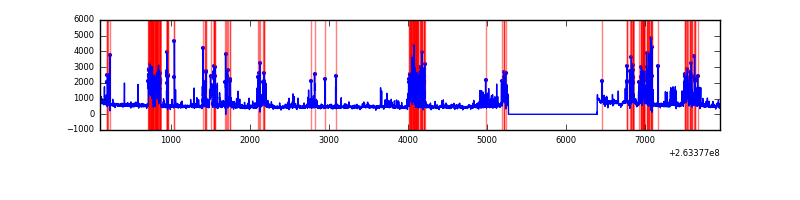 |
| C | 7846 | 6726 | 3 | 3 | 0.04% | 0.04% | 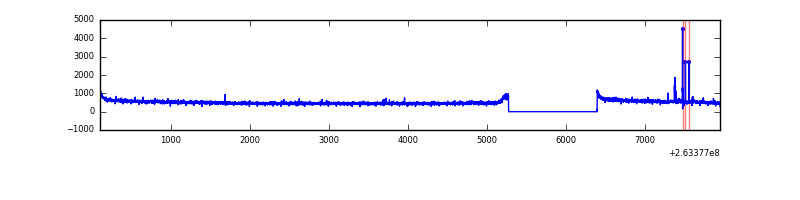 |
| D | 7846 | 6727 | 26 | 26 | 0.33% | 0.39% | 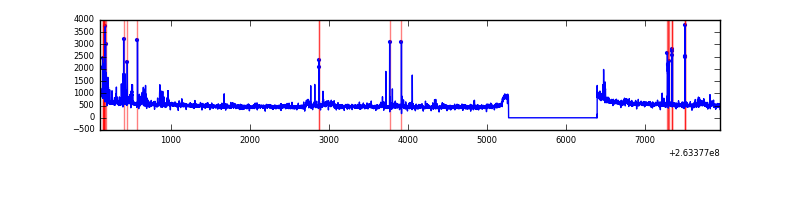 |
Top three noisy pixels from each quadrant. If the there are fewer than three noisy pixels in the level2.evt file, extra rows are filled as -1
| Pixel properties | Quadrant properties | ||||||
|---|---|---|---|---|---|---|---|
| Quadrant | DetID | PixID | Counts | Sigma | Mean | Median | Sigma |
| A | 15 | 222 | 103945 | 589.77 | 868 | 849 | 174.8 |
| A | 12 | 189 | 21879 | 120.31 | 868 | 849 | 174.8 |
| A | 8 | 15 | 11933 | 63.41 | 868 | 849 | 174.8 |
| B | 10 | 16 | 1308549 | 8285.15 | 838 | 816 | 157.8 |
| B | 0 | 189 | 95727 | 601.31 | 838 | 816 | 157.8 |
| B | 4 | 80 | 53063 | 331.01 | 838 | 816 | 157.8 |
| C | 3 | 233 | 132150 | 687.29 | 835 | 841 | 191.1 |
| C | 10 | 22 | 26028 | 131.83 | 835 | 841 | 191.1 |
| C | 0 | 207 | 13738 | 67.51 | 835 | 841 | 191.1 |
| D | 7 | 80 | 142874 | 709.02 | 836 | 811 | 200.4 |
| D | 8 | 195 | 94389 | 467.04 | 836 | 811 | 200.4 |
| D | 1 | 52 | 79736 | 393.91 | 836 | 811 | 200.4 |
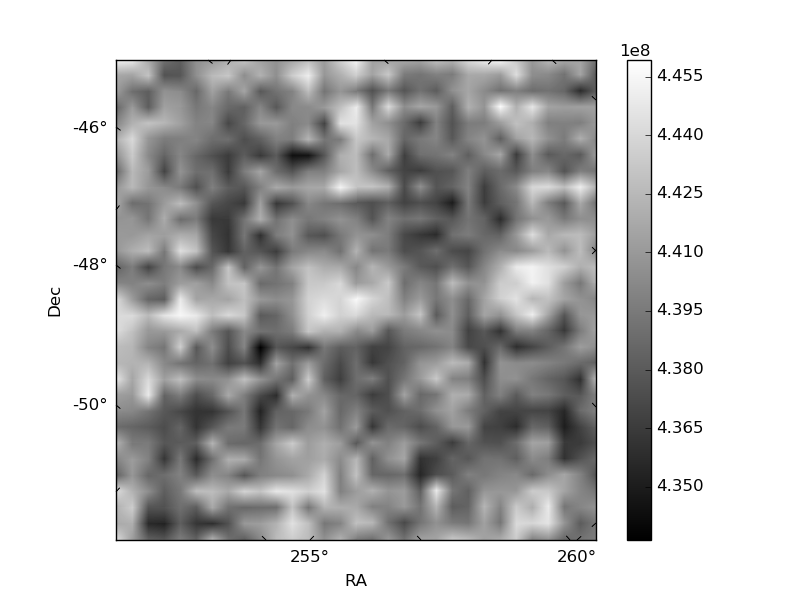
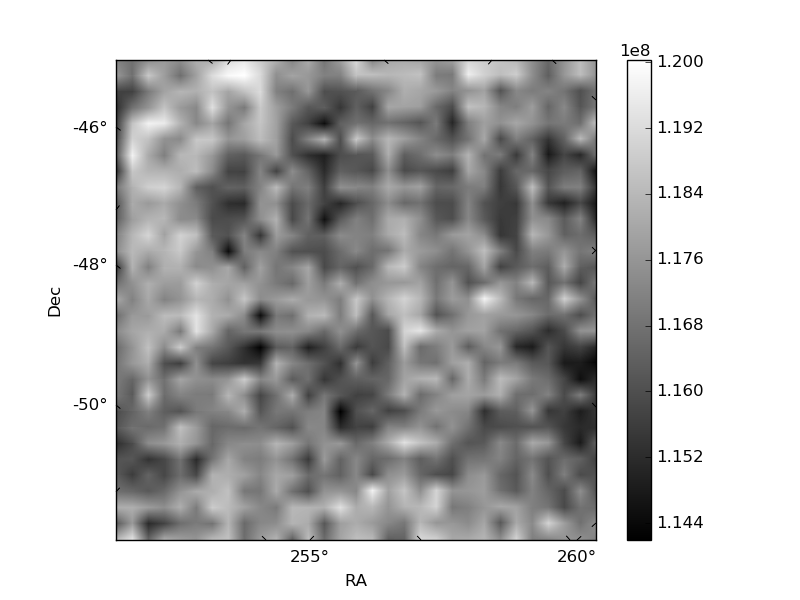
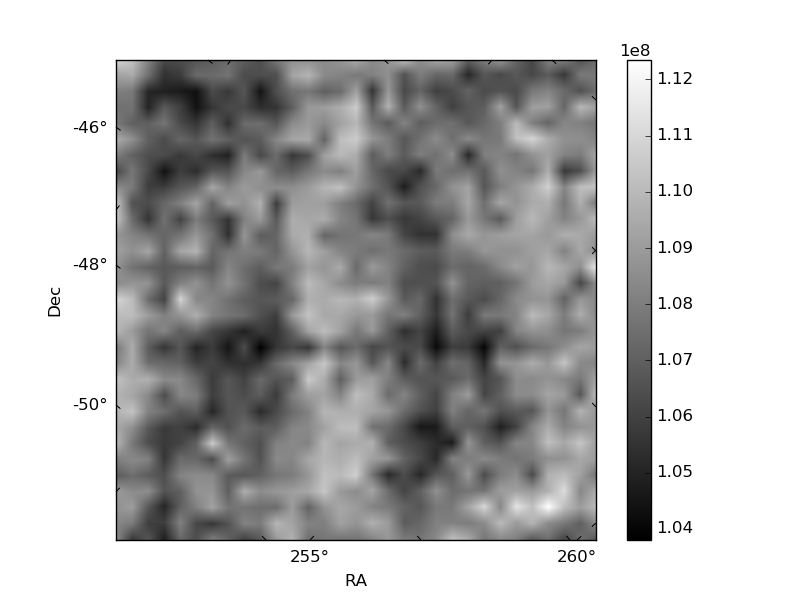
Histogram calculated using DETX and DETY for each event in the final _common_clean file
| Quadrant A | 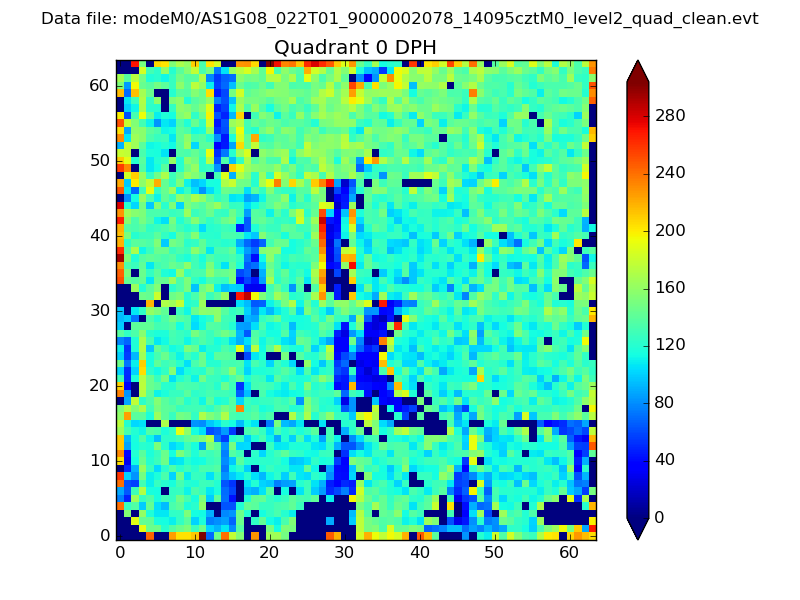 |
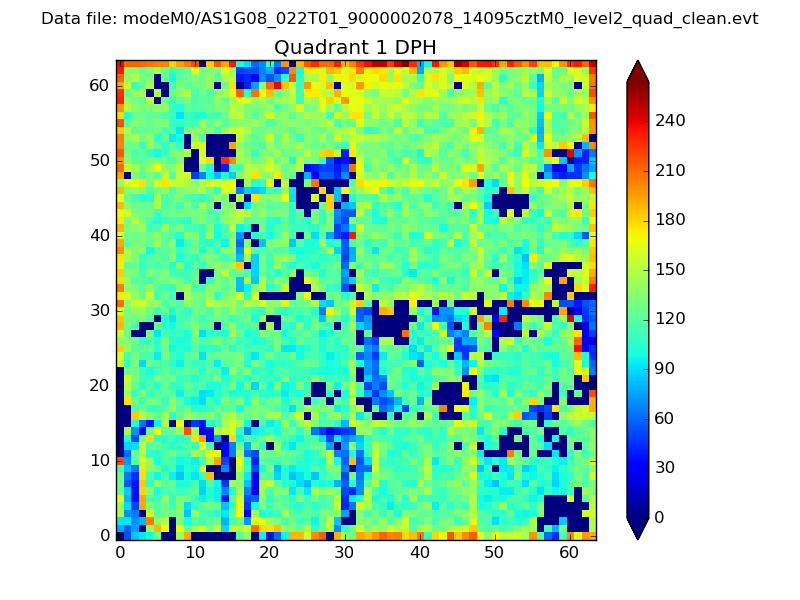 |
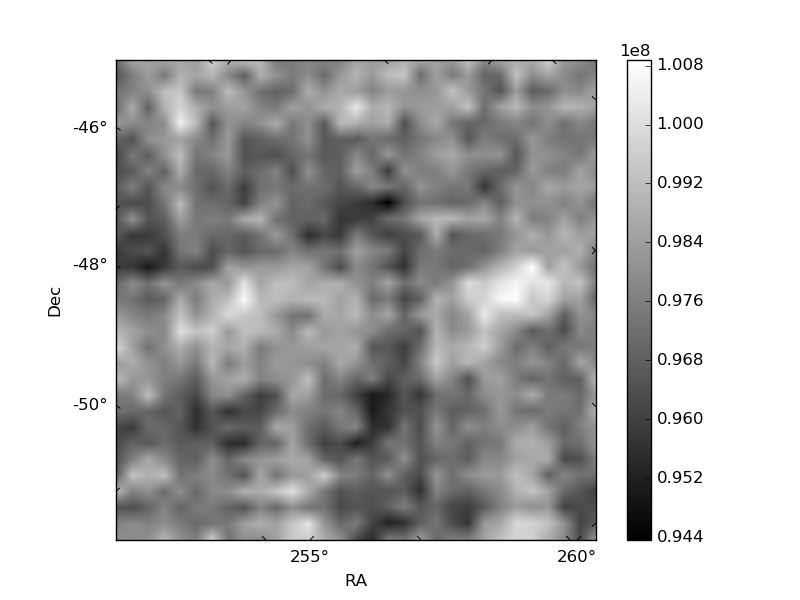
Quadrant B |
|---|---|---|---|
| Quadrant D | 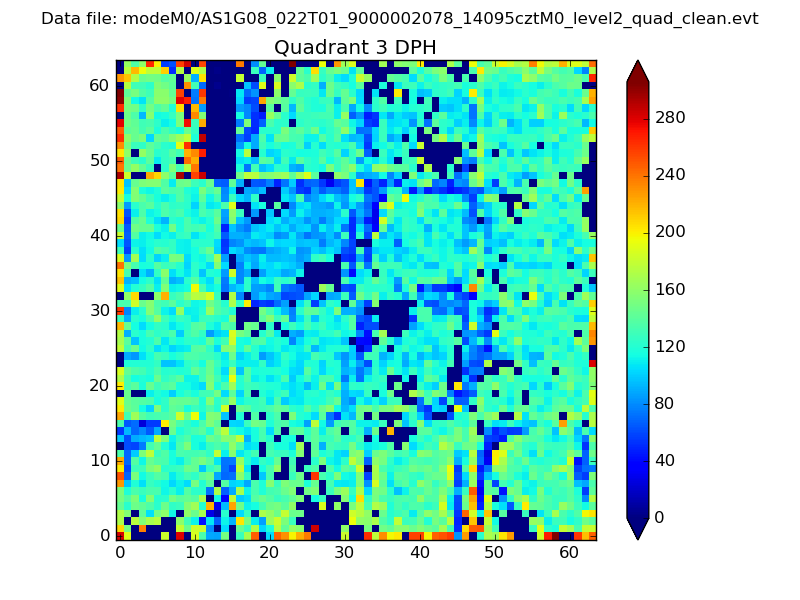 |
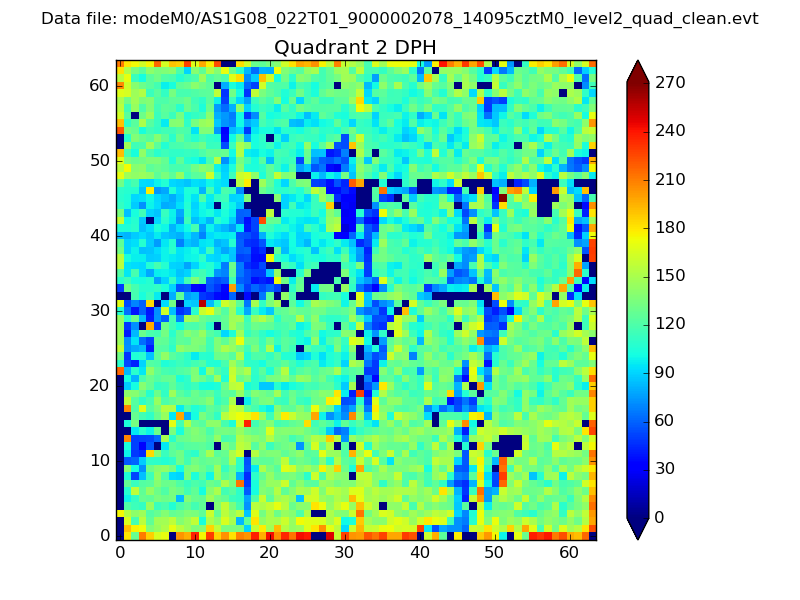 |
Quadrant C |
| Plot type | Count rate plots | Images |
|---|---|---|
| Comparison with Poisson distribution Blue bars denote a histogram of data divided into 1 sec bins. Red curve is a Poisson curve with rate = median count rate of data. |
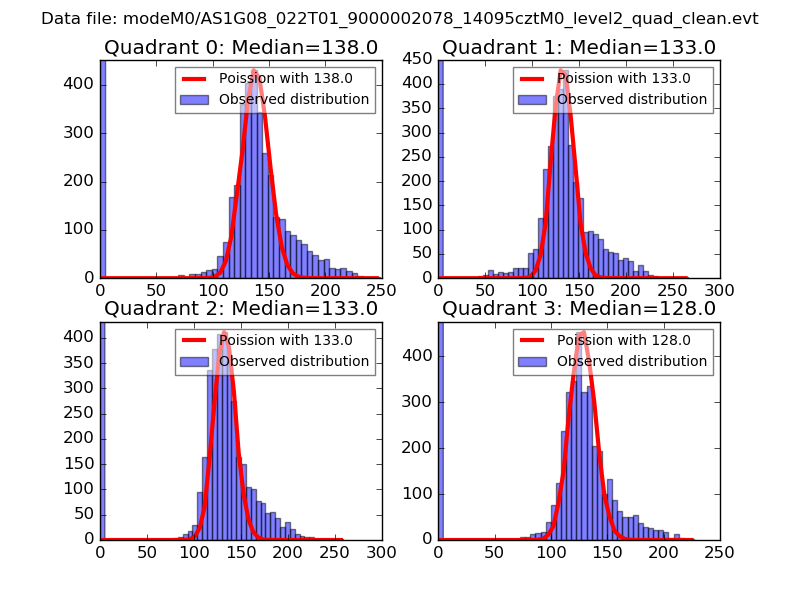 |
 |
| Quadrant-wise count rates Data is divided into 100 sec bins |
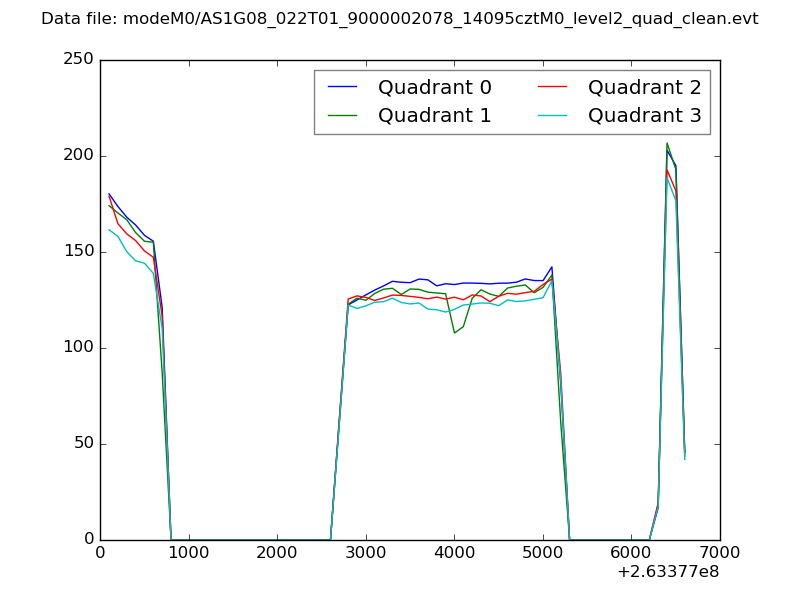 |
|
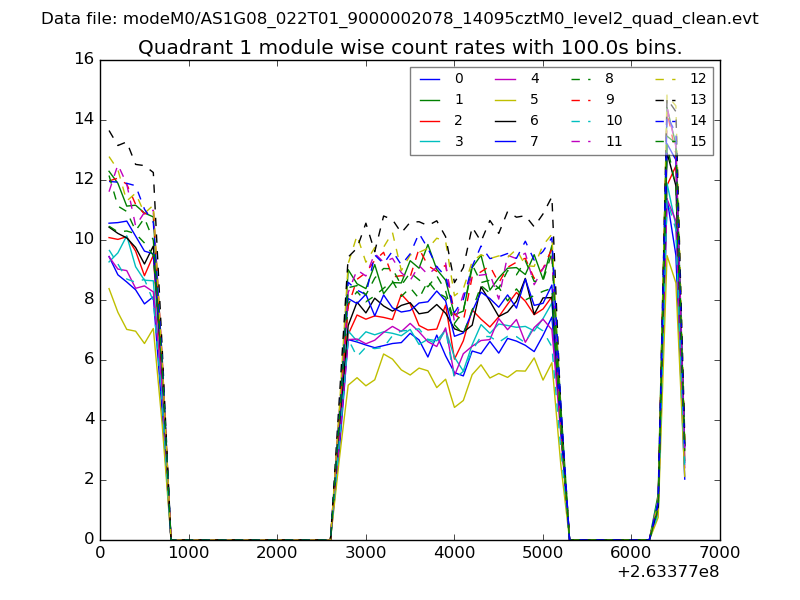
| Module-wise count rates for Quadrant A Data is divided into 100 sec bins |
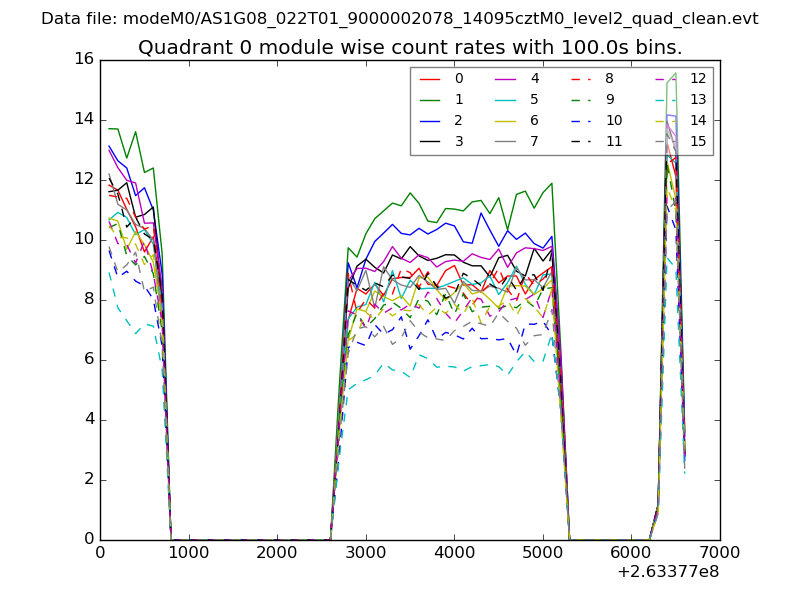 |
 |
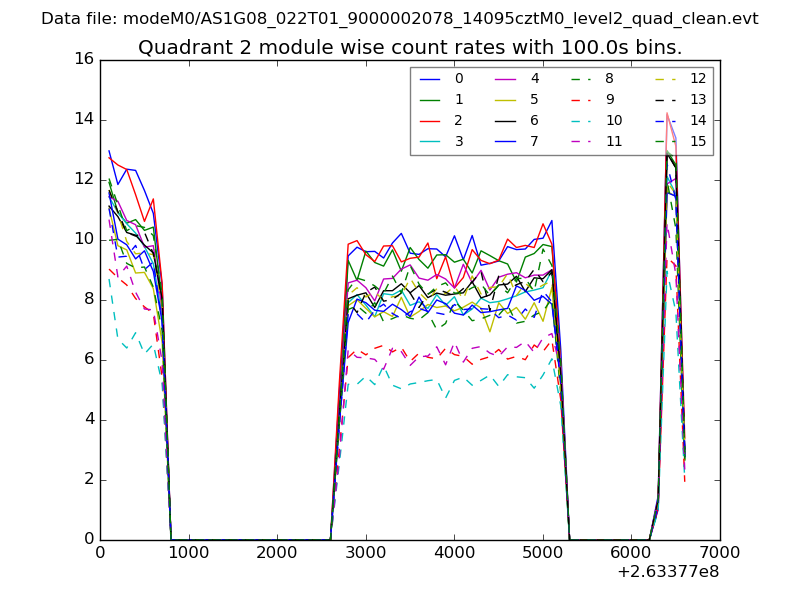
| Module-wise count rates for Quadrant B Data is divided into 100 sec bins |
 |
 |
| Module-wise count rates for Quadrant C Data is divided into 100 sec bins |
 |
 |
| Module-wise count rates for Quadrant D Data is divided into 100 sec bins |
 |
 |
| Parameter | Plot |
|---|---|
| CZT HV Monitor | 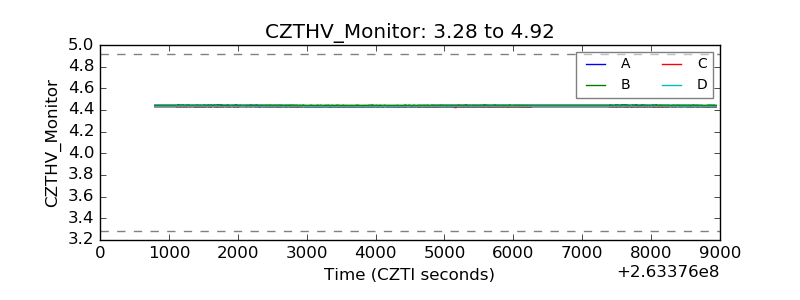 |
| D_VDD | 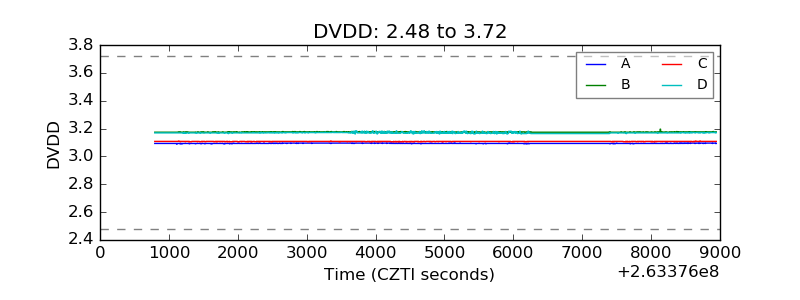 |
| Temperature 1 |  |
| Veto HV Monitor | 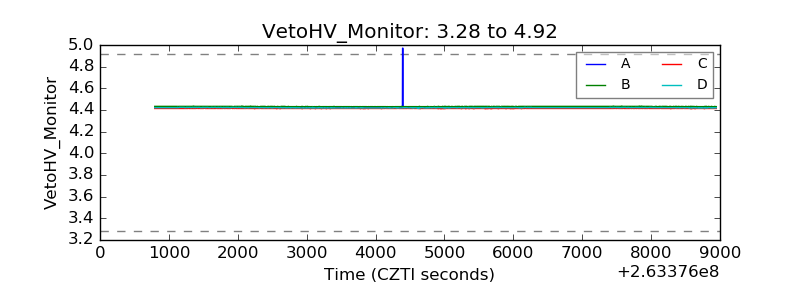 |
| Veto LLD | 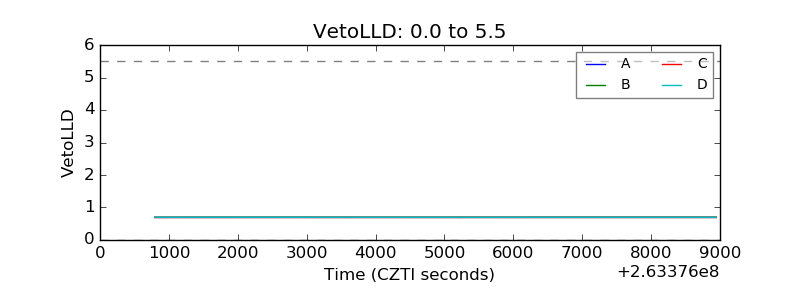 |
| Alpha Counter | 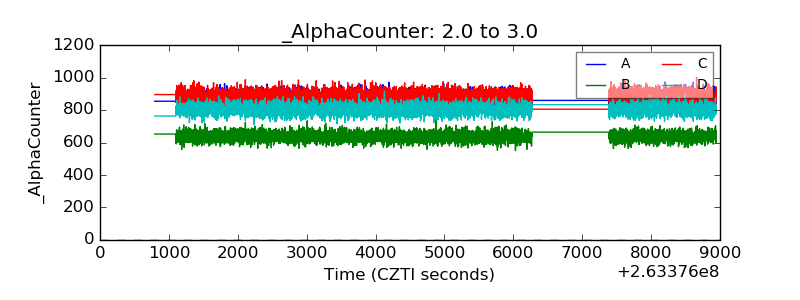 |
| _CPM_Rate | 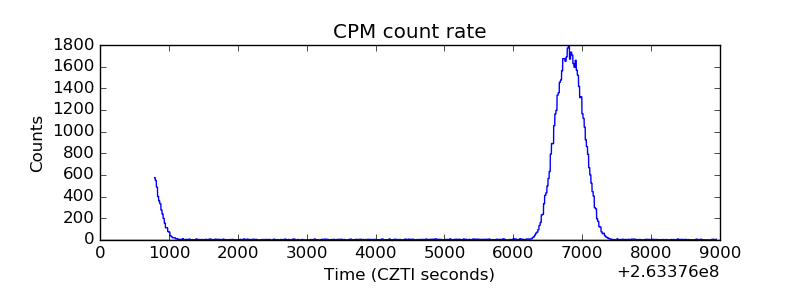 |
| CZT Counter | 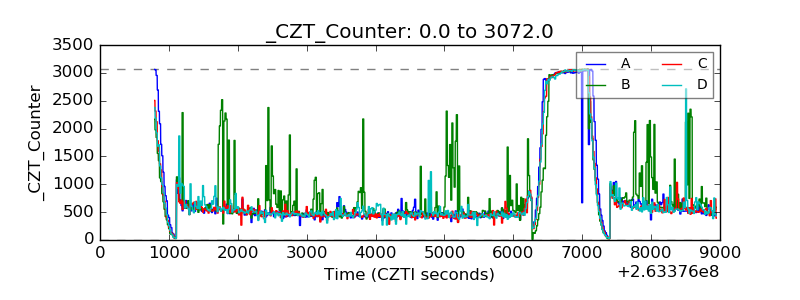 |
| +2.5 Volts monitor |  |
| +5 Volts monitor |  |
| _ROLL_ROT | 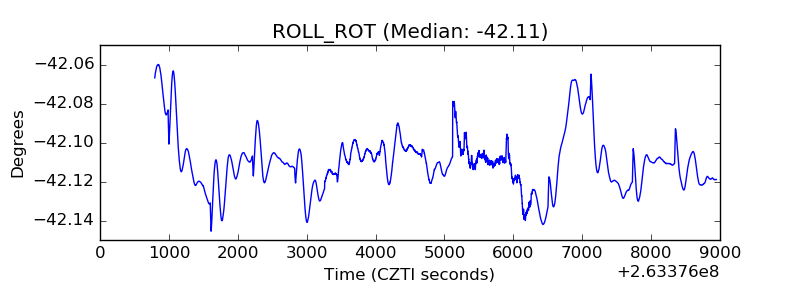 |
| _Roll_DEC |  |
| _Roll_RA | 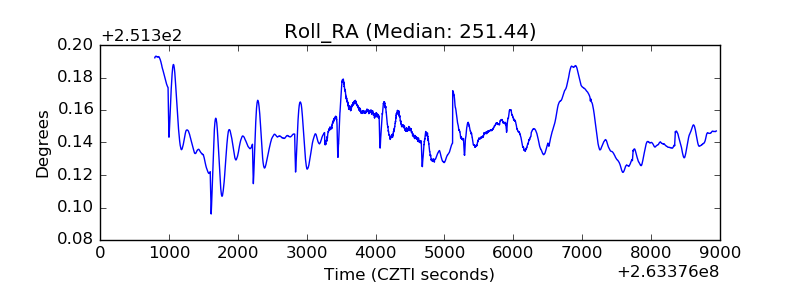 |
| Veto Counter | 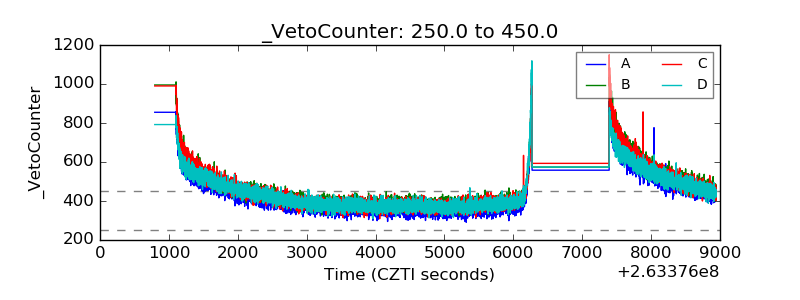 |