| Param | Original file | Final file |
|---|---|---|
| Filename | modeM0/AS1G08_022T01_9000002078_14096cztM0_level2.evt | modeM0/AS1G08_022T01_9000002078_14096cztM0_level2_quad_clean.evt |
| Size (bytes) | 519,960,960 | 70,960,320 |
| Size | 495.9 MB | 67.7 MB |
| Events in quadrant A | 3,558,407 | 439,897 |
| Events in quadrant B | 4,575,712 | 423,266 |
| Events in quadrant C | 3,515,099 | 417,631 |
| Events in quadrant D | 3,646,931 | 404,190 |
| Mode SS | |||
|---|---|---|---|
| Quadrant | BADHDUFLAG | Total packets | Discarded packets |
| A | 0 | 136 | 0 |
| B | 0 | 136 | 0 |
| C | 0 | 136 | 0 |
| D | 0 | 136 | 0 |
| Mode M9 | |||
|---|---|---|---|
| Quadrant | BADHDUFLAG | Total packets | Discarded packets |
| A | 0 | 18 | 0 |
| B | 0 | 18 | 0 |
| C | 0 | 18 | 0 |
| D | 0 | 19 | 0 |
| Mode M0 | |||
|---|---|---|---|
| Quadrant | BADHDUFLAG | Total packets | Discarded packets |
| A | 0 | 14905 | 3 |
| B | 0 | 18112 | 2 |
| C | 0 | 14683 | 2 |
| D | 0 | 15166 | 2 |
| Quadrant | Total seconds | Saturated seconds | Saturation percentage |
|---|---|---|---|
| A | 6644 | 84 | 1.264299% |
| B | 6644 | 330 | 4.966887% |
| C | 6644 | 75 | 1.128838% |
| D | 6644 | 101 | 1.520169% |
Noise dominated data is calculated using 1-second bins in cleaned event files. If a bin has >2000 counts, and if more than 50% of those come from <1% of pixels, then it is considered to be noise-dominated and hence unusable.
| Quadrant | # 1 sec bins | Bins with >0 counts | Bins with >2000 counts | High rate bins dominated by noise | Noise dominated (total time) | Noise dominated (detector-on time) | Marked lightcurve |
|---|---|---|---|---|---|---|---|
| A | 7880 | 6646 | 0 | 0 | 0.00% | 0.00% | 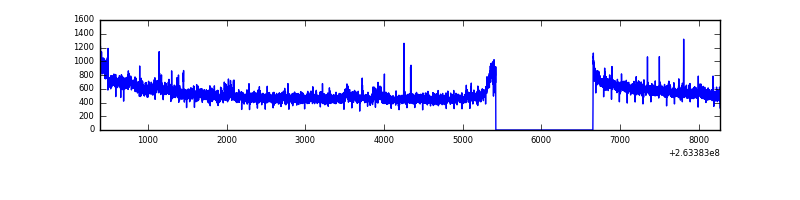 |
| B | 7880 | 6645 | 162 | 162 | 2.06% | 2.44% | 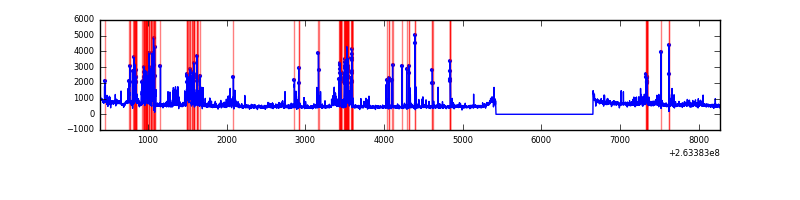 |
| C | 7880 | 6645 | 4 | 4 | 0.05% | 0.06% | 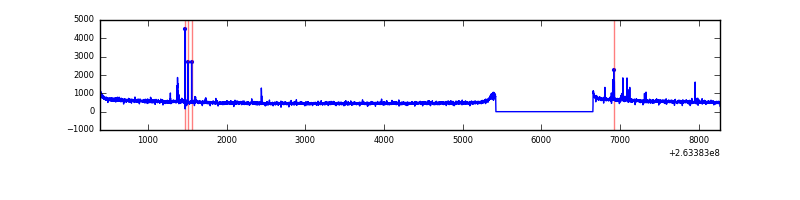 |
| D | 7880 | 6646 | 25 | 25 | 0.32% | 0.38% | 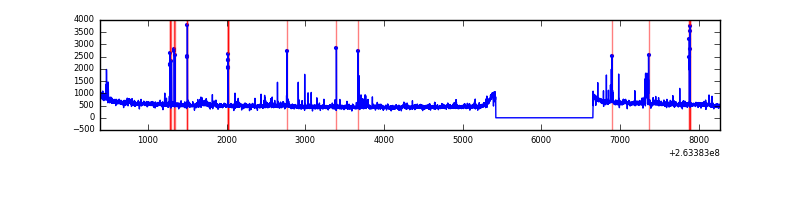 |
Top three noisy pixels from each quadrant. If the there are fewer than three noisy pixels in the level2.evt file, extra rows are filled as -1
| Pixel properties | Quadrant properties | ||||||
|---|---|---|---|---|---|---|---|
| Quadrant | DetID | PixID | Counts | Sigma | Mean | Median | Sigma |
| A | 15 | 222 | 97630 | 542.8 | 891 | 874 | 178.3 |
| A | 12 | 189 | 19113 | 102.32 | 891 | 874 | 178.3 |
| A | 9 | 143 | 10576 | 54.43 | 891 | 874 | 178.3 |
| B | 10 | 16 | 884546 | 5498.1 | 869 | 850 | 160.7 |
| B | 0 | 189 | 139428 | 862.19 | 869 | 850 | 160.7 |
| B | 0 | 214 | 51134 | 312.85 | 869 | 850 | 160.7 |
| C | 3 | 233 | 132268 | 679.69 | 851 | 856 | 193.3 |
| C | 10 | 22 | 48129 | 244.51 | 851 | 856 | 193.3 |
| C | 0 | 207 | 17091 | 83.97 | 851 | 856 | 193.3 |
| D | 1 | 52 | 113633 | 559.34 | 854 | 831 | 201.7 |
| D | 8 | 195 | 67458 | 330.38 | 854 | 831 | 201.7 |
| D | 7 | 80 | 59106 | 288.96 | 854 | 831 | 201.7 |
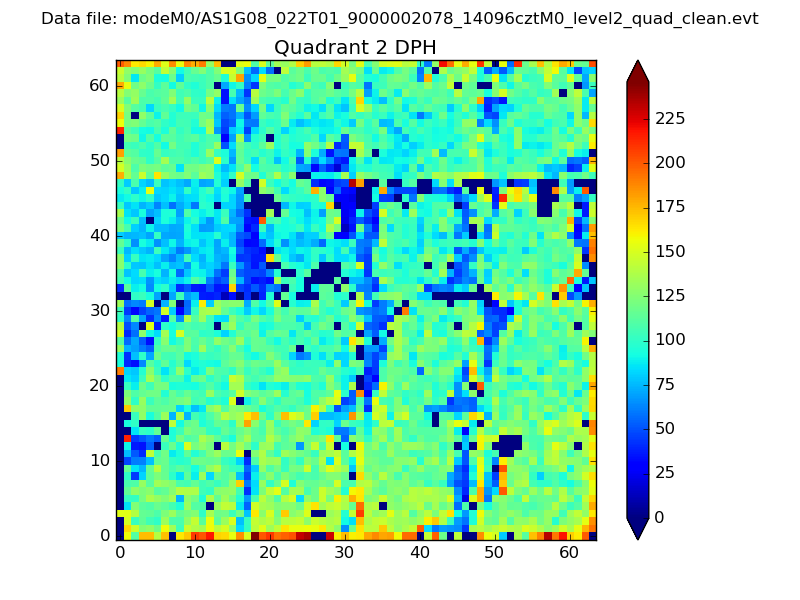
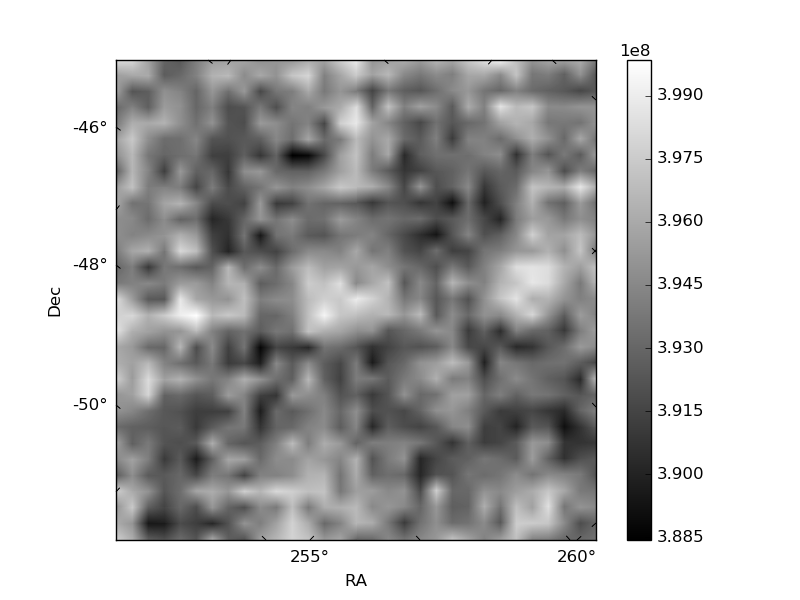
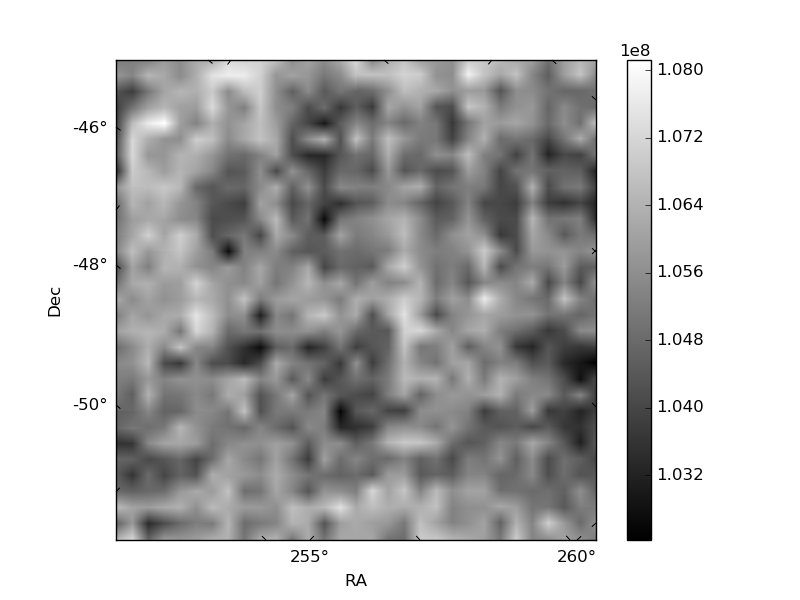
Histogram calculated using DETX and DETY for each event in the final _common_clean file
| Quadrant A | 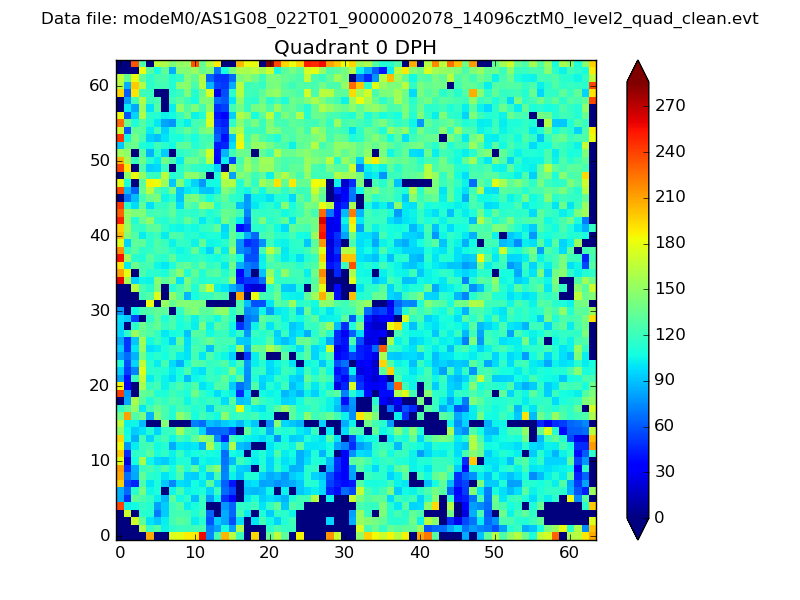 |
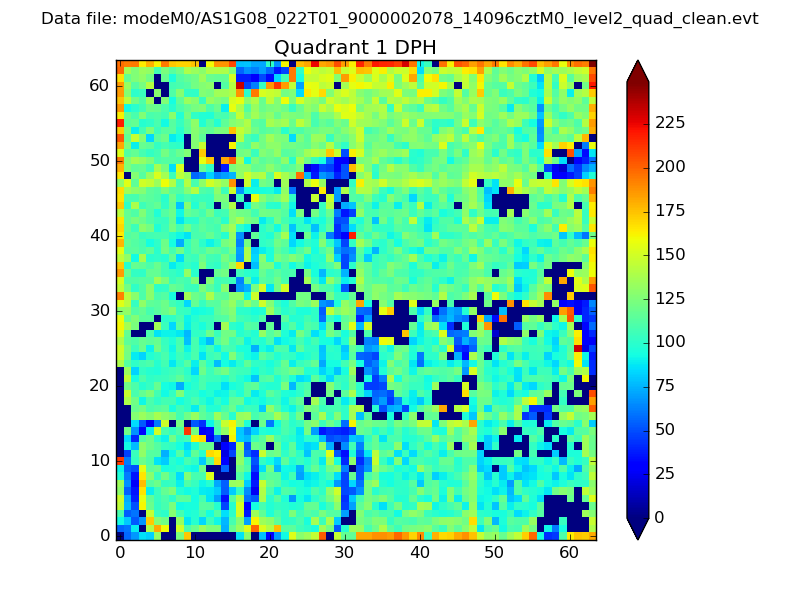 |
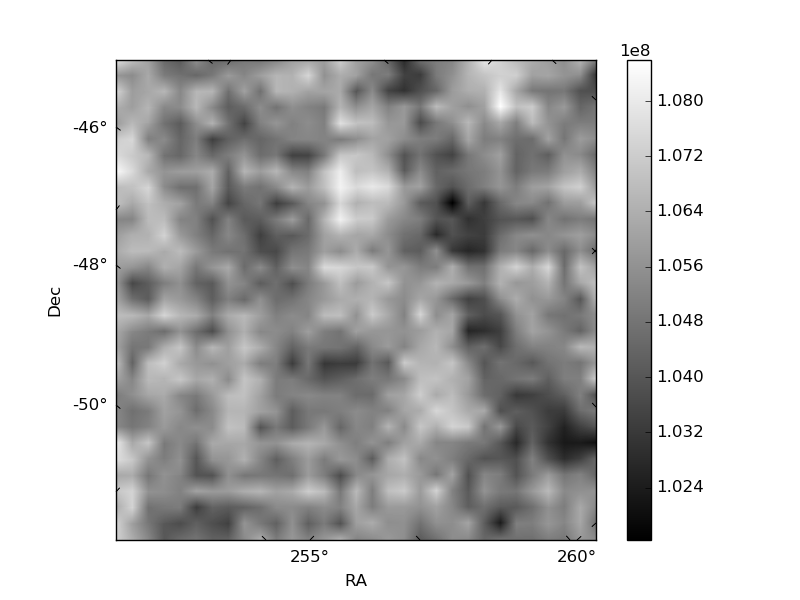
Quadrant B |
|---|---|---|---|
| Quadrant D | 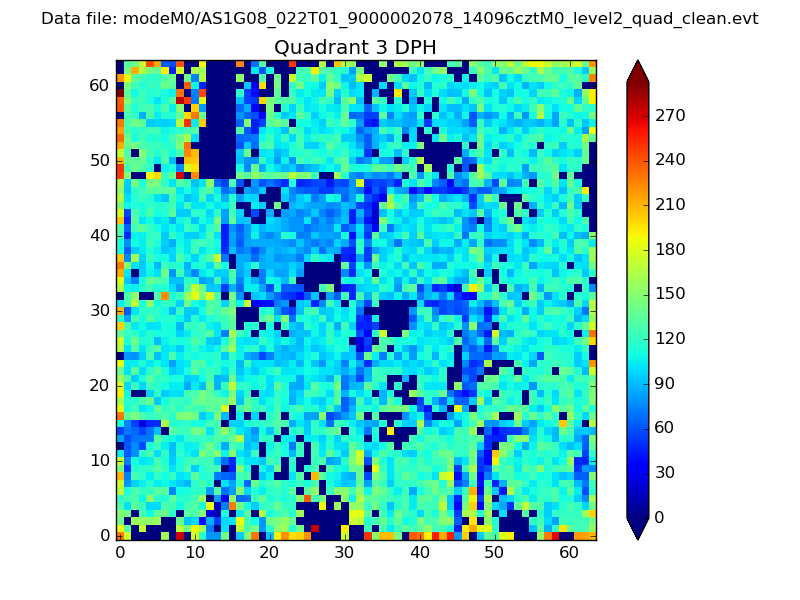 |
 |
Quadrant C |
| Plot type | Count rate plots | Images |
|---|---|---|
| Comparison with Poisson distribution Blue bars denote a histogram of data divided into 1 sec bins. Red curve is a Poisson curve with rate = median count rate of data. |
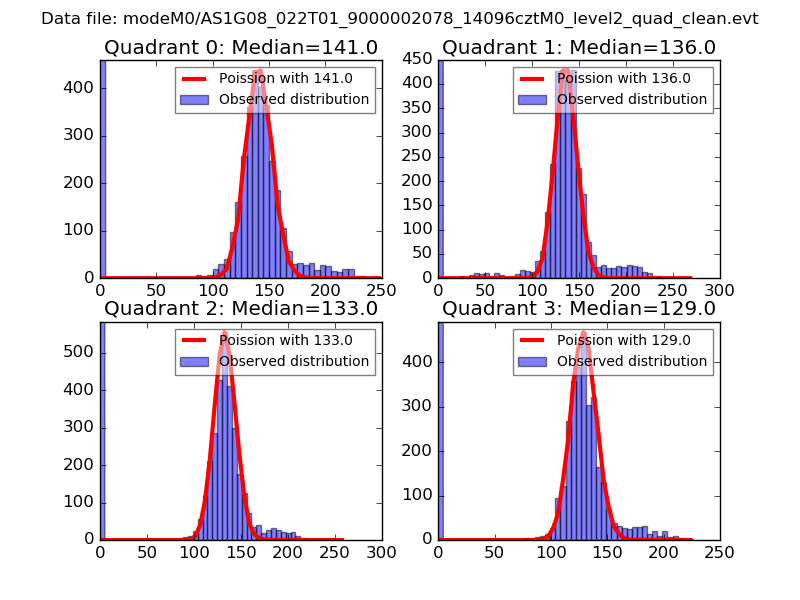 |
 |
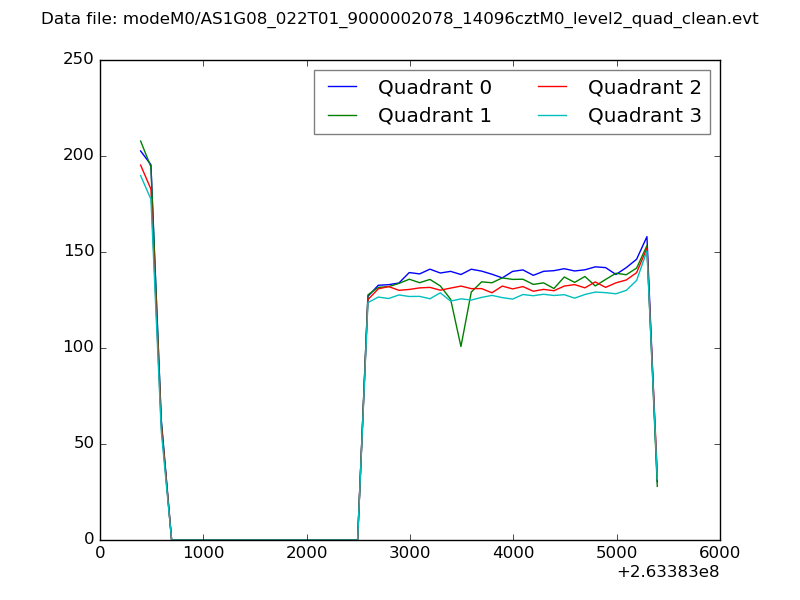
| Quadrant-wise count rates Data is divided into 100 sec bins |
 |
|
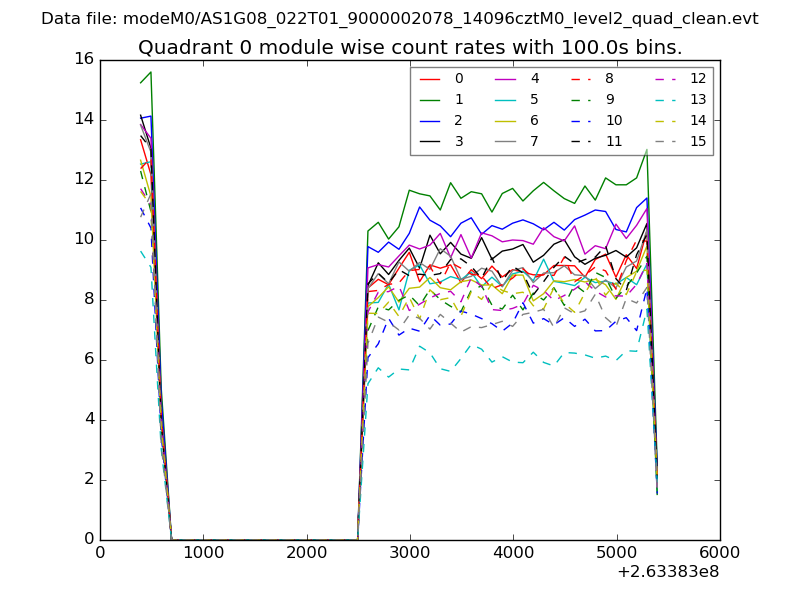
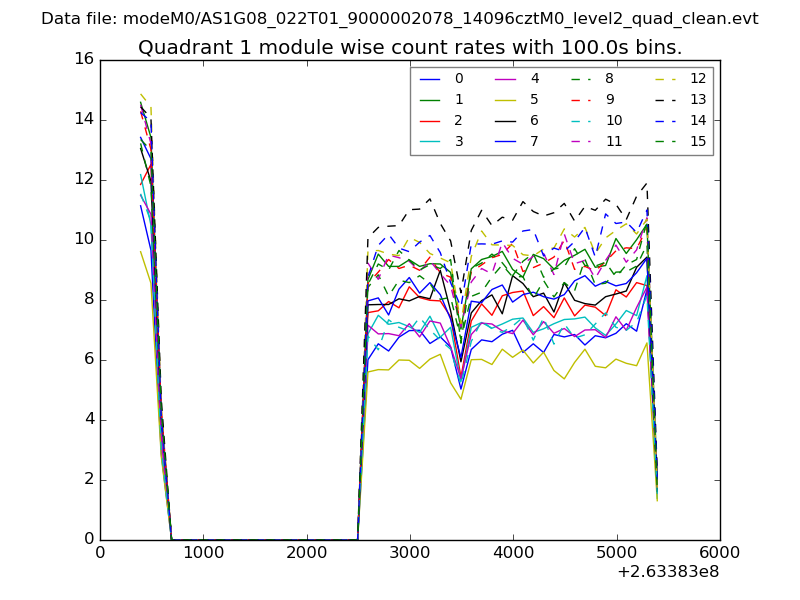
| Module-wise count rates for Quadrant A Data is divided into 100 sec bins |
 |
 |
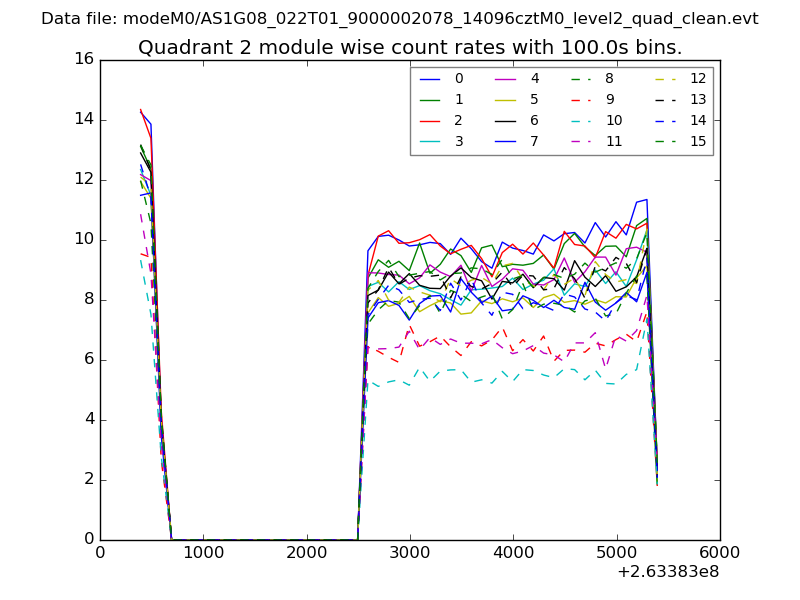
| Module-wise count rates for Quadrant B Data is divided into 100 sec bins |
 |
 |
| Module-wise count rates for Quadrant C Data is divided into 100 sec bins |
 |
 |
| Module-wise count rates for Quadrant D Data is divided into 100 sec bins |
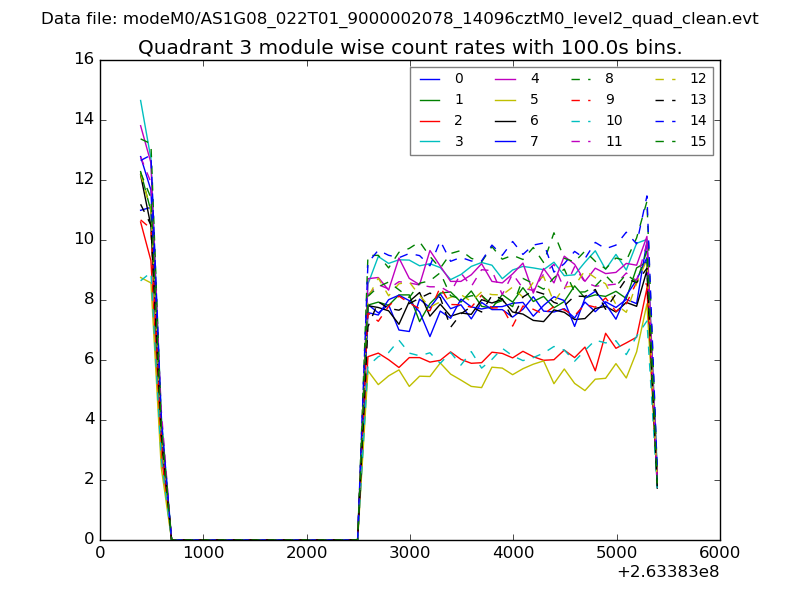 |
 |
| Parameter | Plot |
|---|---|
| CZT HV Monitor | 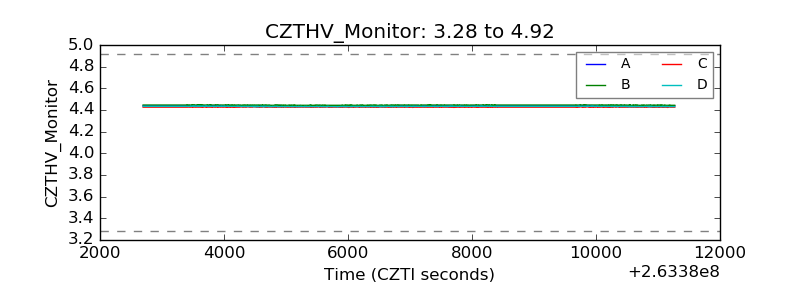 |
| D_VDD | 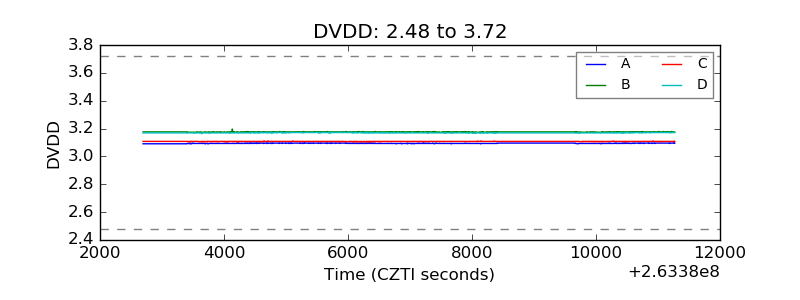 |
| Temperature 1 | 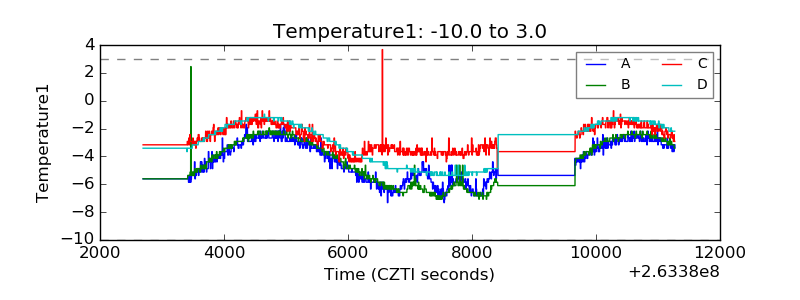 |
| Veto HV Monitor | 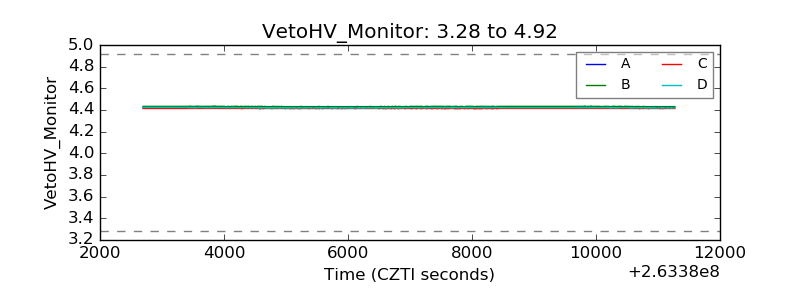 |
| Veto LLD | 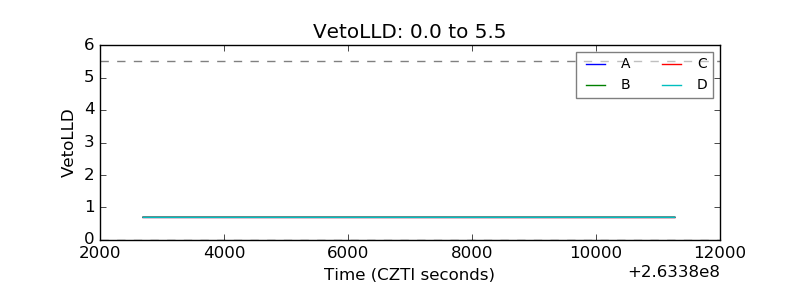 |
| Alpha Counter | 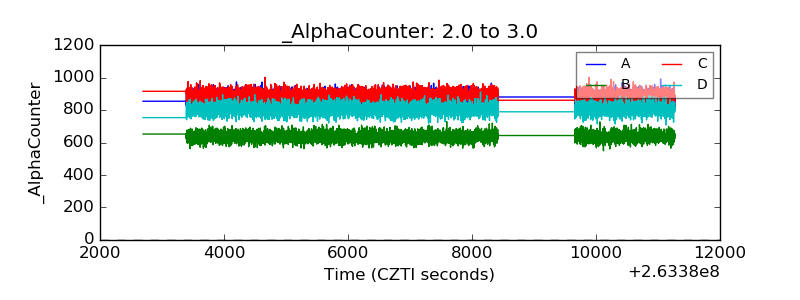 |
| _CPM_Rate | 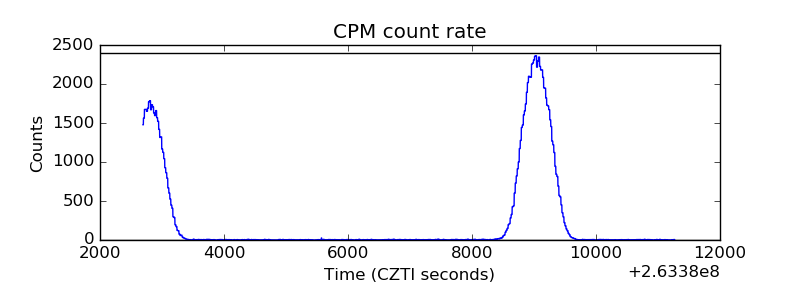 |
| CZT Counter | 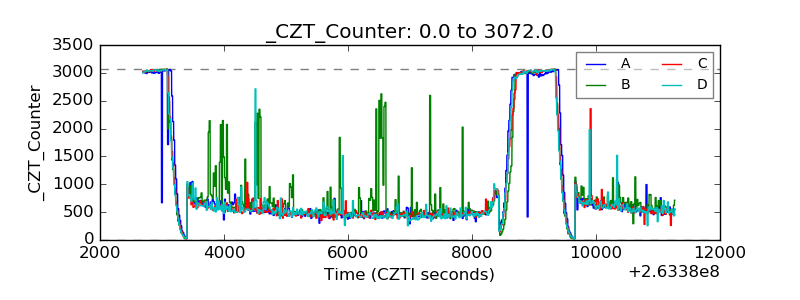 |
| +2.5 Volts monitor |  |
| +5 Volts monitor |  |
| _ROLL_ROT | 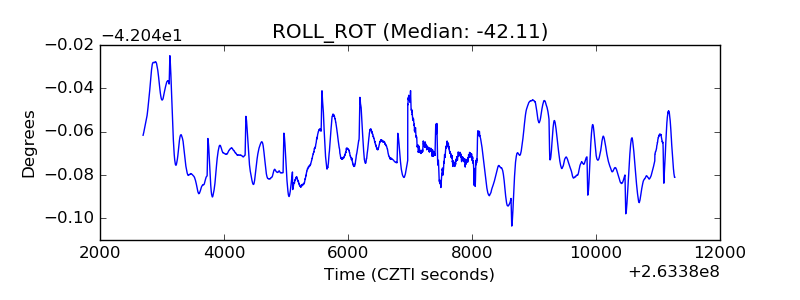 |
| _Roll_DEC |  |
| _Roll_RA | 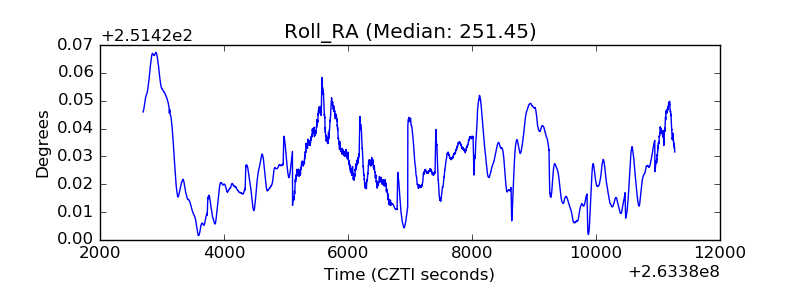 |
| Veto Counter |  |