| Param | Original file | Final file |
|---|---|---|
| Filename | modeM0/AS1G08_022T01_9000002078_14097cztM0_level2.evt | modeM0/AS1G08_022T01_9000002078_14097cztM0_level2_quad_clean.evt |
| Size (bytes) | 513,273,600 | 75,931,200 |
| Size | 489.5 MB | 72.4 MB |
| Events in quadrant A | 3,519,023 | 482,729 |
| Events in quadrant B | 4,427,309 | 467,931 |
| Events in quadrant C | 3,511,410 | 456,626 |
| Events in quadrant D | 3,647,719 | 440,313 |
| Mode SS | |||
|---|---|---|---|
| Quadrant | BADHDUFLAG | Total packets | Discarded packets |
| A | 0 | 132 | 0 |
| B | 0 | 132 | 0 |
| C | 0 | 132 | 0 |
| D | 0 | 132 | 0 |
| Mode M9 | |||
|---|---|---|---|
| Quadrant | BADHDUFLAG | Total packets | Discarded packets |
| A | 0 | 22 | 0 |
| B | 0 | 22 | 0 |
| C | 0 | 22 | 0 |
| D | 0 | 23 | 0 |
| Mode M0 | |||
|---|---|---|---|
| Quadrant | BADHDUFLAG | Total packets | Discarded packets |
| A | 0 | 14576 | 3 |
| B | 0 | 17633 | 2 |
| C | 0 | 14484 | 2 |
| D | 0 | 14862 | 2 |
| Quadrant | Total seconds | Saturated seconds | Saturation percentage |
|---|---|---|---|
| A | 6471 | 118 | 1.823520% |
| B | 6471 | 245 | 3.786123% |
| C | 6471 | 75 | 1.159017% |
| D | 6471 | 117 | 1.808067% |
Noise dominated data is calculated using 1-second bins in cleaned event files. If a bin has >2000 counts, and if more than 50% of those come from <1% of pixels, then it is considered to be noise-dominated and hence unusable.
| Quadrant | # 1 sec bins | Bins with >0 counts | Bins with >2000 counts | High rate bins dominated by noise | Noise dominated (total time) | Noise dominated (detector-on time) | Marked lightcurve |
|---|---|---|---|---|---|---|---|
| A | 7777 | 6473 | 5 | 5 | 0.06% | 0.08% | 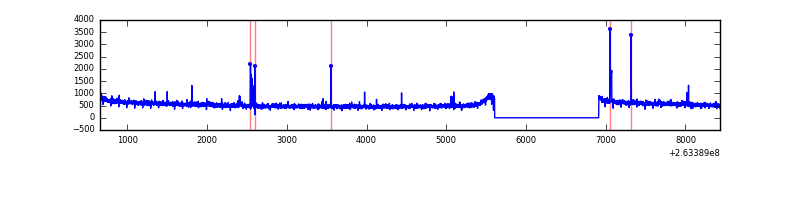 |
| B | 7777 | 6473 | 73 | 73 | 0.94% | 1.13% | 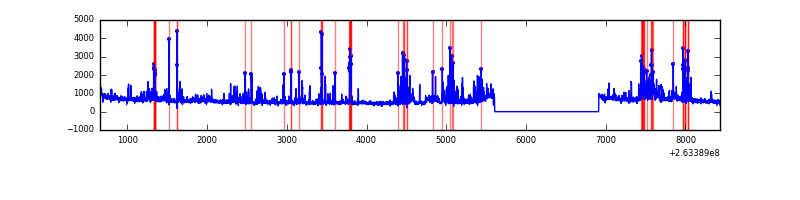 |
| C | 7777 | 6473 | 1 | 1 | 0.01% | 0.02% | 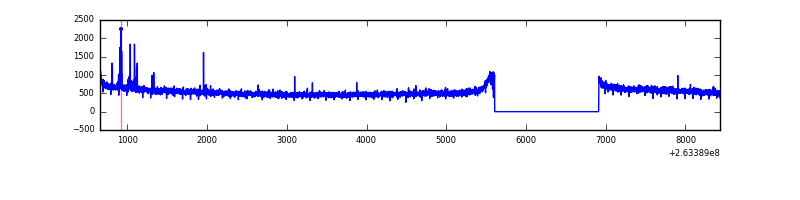 |
| D | 7777 | 6473 | 23 | 23 | 0.30% | 0.36% | 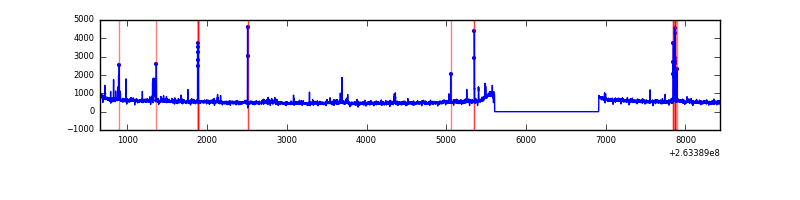 |
Top three noisy pixels from each quadrant. If the there are fewer than three noisy pixels in the level2.evt file, extra rows are filled as -1
| Pixel properties | Quadrant properties | ||||||
|---|---|---|---|---|---|---|---|
| Quadrant | DetID | PixID | Counts | Sigma | Mean | Median | Sigma |
| A | 15 | 222 | 58595 | 326.32 | 890 | 874 | 176.9 |
| A | 12 | 189 | 21321 | 115.6 | 890 | 874 | 176.9 |
| A | 9 | 143 | 16180 | 86.53 | 890 | 874 | 176.9 |
| B | 10 | 16 | 782754 | 4858.31 | 875 | 857 | 160.9 |
| B | 0 | 189 | 85651 | 526.87 | 875 | 857 | 160.9 |
| B | 0 | 219 | 38243 | 232.3 | 875 | 857 | 160.9 |
| C | 3 | 233 | 186694 | 968.1 | 845 | 850 | 192.0 |
| C | 10 | 22 | 28423 | 143.63 | 845 | 850 | 192.0 |
| C | 13 | 61 | 6142 | 27.57 | 845 | 850 | 192.0 |
| D | 8 | 195 | 121226 | 601.2 | 843 | 820 | 200.3 |
| D | 1 | 52 | 107394 | 532.14 | 843 | 820 | 200.3 |
| D | 10 | 157 | 82681 | 408.74 | 843 | 820 | 200.3 |
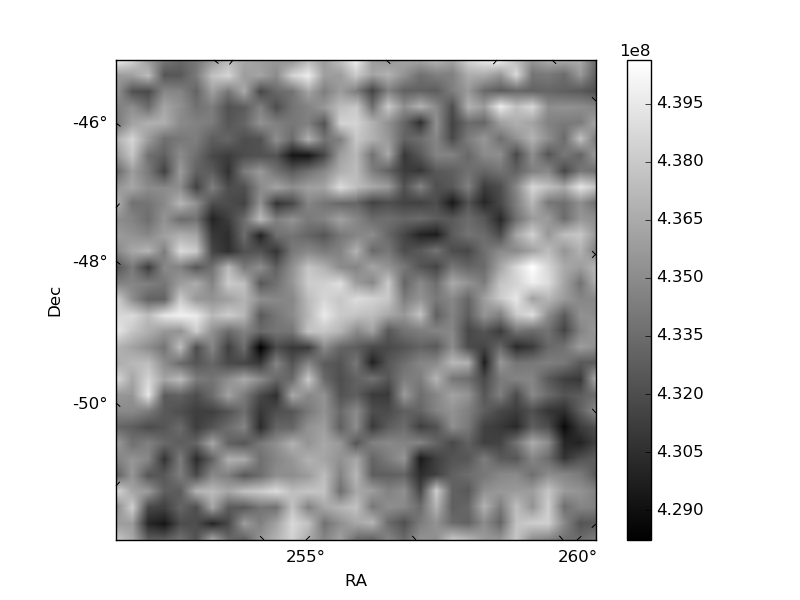
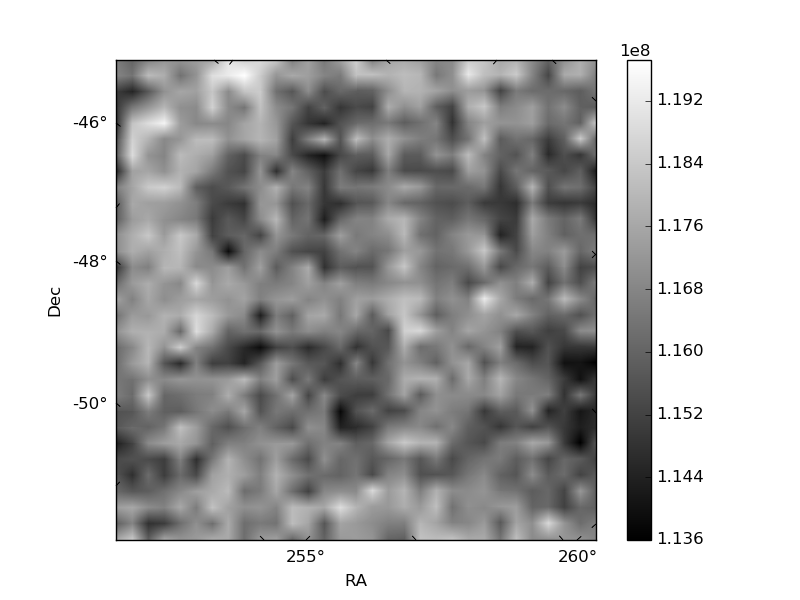
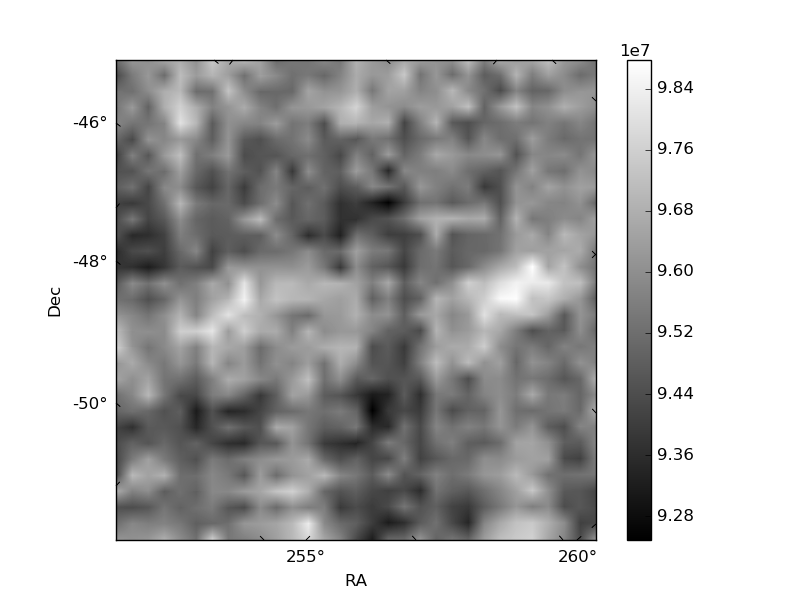
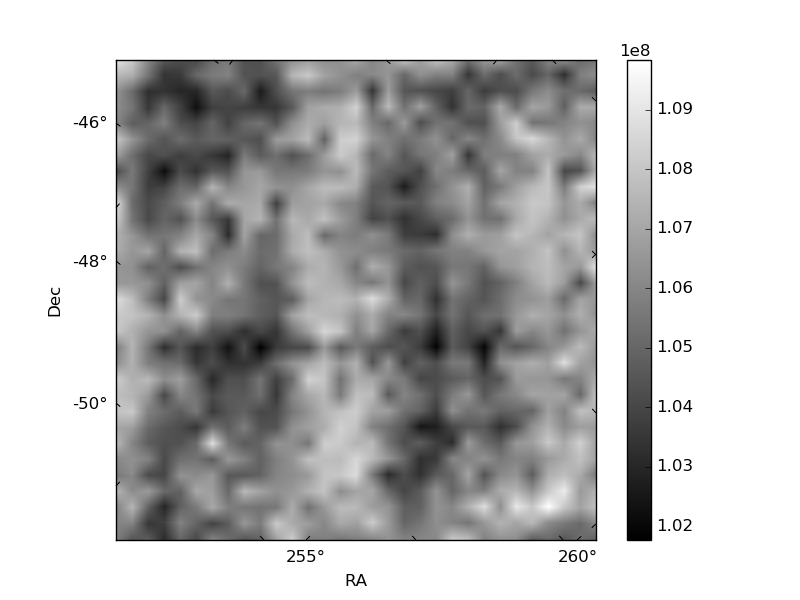
Histogram calculated using DETX and DETY for each event in the final _common_clean file
| Quadrant A | 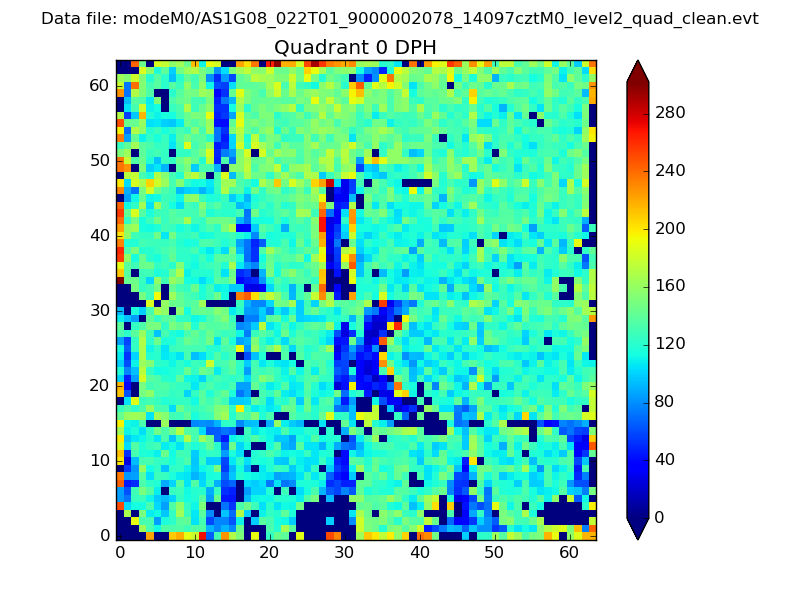 |
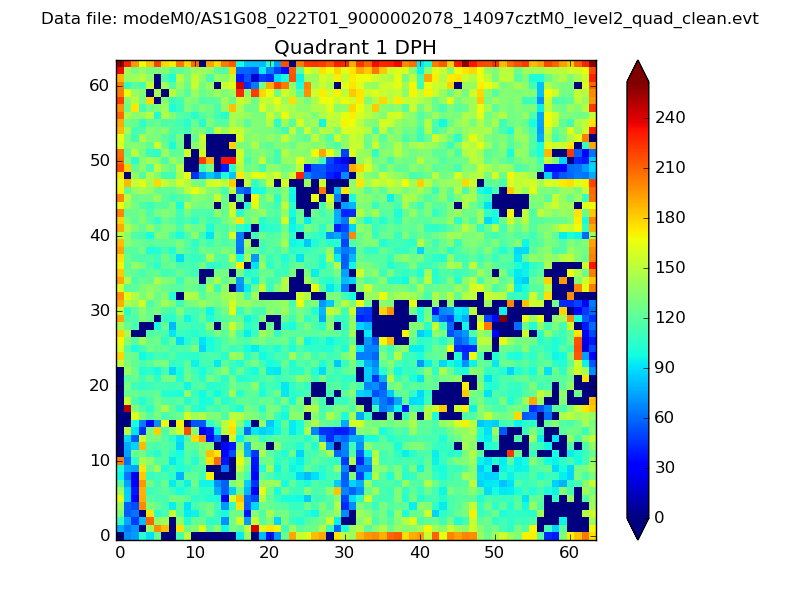 |
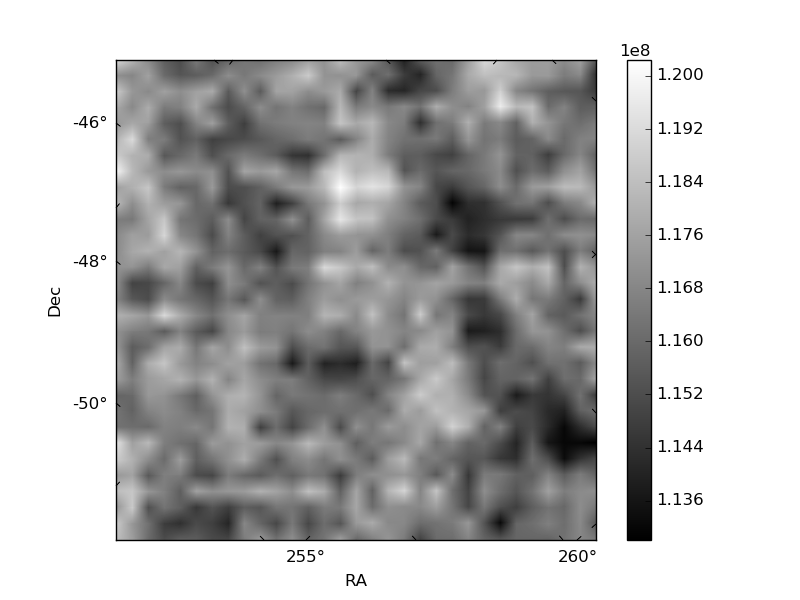
Quadrant B |
|---|---|---|---|
| Quadrant D | 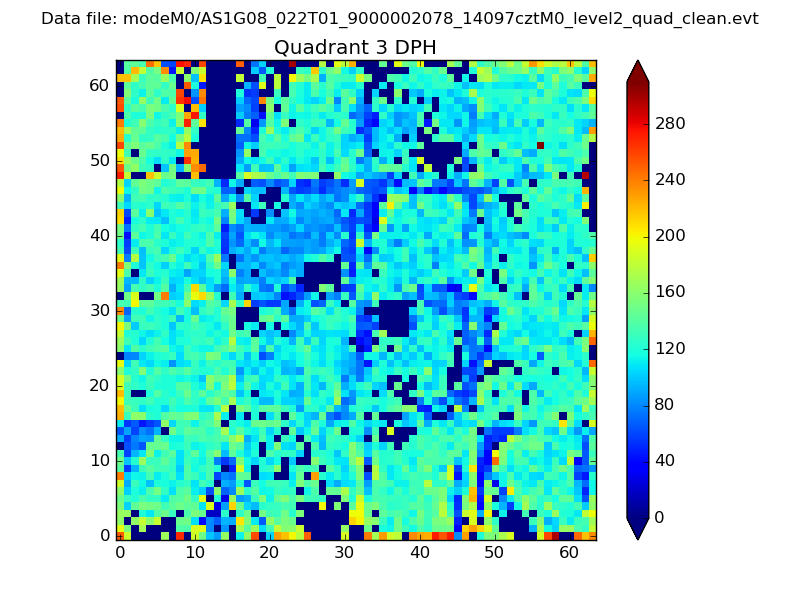 |
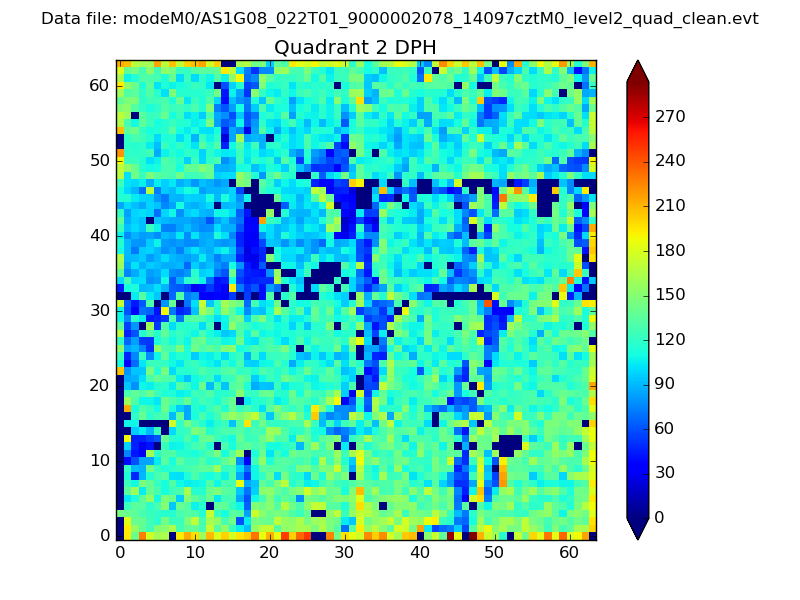 |
Quadrant C |
| Plot type | Count rate plots | Images |
|---|---|---|
| Comparison with Poisson distribution Blue bars denote a histogram of data divided into 1 sec bins. Red curve is a Poisson curve with rate = median count rate of data. |
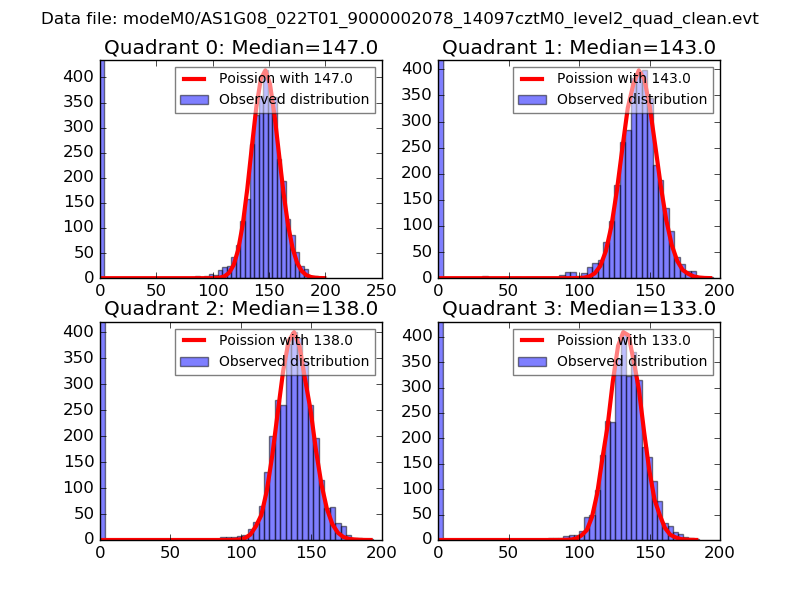 |
 |
| Quadrant-wise count rates Data is divided into 100 sec bins |
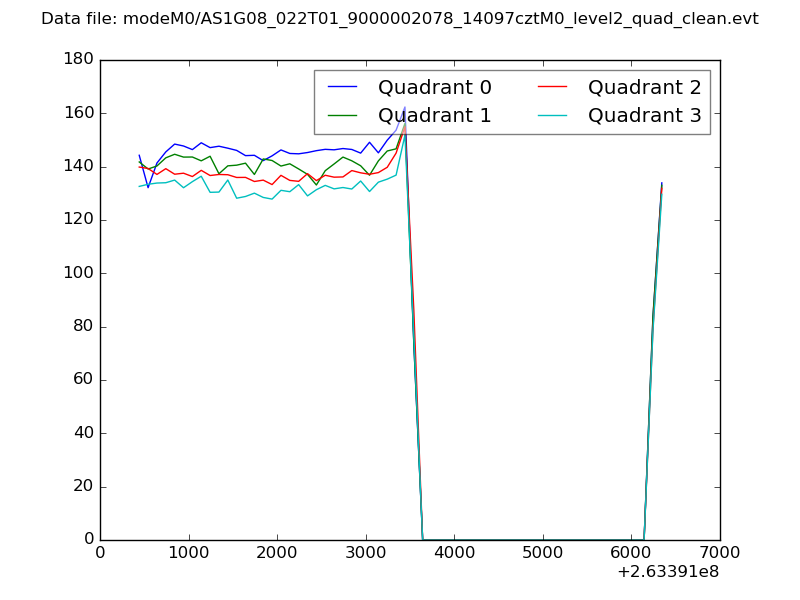 |
|
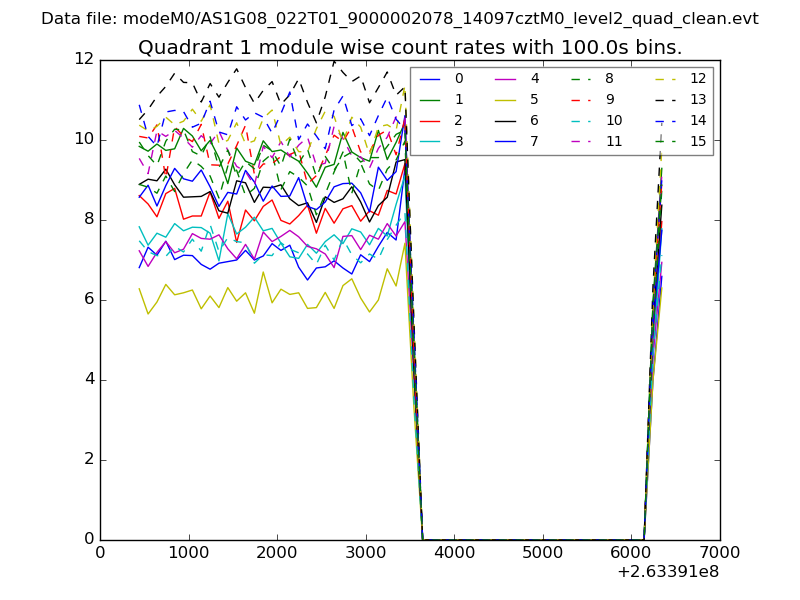
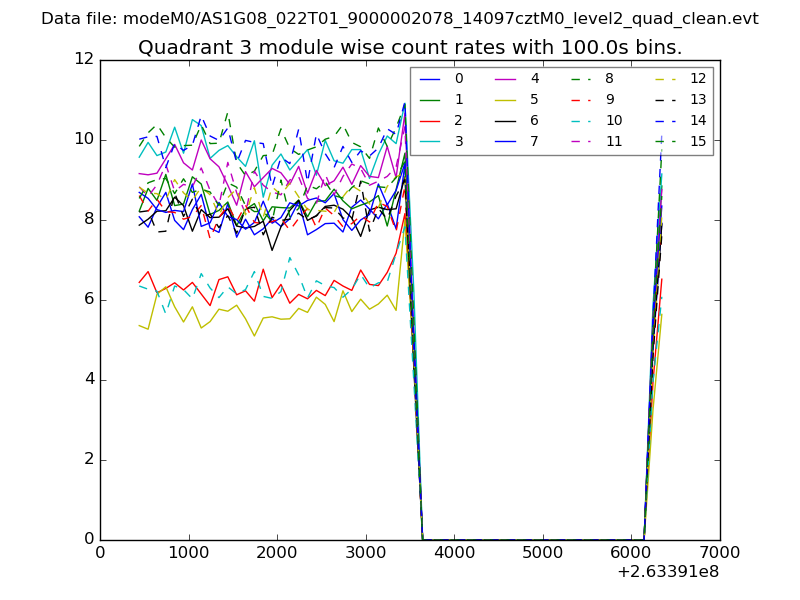
| Module-wise count rates for Quadrant A Data is divided into 100 sec bins |
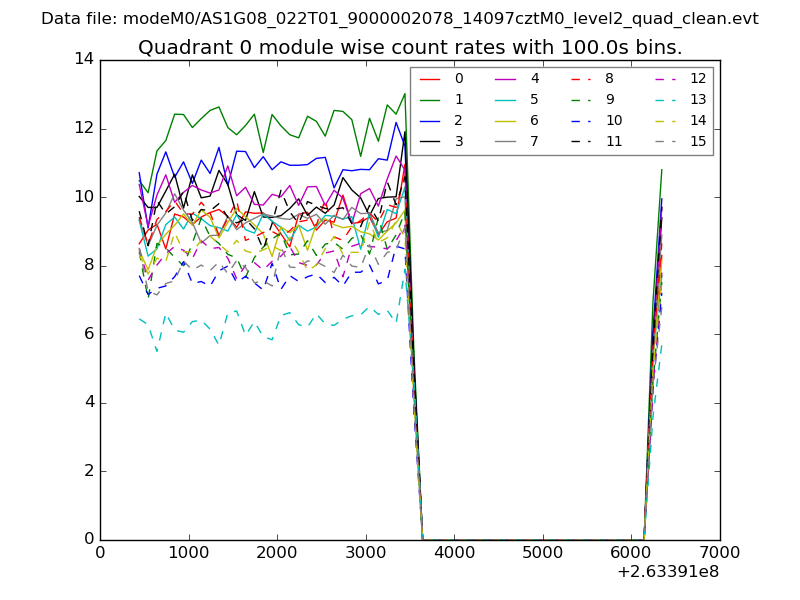 |
 |
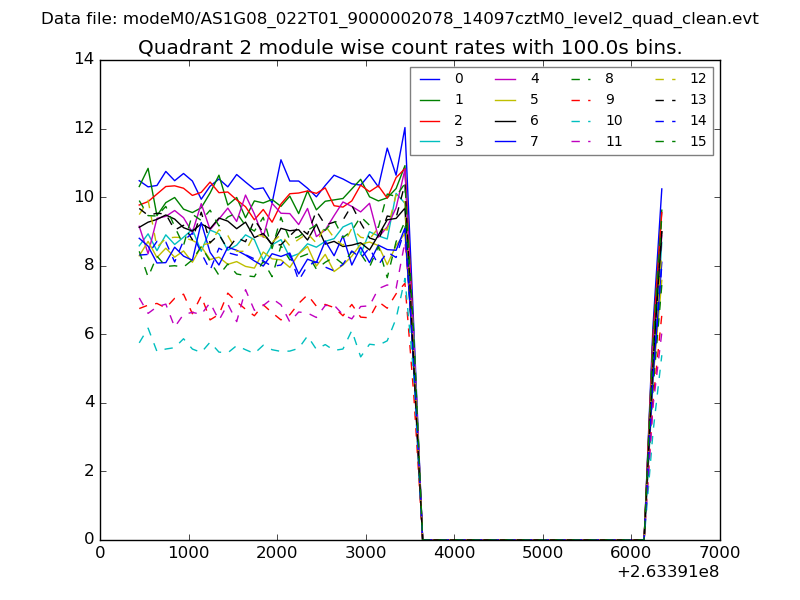
| Module-wise count rates for Quadrant B Data is divided into 100 sec bins |
 |
 |
| Module-wise count rates for Quadrant C Data is divided into 100 sec bins |
 |
 |
| Module-wise count rates for Quadrant D Data is divided into 100 sec bins |
 |
 |
| Parameter | Plot |
|---|---|
| CZT HV Monitor | 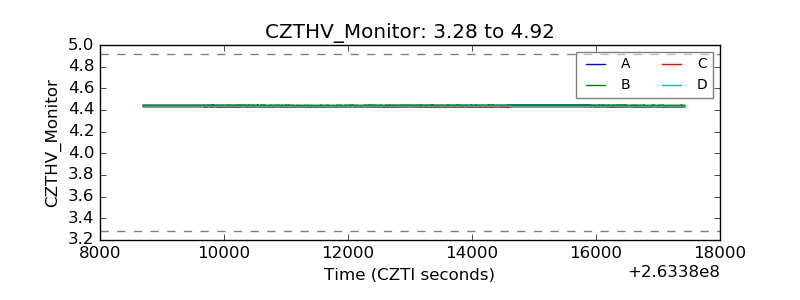 |
| D_VDD | 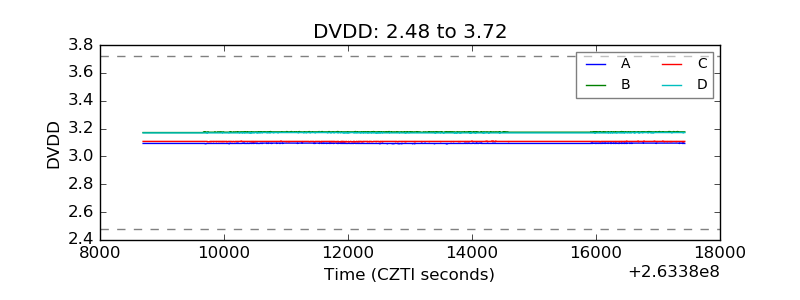 |
| Temperature 1 | 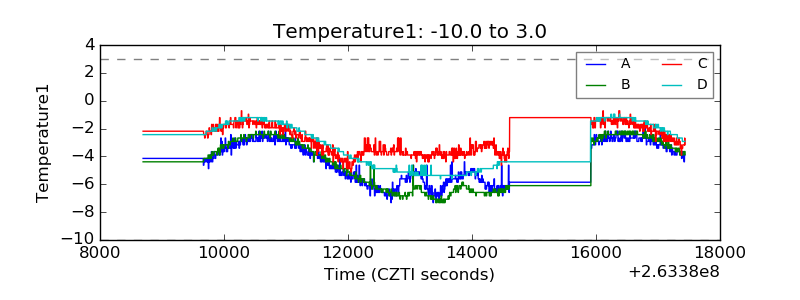 |
| Veto HV Monitor | 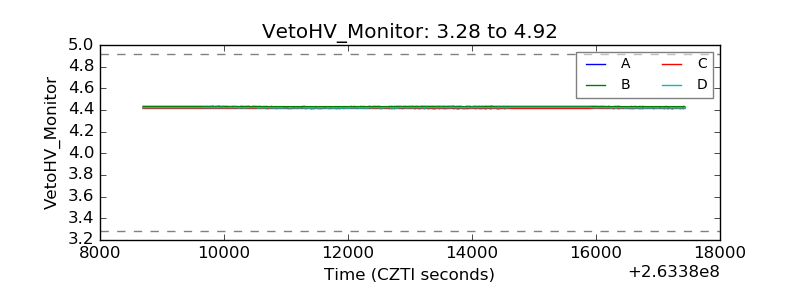 |
| Veto LLD | 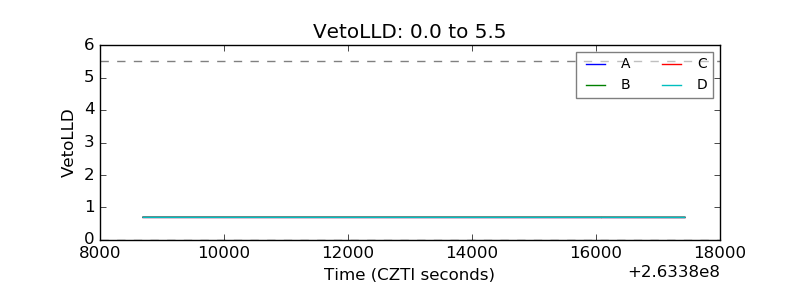 |
| Alpha Counter | 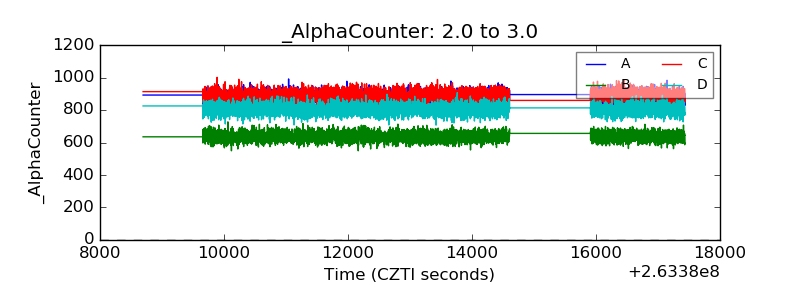 |
| _CPM_Rate | 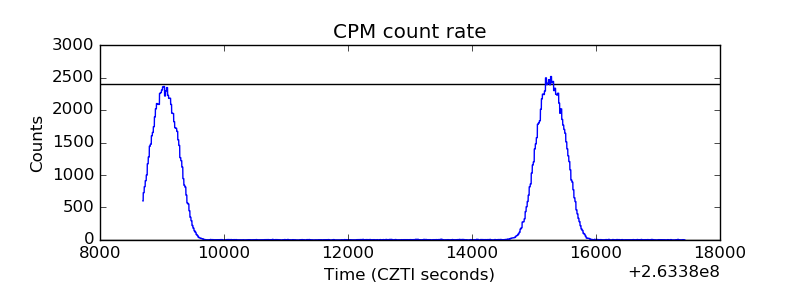 |
| CZT Counter | 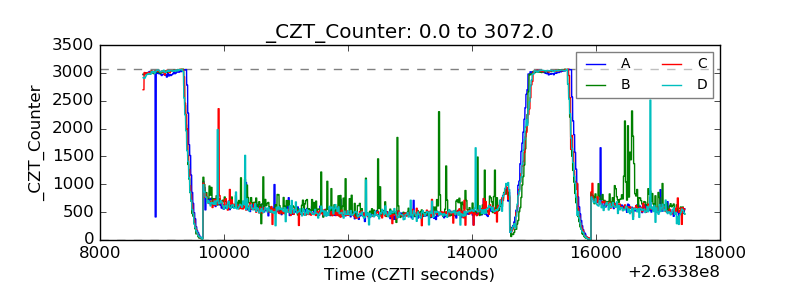 |
| +2.5 Volts monitor |  |
| +5 Volts monitor |  |
| _ROLL_ROT | 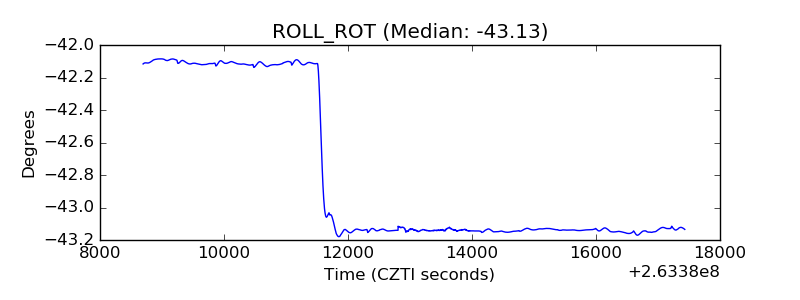 |
| _Roll_DEC | 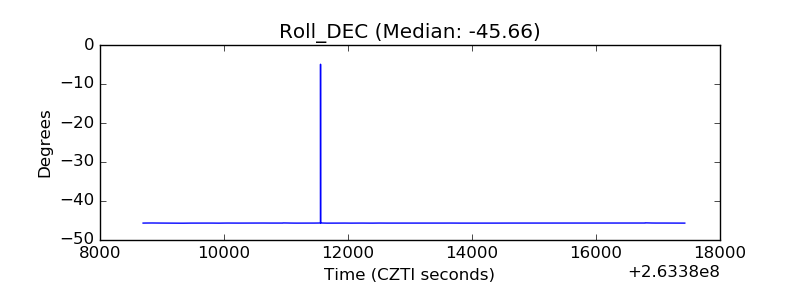 |
| _Roll_RA | 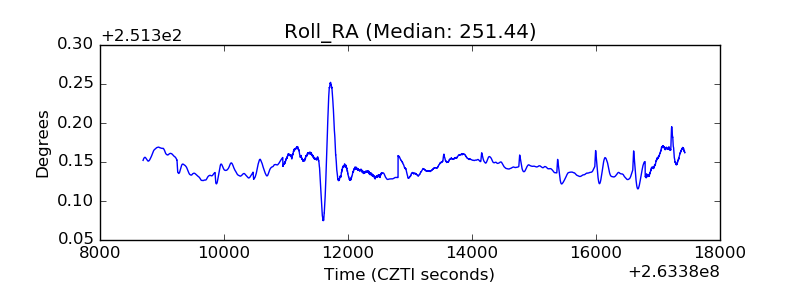 |
| Veto Counter | 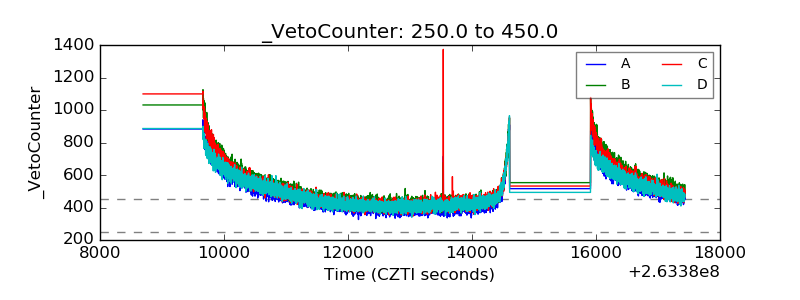 |