| Param | Original file | Final file |
|---|---|---|
| Filename | modeM0/AS1G08_022T01_9000002078_14099cztM0_level2.evt | modeM0/AS1G08_022T01_9000002078_14099cztM0_level2_quad_clean.evt |
| Size (bytes) | 475,902,720 | 96,793,920 |
| Size | 453.9 MB | 92.3 MB |
| Events in quadrant A | 3,055,679 | 663,661 |
| Events in quadrant B | 4,642,266 | 632,762 |
| Events in quadrant C | 2,958,454 | 626,791 |
| Events in quadrant D | 3,353,435 | 593,442 |
| Mode SS | |||
|---|---|---|---|
| Quadrant | BADHDUFLAG | Total packets | Discarded packets |
| A | 0 | 120 | 0 |
| B | 0 | 120 | 0 |
| C | 0 | 120 | 0 |
| D | 0 | 120 | 0 |
| Mode M9 | |||
|---|---|---|---|
| Quadrant | BADHDUFLAG | Total packets | Discarded packets |
| A | 0 | 13 | 0 |
| B | 0 | 13 | 0 |
| C | 0 | 13 | 0 |
| D | 0 | 13 | 0 |
| Mode M0 | |||
|---|---|---|---|
| Quadrant | BADHDUFLAG | Total packets | Discarded packets |
| A | 0 | 12707 | 2 |
| B | 0 | 17686 | 1 |
| C | 0 | 12407 | 1 |
| D | 0 | 13796 | 1 |
| Quadrant | Total seconds | Saturated seconds | Saturation percentage |
|---|---|---|---|
| A | 5936 | 64 | 1.078167% |
| B | 5936 | 493 | 8.305256% |
| C | 5936 | 31 | 0.522237% |
| D | 5936 | 227 | 3.824124% |
Noise dominated data is calculated using 1-second bins in cleaned event files. If a bin has >2000 counts, and if more than 50% of those come from <1% of pixels, then it is considered to be noise-dominated and hence unusable.
| Quadrant | # 1 sec bins | Bins with >0 counts | Bins with >2000 counts | High rate bins dominated by noise | Noise dominated (total time) | Noise dominated (detector-on time) | Marked lightcurve |
|---|---|---|---|---|---|---|---|
| A | 7212 | 5938 | 1 | 1 | 0.01% | 0.02% | 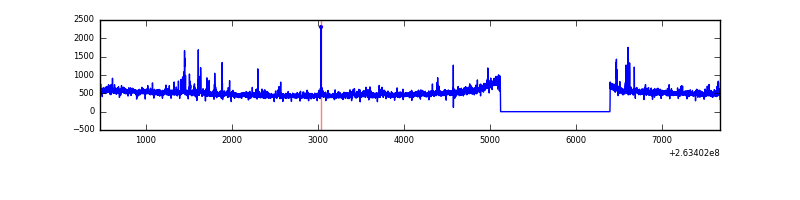 |
| B | 7212 | 5938 | 259 | 259 | 3.59% | 4.36% | 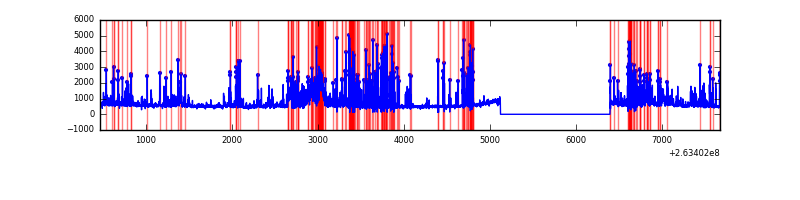 |
| C | 7212 | 5938 | 1 | 1 | 0.01% | 0.02% | 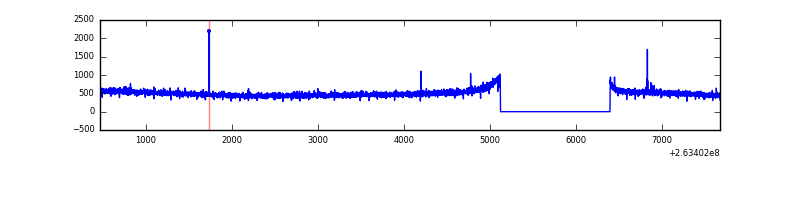 |
| D | 7212 | 5938 | 171 | 171 | 2.37% | 2.88% | 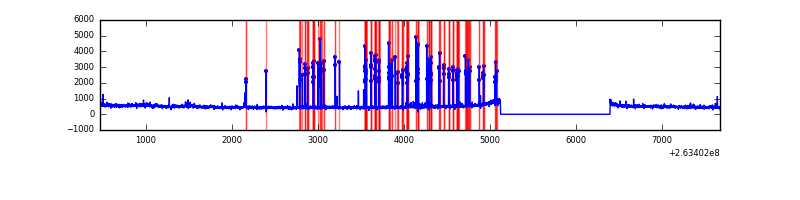 |
Top three noisy pixels from each quadrant. If the there are fewer than three noisy pixels in the level2.evt file, extra rows are filled as -1
| Pixel properties | Quadrant properties | ||||||
|---|---|---|---|---|---|---|---|
| Quadrant | DetID | PixID | Counts | Sigma | Mean | Median | Sigma |
| A | 9 | 143 | 70292 | 452.61 | 764 | 750 | 153.6 |
| A | 12 | 189 | 34737 | 221.2 | 764 | 750 | 153.6 |
| A | 8 | 15 | 14580 | 90.01 | 764 | 750 | 153.6 |
| B | 10 | 16 | 1578984 | 11351.94 | 739 | 723 | 139.0 |
| B | 0 | 189 | 60759 | 431.82 | 739 | 723 | 139.0 |
| B | 0 | 229 | 30254 | 212.41 | 739 | 723 | 139.0 |
| C | 3 | 233 | 115746 | 690.98 | 727 | 732 | 166.5 |
| C | 0 | 207 | 6793 | 36.41 | 727 | 732 | 166.5 |
| C | 13 | 61 | 5316 | 27.54 | 727 | 732 | 166.5 |
| D | 10 | 157 | 505640 | 2684.96 | 708 | 694 | 188.1 |
| D | 8 | 195 | 88424 | 466.49 | 708 | 694 | 188.1 |
| D | 1 | 52 | 43663 | 228.48 | 708 | 694 | 188.1 |
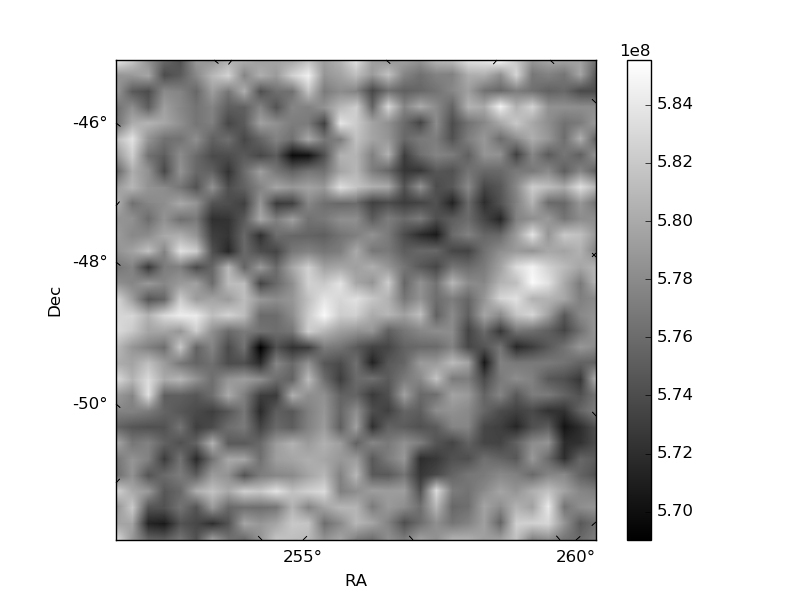
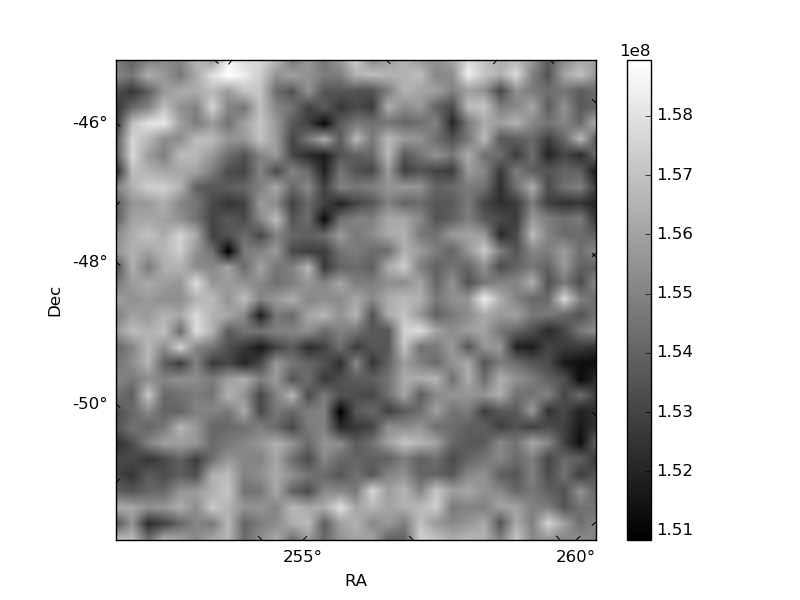
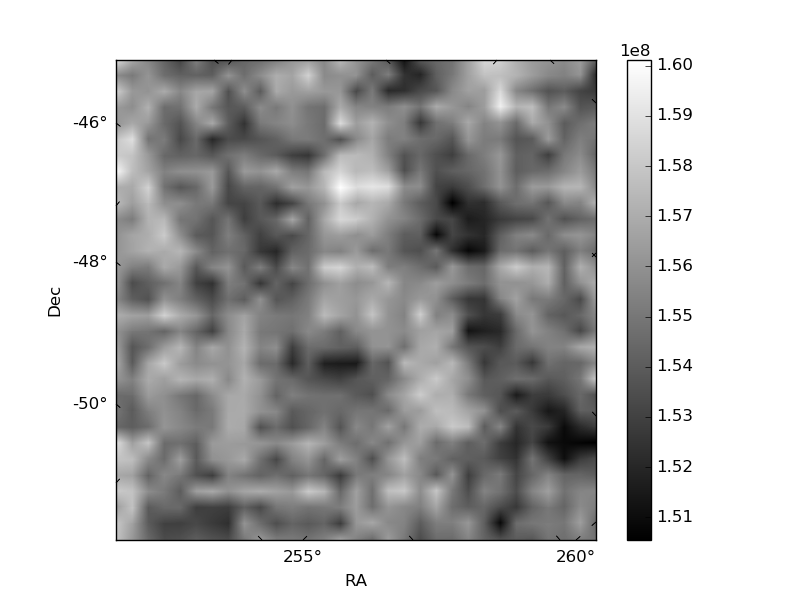
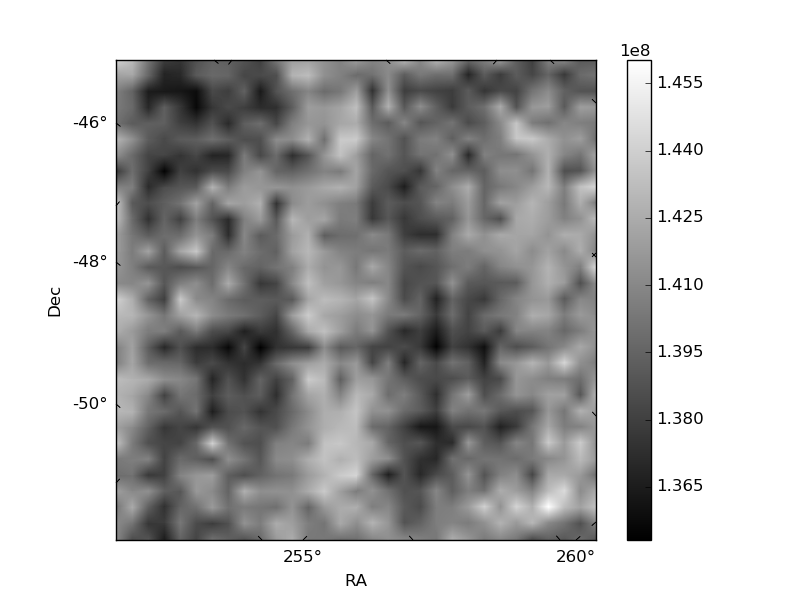
Histogram calculated using DETX and DETY for each event in the final _common_clean file
| Quadrant A | 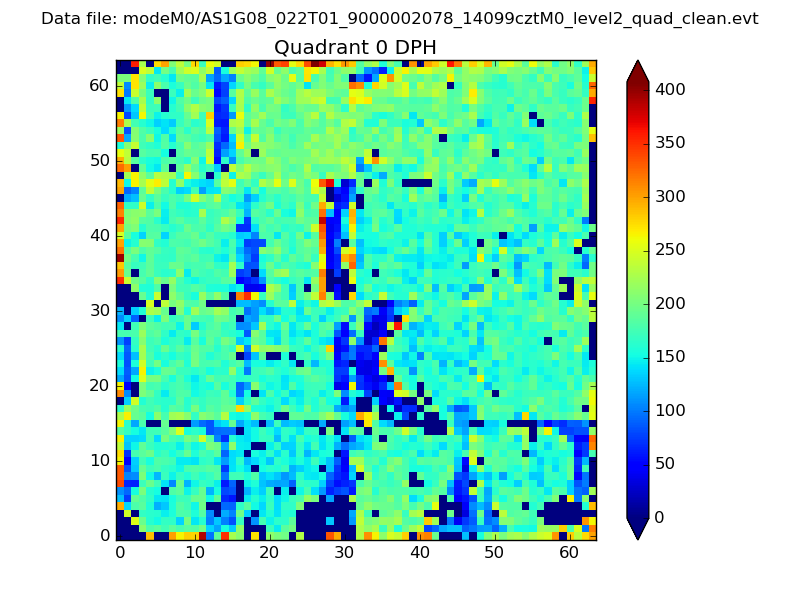 |
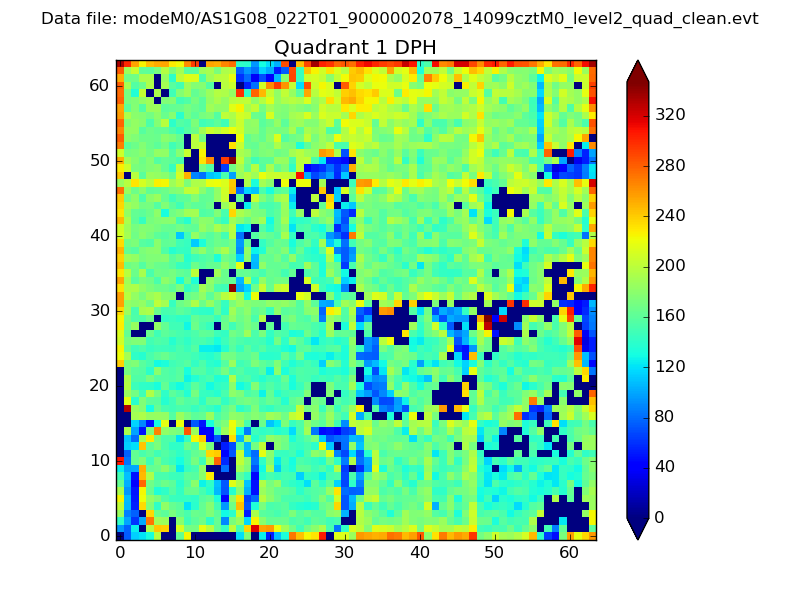 |
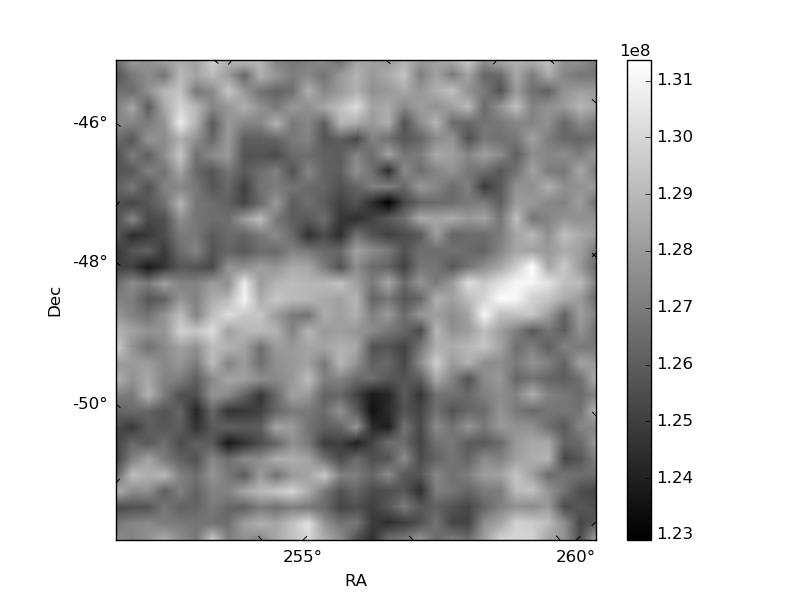
Quadrant B |
|---|---|---|---|
| Quadrant D | 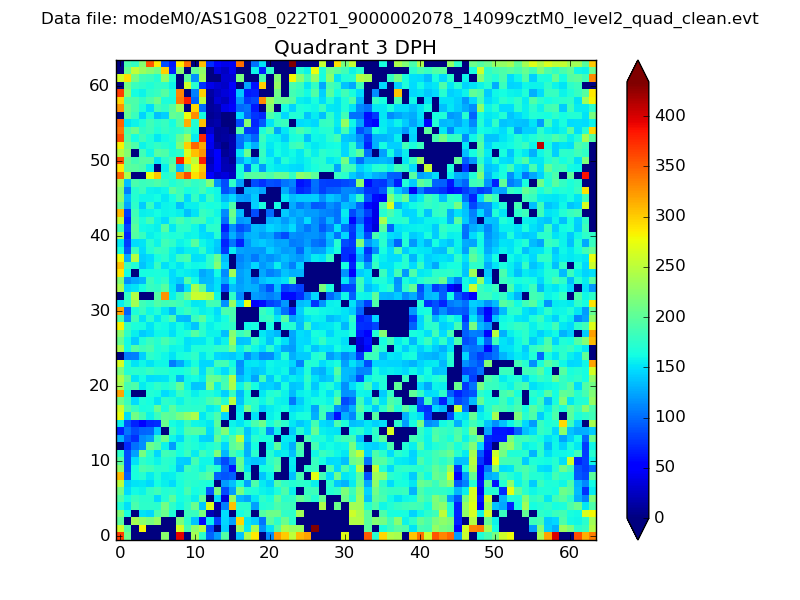 |
 |
Quadrant C |
| Plot type | Count rate plots | Images |
|---|---|---|
| Comparison with Poisson distribution Blue bars denote a histogram of data divided into 1 sec bins. Red curve is a Poisson curve with rate = median count rate of data. |
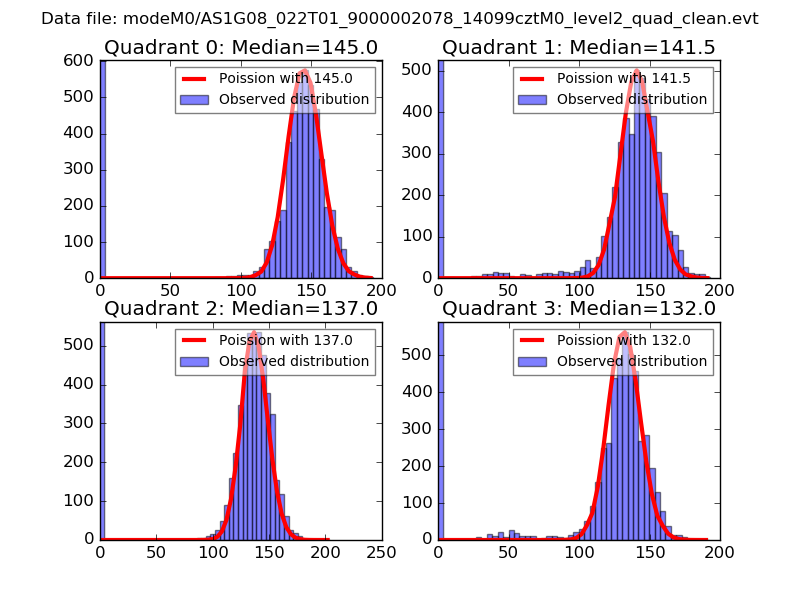 |
 |
| Quadrant-wise count rates Data is divided into 100 sec bins |
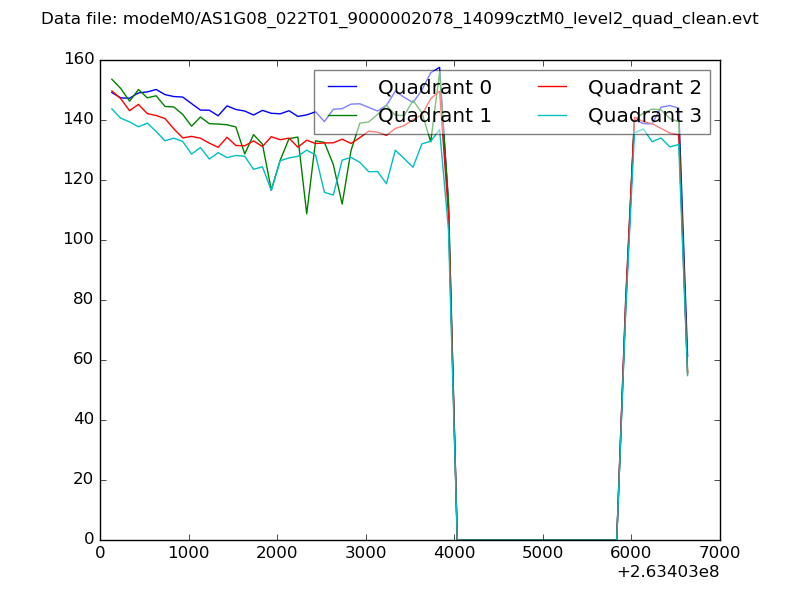 |
|
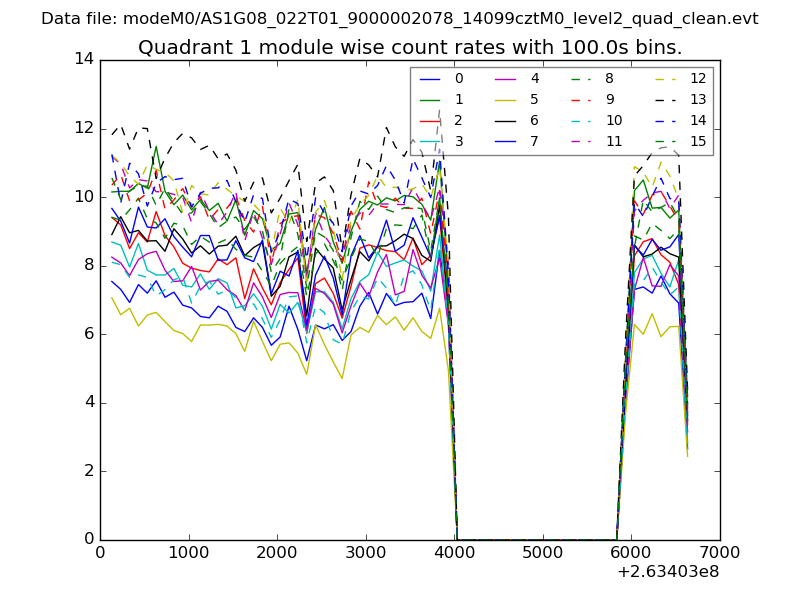
| Module-wise count rates for Quadrant A Data is divided into 100 sec bins |
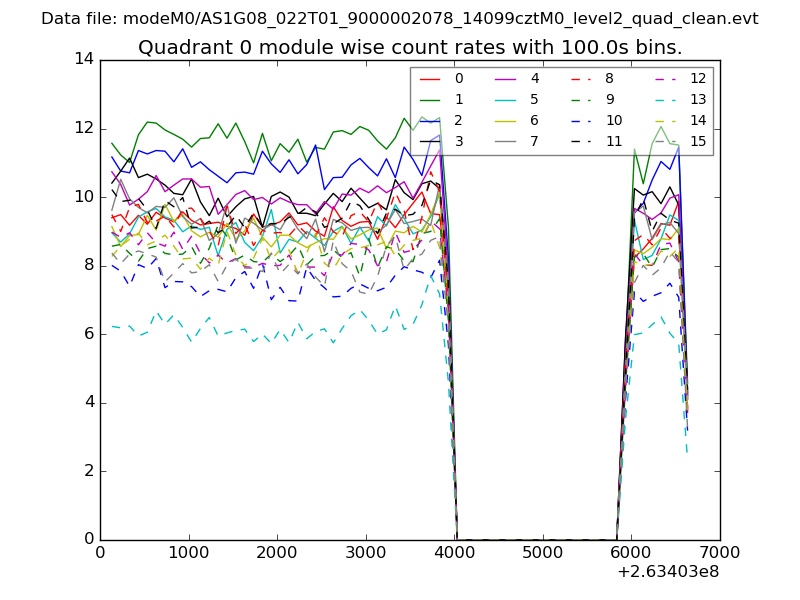 |
 |
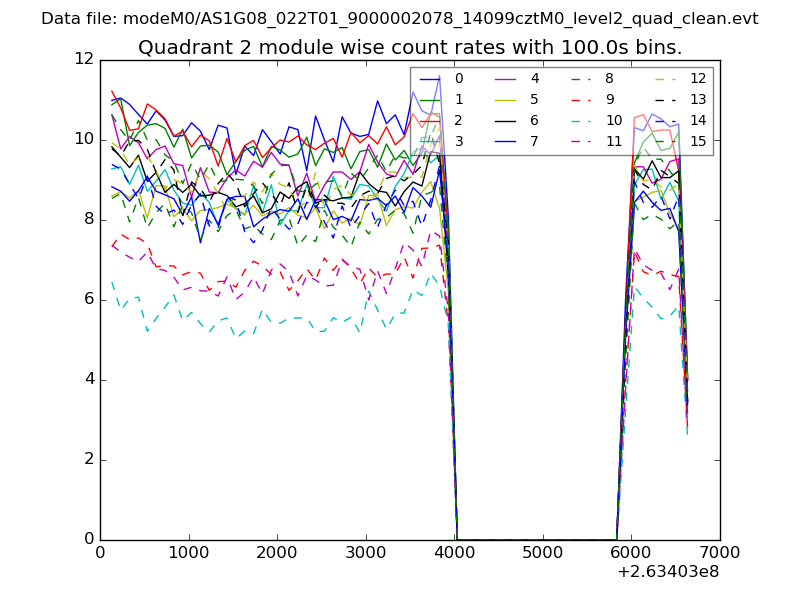
| Module-wise count rates for Quadrant B Data is divided into 100 sec bins |
 |
 |
| Module-wise count rates for Quadrant C Data is divided into 100 sec bins |
 |
 |
| Module-wise count rates for Quadrant D Data is divided into 100 sec bins |
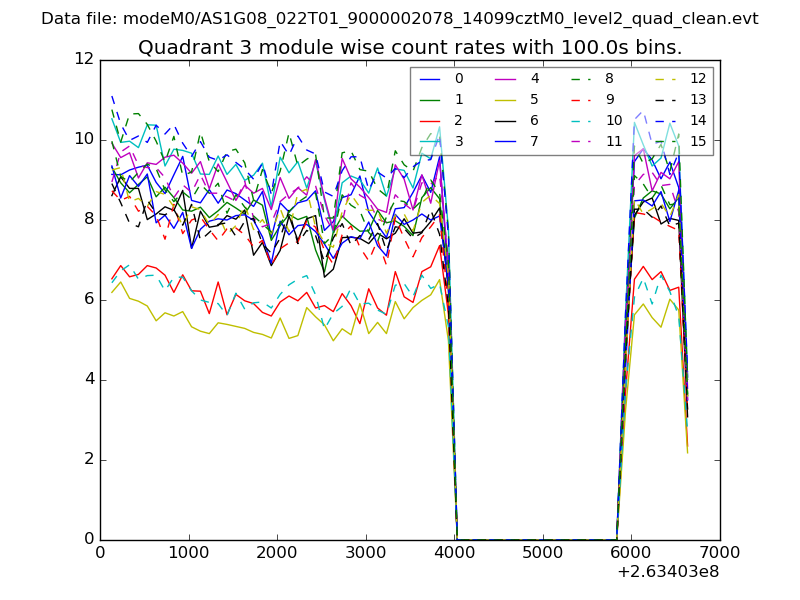 |
 |
| Parameter | Plot |
|---|---|
| CZT HV Monitor | 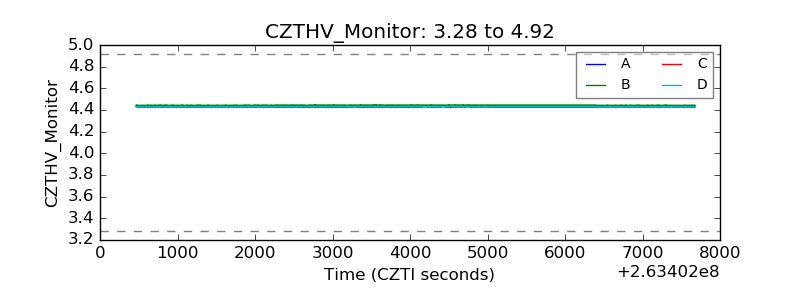 |
| D_VDD | 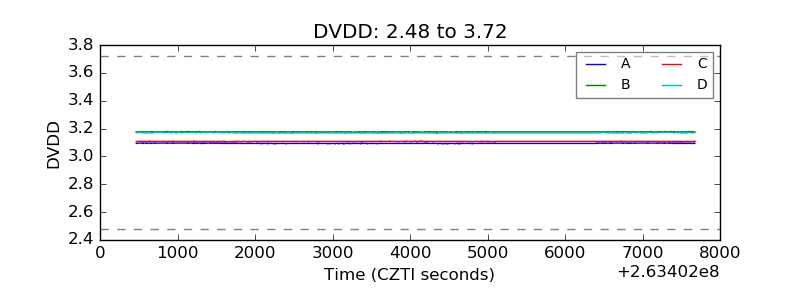 |
| Temperature 1 |  |
| Veto HV Monitor | 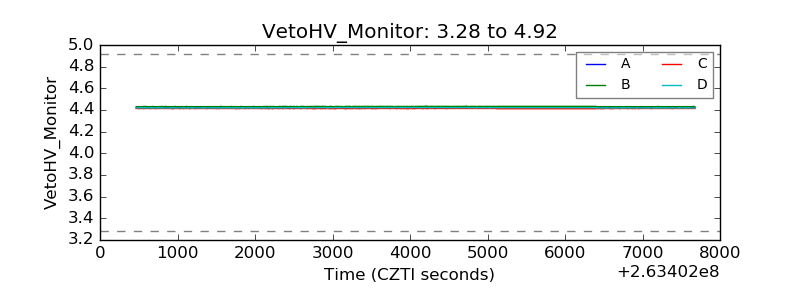 |
| Veto LLD | 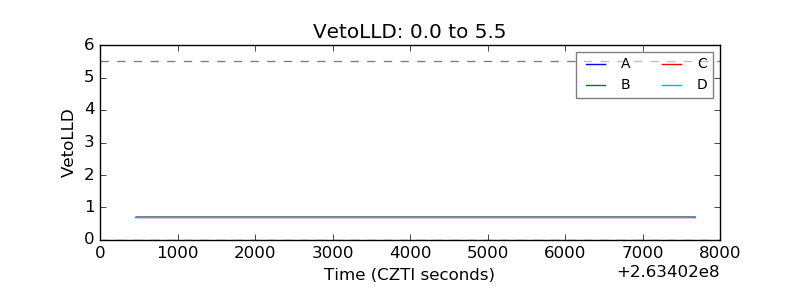 |
| Alpha Counter | 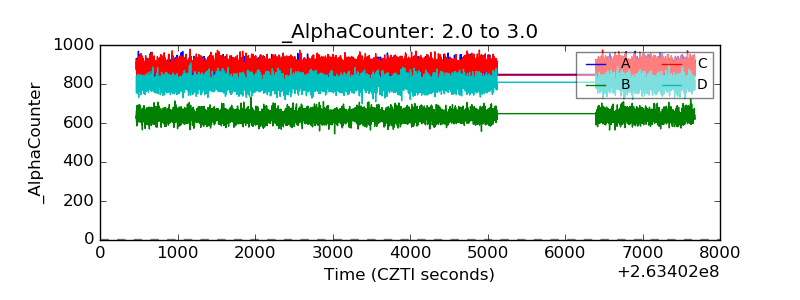 |
| _CPM_Rate | 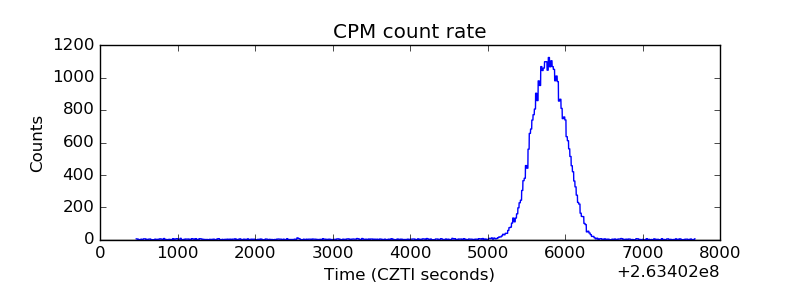 |
| CZT Counter | 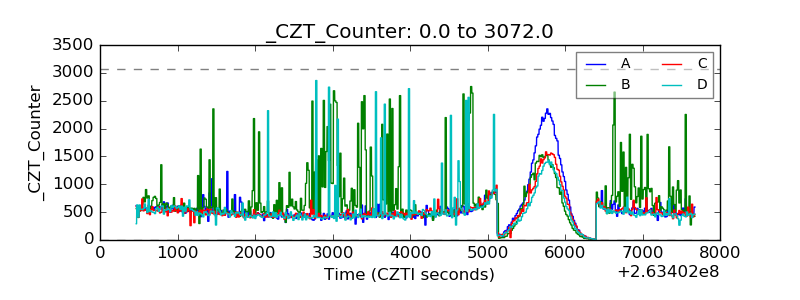 |
| +2.5 Volts monitor |  |
| +5 Volts monitor |  |
| _ROLL_ROT | 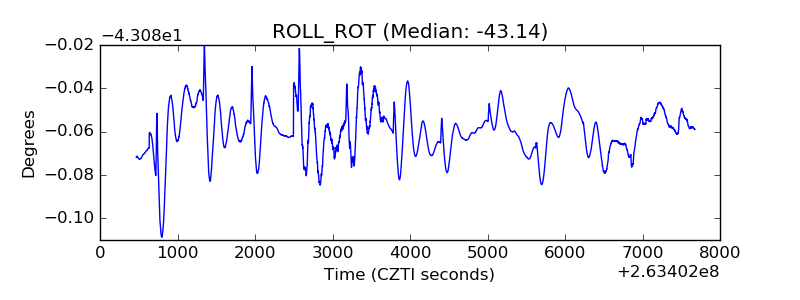 |
| _Roll_DEC | 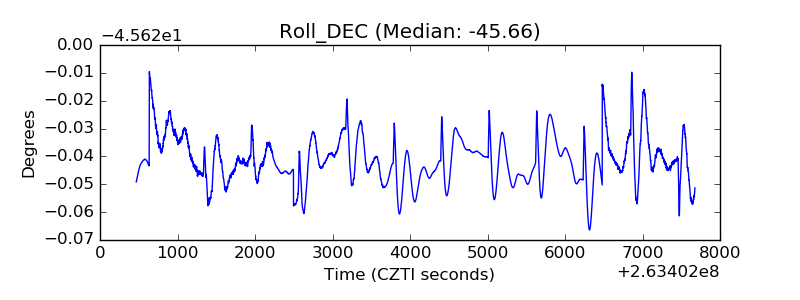 |
| _Roll_RA | 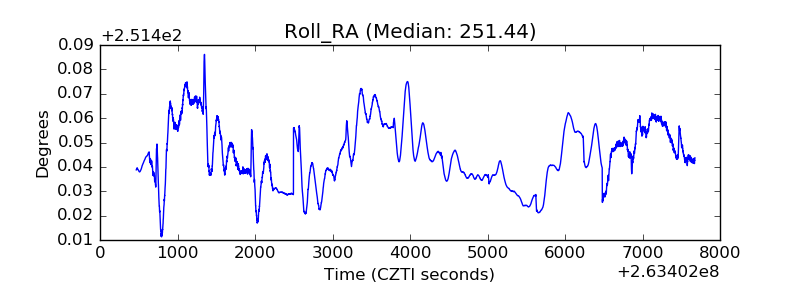 |
| Veto Counter | 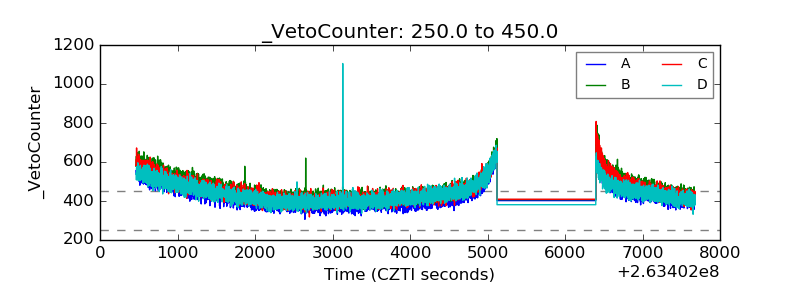 |