| Param | Original file | Final file |
|---|---|---|
| Filename | modeM0/AS1G08_022T01_9000002078_14100cztM0_level2.evt | modeM0/AS1G08_022T01_9000002078_14100cztM0_level2_quad_clean.evt |
| Size (bytes) | 504,103,680 | 102,435,840 |
| Size | 480.8 MB | 97.7 MB |
| Events in quadrant A | 3,303,011 | 693,643 |
| Events in quadrant B | 4,819,819 | 659,809 |
| Events in quadrant C | 3,216,598 | 655,975 |
| Events in quadrant D | 3,481,179 | 634,490 |
| Mode SS | |||
|---|---|---|---|
| Quadrant | BADHDUFLAG | Total packets | Discarded packets |
| A | 0 | 132 | 0 |
| B | 0 | 132 | 0 |
| C | 0 | 132 | 0 |
| D | 0 | 132 | 0 |
| Mode M9 | |||
|---|---|---|---|
| Quadrant | BADHDUFLAG | Total packets | Discarded packets |
| A | 0 | 12 | 0 |
| B | 0 | 12 | 0 |
| C | 0 | 12 | 0 |
| D | 0 | 13 | 0 |
| Mode M0 | |||
|---|---|---|---|
| Quadrant | BADHDUFLAG | Total packets | Discarded packets |
| A | 0 | 13856 | 3 |
| B | 0 | 18759 | 2 |
| C | 0 | 13756 | 2 |
| D | 0 | 14906 | 2 |
| Quadrant | Total seconds | Saturated seconds | Saturation percentage |
|---|---|---|---|
| A | 6577 | 48 | 0.729816% |
| B | 6577 | 515 | 7.830318% |
| C | 6577 | 27 | 0.410522% |
| D | 6577 | 32 | 0.486544% |
Noise dominated data is calculated using 1-second bins in cleaned event files. If a bin has >2000 counts, and if more than 50% of those come from <1% of pixels, then it is considered to be noise-dominated and hence unusable.
| Quadrant | # 1 sec bins | Bins with >0 counts | Bins with >2000 counts | High rate bins dominated by noise | Noise dominated (total time) | Noise dominated (detector-on time) | Marked lightcurve |
|---|---|---|---|---|---|---|---|
| A | 7593 | 6579 | 3 | 3 | 0.04% | 0.05% | 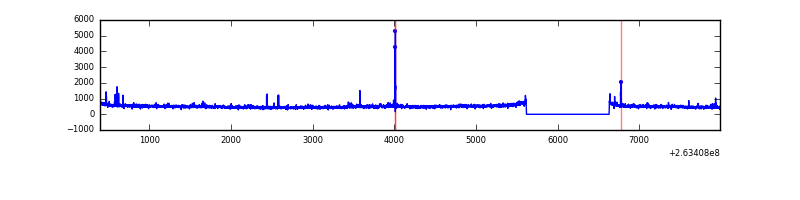 |
| B | 7593 | 6579 | 243 | 243 | 3.20% | 3.69% | 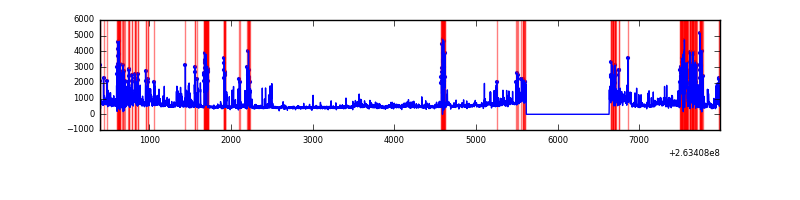 |
| C | 7593 | 6579 | 10 | 10 | 0.13% | 0.15% | 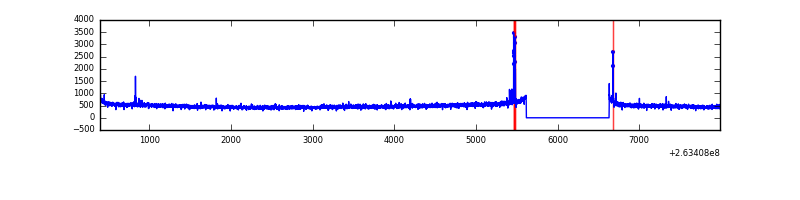 |
| D | 7593 | 6579 | 10 | 10 | 0.13% | 0.15% | 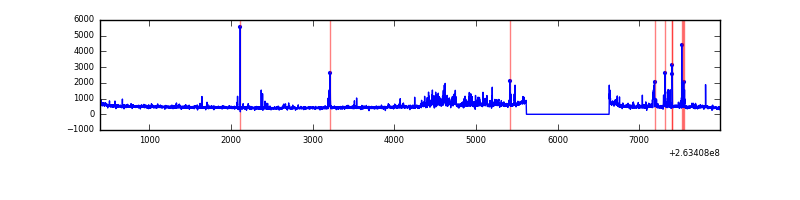 |
Top three noisy pixels from each quadrant. If the there are fewer than three noisy pixels in the level2.evt file, extra rows are filled as -1
| Pixel properties | Quadrant properties | ||||||
|---|---|---|---|---|---|---|---|
| Quadrant | DetID | PixID | Counts | Sigma | Mean | Median | Sigma |
| A | 15 | 222 | 52448 | 312.1 | 816 | 797 | 165.5 |
| A | 12 | 189 | 49249 | 292.77 | 816 | 797 | 165.5 |
| A | 8 | 15 | 41054 | 243.25 | 816 | 797 | 165.5 |
| B | 10 | 16 | 1461060 | 9781.79 | 789 | 771 | 149.3 |
| B | 0 | 189 | 151292 | 1008.27 | 789 | 771 | 149.3 |
| B | 0 | 229 | 32204 | 210.55 | 789 | 771 | 149.3 |
| C | 3 | 233 | 127725 | 709.01 | 779 | 785 | 179.0 |
| C | 0 | 207 | 47171 | 259.09 | 779 | 785 | 179.0 |
| C | 13 | 61 | 5782 | 27.91 | 779 | 785 | 179.0 |
| D | 1 | 52 | 249899 | 1307.94 | 770 | 750 | 190.5 |
| D | 15 | 0 | 97210 | 506.38 | 770 | 750 | 190.5 |
| D | 2 | 152 | 67257 | 349.14 | 770 | 750 | 190.5 |
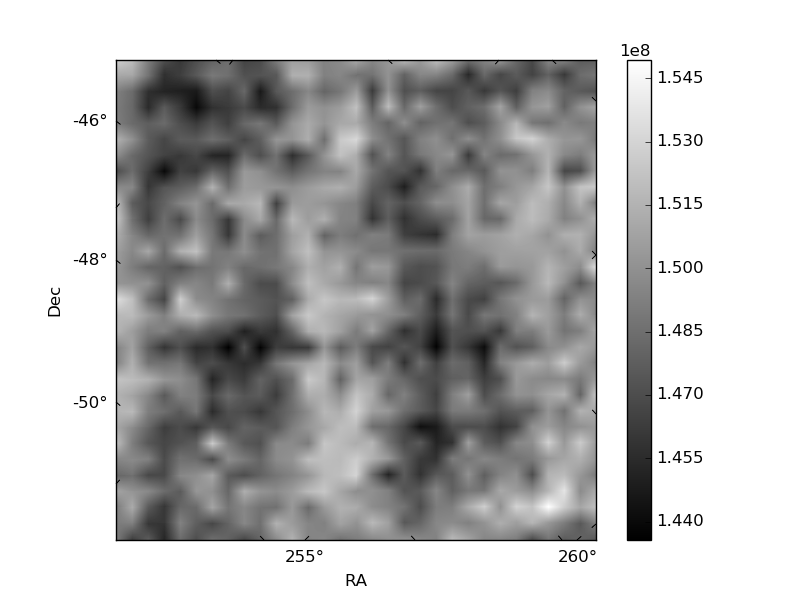
Histogram calculated using DETX and DETY for each event in the final _common_clean file
| Quadrant A |  |
 |
Quadrant B |
|---|---|---|---|
| Quadrant D |  |
 |
Quadrant C |
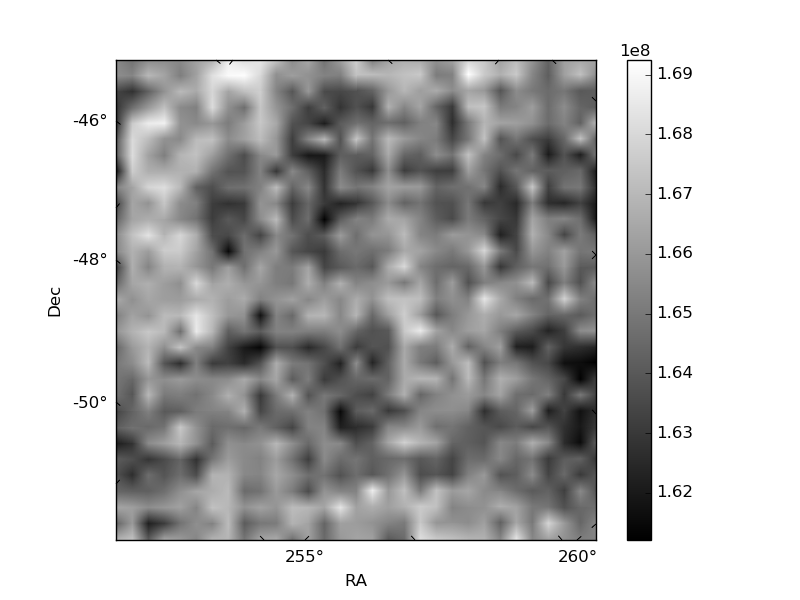
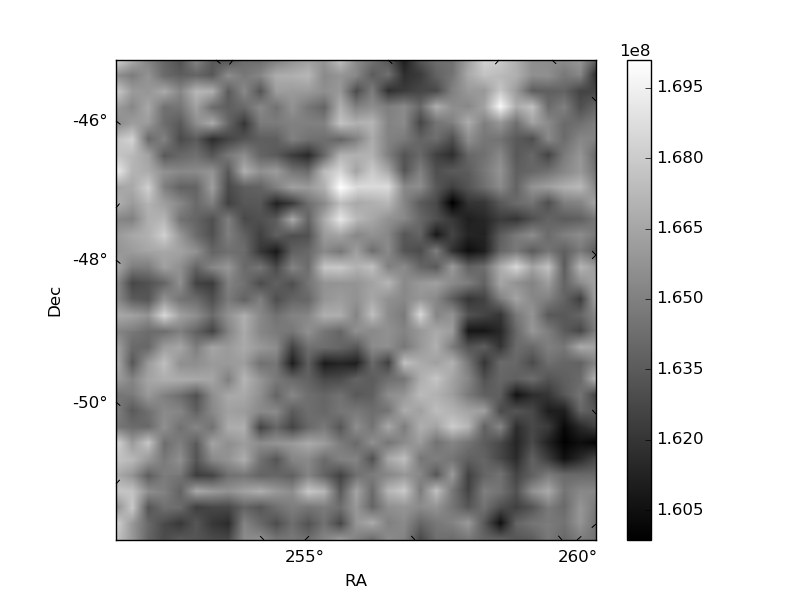
| Plot type | Count rate plots | Images |
|---|---|---|
| Comparison with Poisson distribution Blue bars denote a histogram of data divided into 1 sec bins. Red curve is a Poisson curve with rate = median count rate of data. |
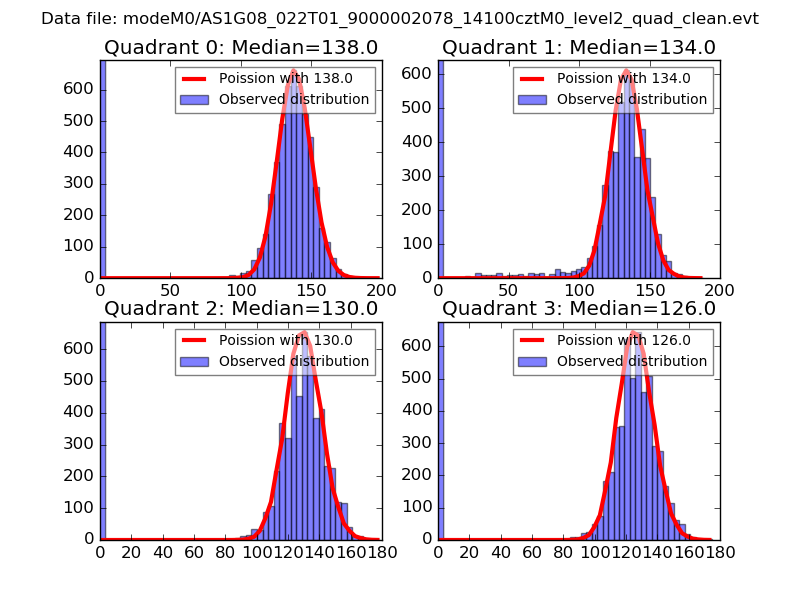 |
 |
| Quadrant-wise count rates Data is divided into 100 sec bins |
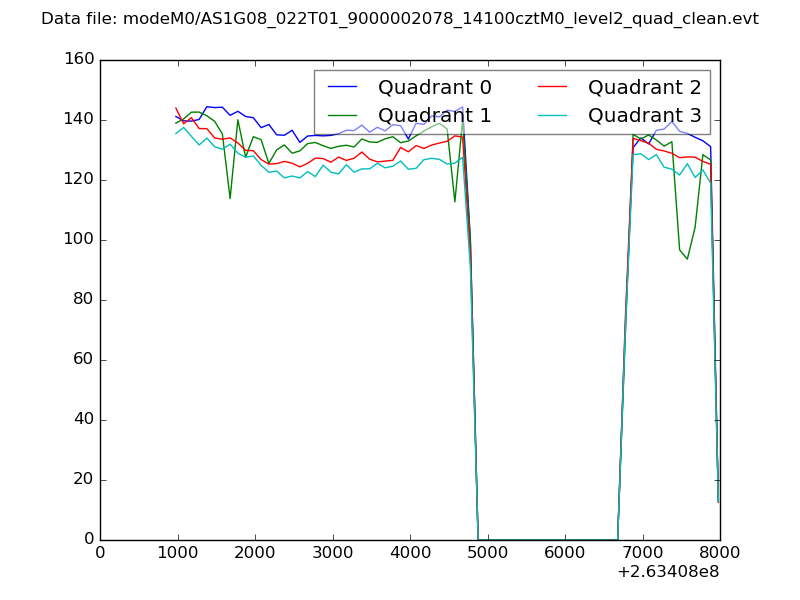 |
|
| Module-wise count rates for Quadrant A Data is divided into 100 sec bins |
 |
 |
| Module-wise count rates for Quadrant B Data is divided into 100 sec bins |
 |
 |
| Module-wise count rates for Quadrant C Data is divided into 100 sec bins |
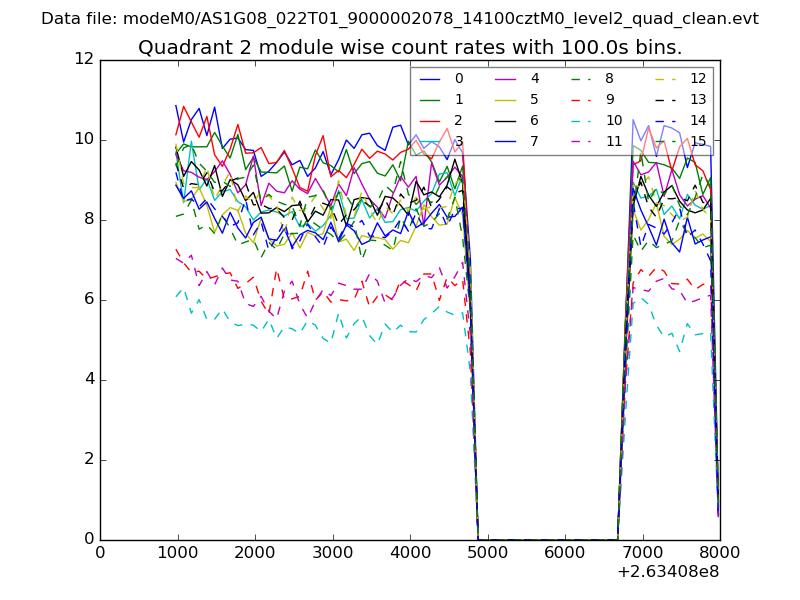 |
 |
| Module-wise count rates for Quadrant D Data is divided into 100 sec bins |
 |
 |
| Parameter | Plot |
|---|---|
| CZT HV Monitor | 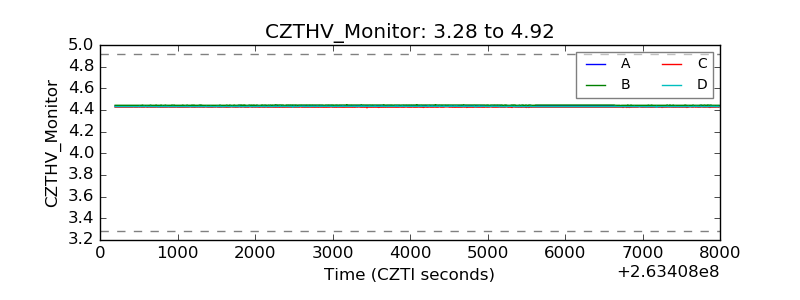 |
| D_VDD |  |
| Temperature 1 |  |
| Veto HV Monitor |  |
| Veto LLD |  |
| Alpha Counter | 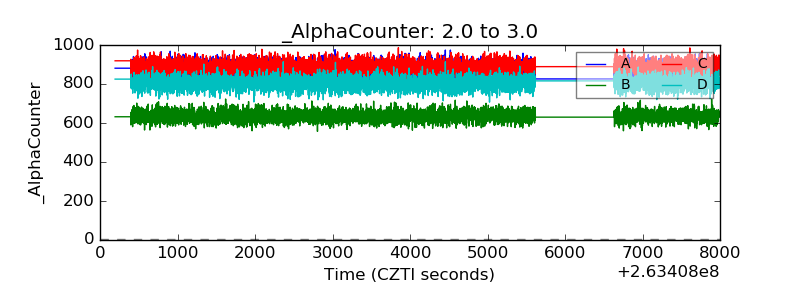 |
| _CPM_Rate | 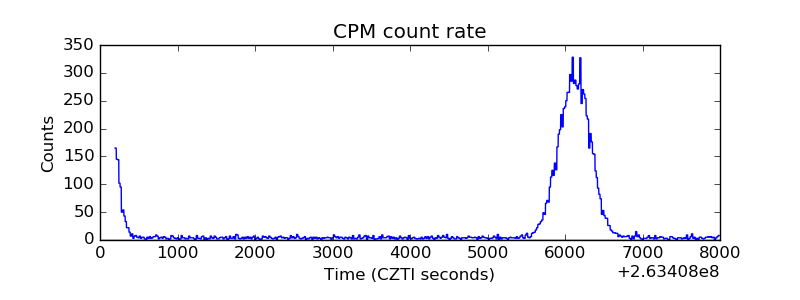 |
| CZT Counter |  |
| +2.5 Volts monitor |  |
| +5 Volts monitor |  |
| _ROLL_ROT |  |
| _Roll_DEC |  |
| _Roll_RA |  |
| Veto Counter |  |