| Param | Original file | Final file |
|---|---|---|
| Filename | modeM0/AS1G08_022T01_9000002078_14101cztM0_level2.evt | modeM0/AS1G08_022T01_9000002078_14101cztM0_level2_quad_clean.evt |
| Size (bytes) | 577,710,720 | 103,956,480 |
| Size | 550.9 MB | 99.1 MB |
| Events in quadrant A | 3,594,354 | 692,223 |
| Events in quadrant B | 5,079,198 | 662,471 |
| Events in quadrant C | 3,543,156 | 658,987 |
| Events in quadrant D | 4,790,067 | 632,229 |
| Mode SS | |||
|---|---|---|---|
| Quadrant | BADHDUFLAG | Total packets | Discarded packets |
| A | 0 | 148 | 0 |
| B | 0 | 148 | 0 |
| C | 0 | 148 | 0 |
| D | 0 | 148 | 0 |
| Mode M9 | |||
|---|---|---|---|
| Quadrant | BADHDUFLAG | Total packets | Discarded packets |
| A | 0 | 16 | 0 |
| B | 0 | 16 | 0 |
| C | 0 | 16 | 0 |
| D | 0 | 16 | 0 |
| Mode M0 | |||
|---|---|---|---|
| Quadrant | BADHDUFLAG | Total packets | Discarded packets |
| A | 0 | 15376 | 3 |
| B | 0 | 19923 | 2 |
| C | 0 | 15123 | 2 |
| D | 0 | 19372 | 2 |
| Quadrant | Total seconds | Saturated seconds | Saturation percentage |
|---|---|---|---|
| A | 7217 | 84 | 1.163919% |
| B | 7217 | 592 | 8.202854% |
| C | 7217 | 33 | 0.457254% |
| D | 7217 | 262 | 3.630317% |
Noise dominated data is calculated using 1-second bins in cleaned event files. If a bin has >2000 counts, and if more than 50% of those come from <1% of pixels, then it is considered to be noise-dominated and hence unusable.
| Quadrant | # 1 sec bins | Bins with >0 counts | Bins with >2000 counts | High rate bins dominated by noise | Noise dominated (total time) | Noise dominated (detector-on time) | Marked lightcurve |
|---|---|---|---|---|---|---|---|
| A | 8803 | 7220 | 2 | 2 | 0.02% | 0.03% | 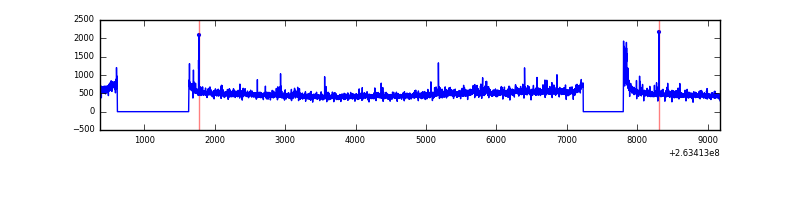 |
| B | 8803 | 7220 | 244 | 244 | 2.77% | 3.38% | 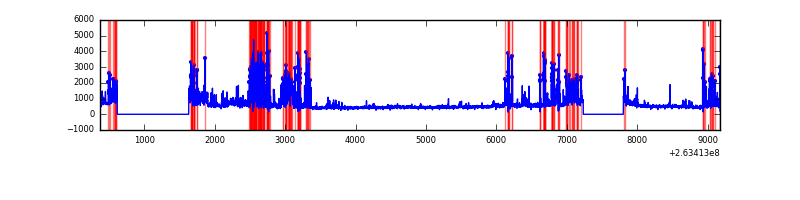 |
| C | 8803 | 7220 | 10 | 10 | 0.11% | 0.14% | 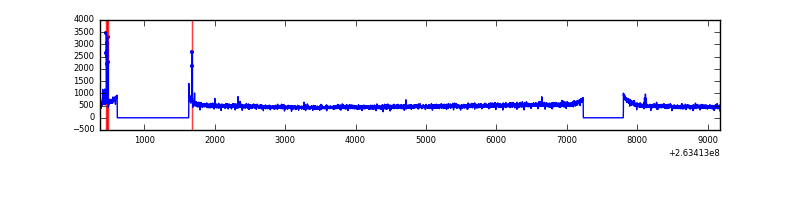 |
| D | 8803 | 7220 | 118 | 118 | 1.34% | 1.63% | 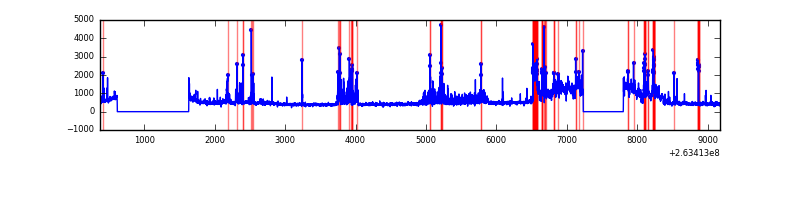 |
Top three noisy pixels from each quadrant. If the there are fewer than three noisy pixels in the level2.evt file, extra rows are filled as -1
| Pixel properties | Quadrant properties | ||||||
|---|---|---|---|---|---|---|---|
| Quadrant | DetID | PixID | Counts | Sigma | Mean | Median | Sigma |
| A | 8 | 15 | 62696 | 346.13 | 886 | 866 | 178.6 |
| A | 12 | 189 | 55820 | 307.63 | 886 | 866 | 178.6 |
| A | 15 | 222 | 49055 | 269.76 | 886 | 866 | 178.6 |
| B | 10 | 16 | 1470038 | 9024.2 | 857 | 834 | 162.8 |
| B | 0 | 189 | 154878 | 946.17 | 857 | 834 | 162.8 |
| B | 3 | 209 | 25908 | 154.01 | 857 | 834 | 162.8 |
| C | 3 | 233 | 177131 | 896.83 | 852 | 855 | 196.6 |
| C | 0 | 207 | 42998 | 214.41 | 852 | 855 | 196.6 |
| C | 13 | 61 | 6102 | 26.69 | 852 | 855 | 196.6 |
| D | 1 | 52 | 1197702 | 6006.09 | 835 | 815 | 199.3 |
| D | 15 | 0 | 227573 | 1137.89 | 835 | 815 | 199.3 |
| D | 10 | 157 | 55435 | 274.09 | 835 | 815 | 199.3 |
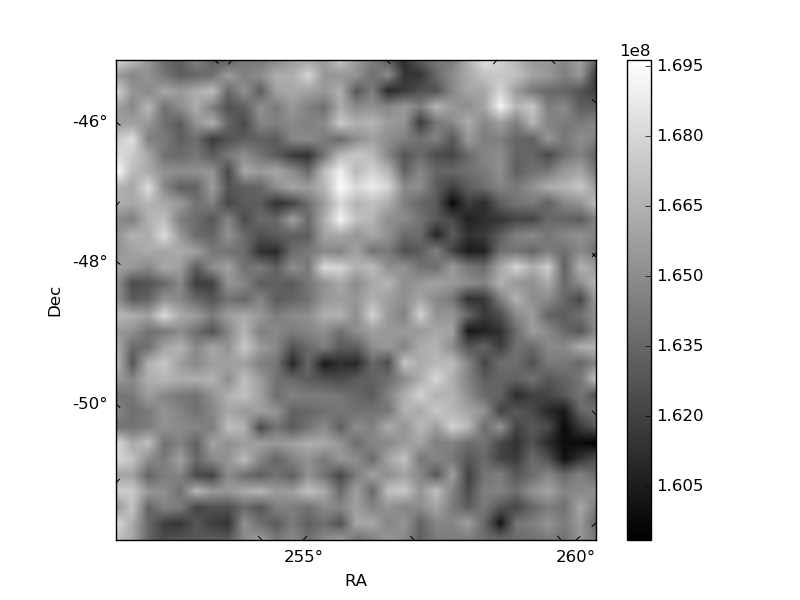
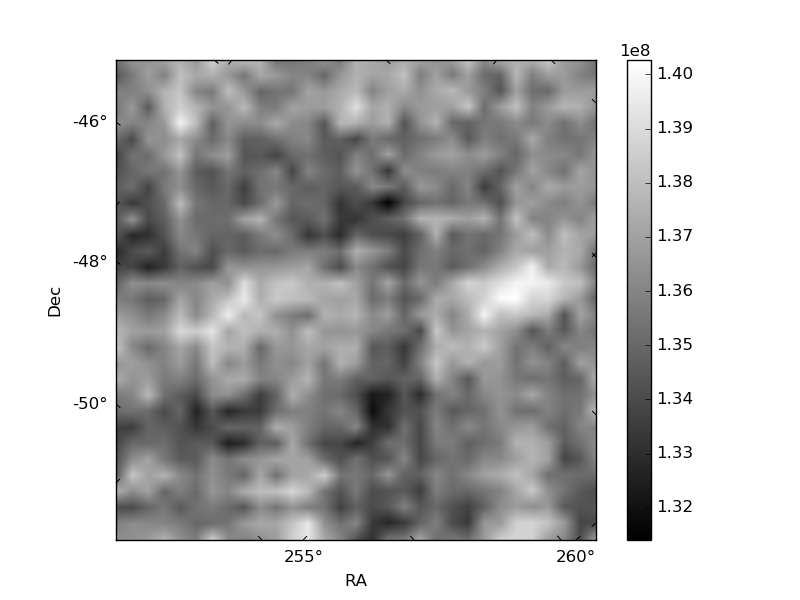
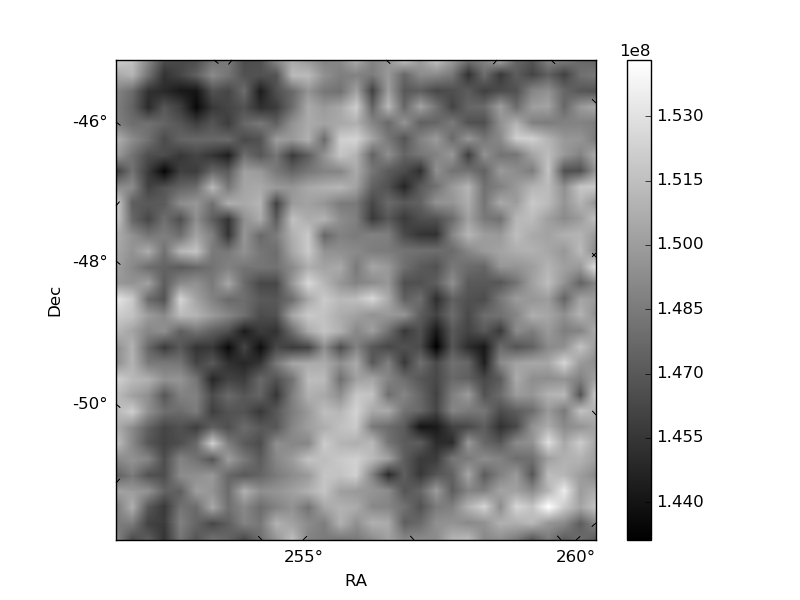
Histogram calculated using DETX and DETY for each event in the final _common_clean file
| Quadrant A | 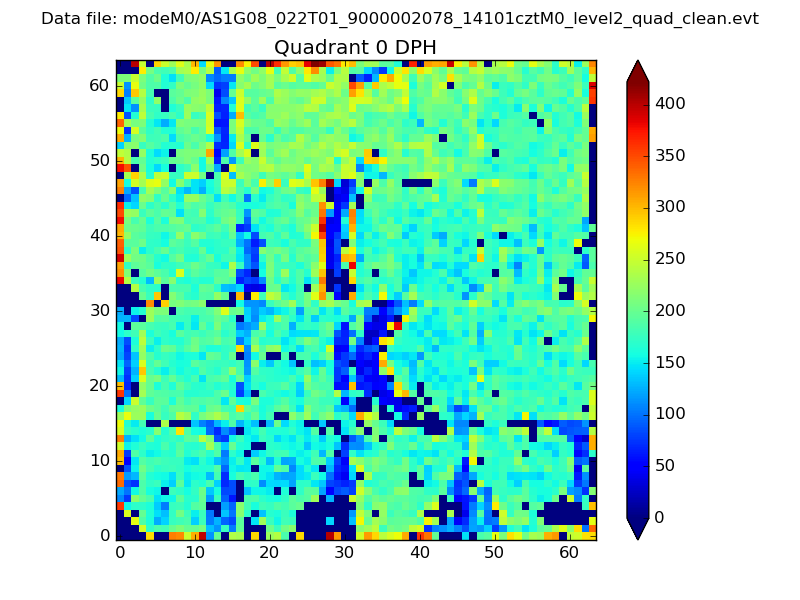 |
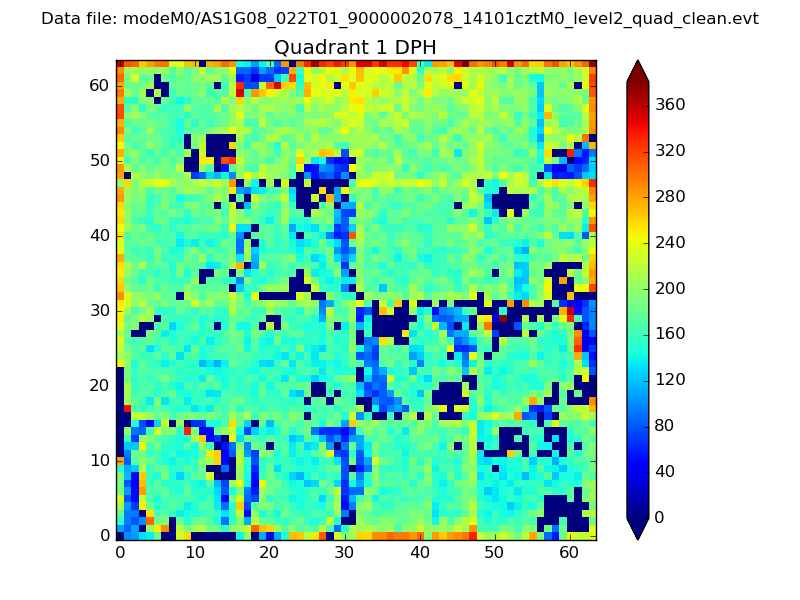 |
Quadrant B |
|---|---|---|---|
| Quadrant D | 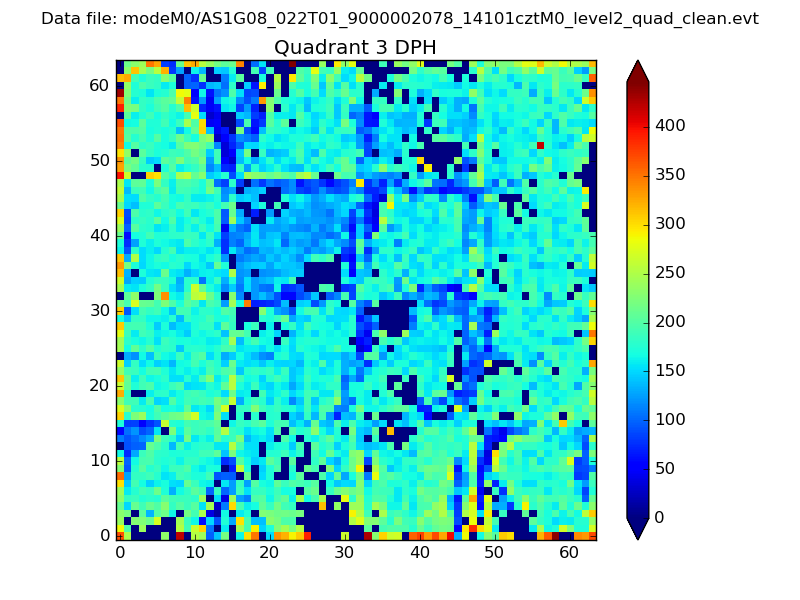 |
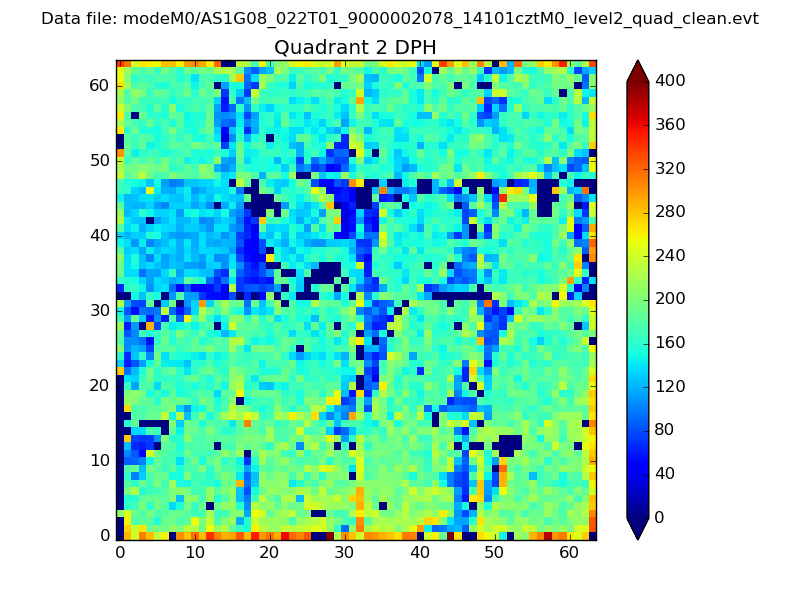 |
Quadrant C |
| Plot type | Count rate plots | Images |
|---|---|---|
| Comparison with Poisson distribution Blue bars denote a histogram of data divided into 1 sec bins. Red curve is a Poisson curve with rate = median count rate of data. |
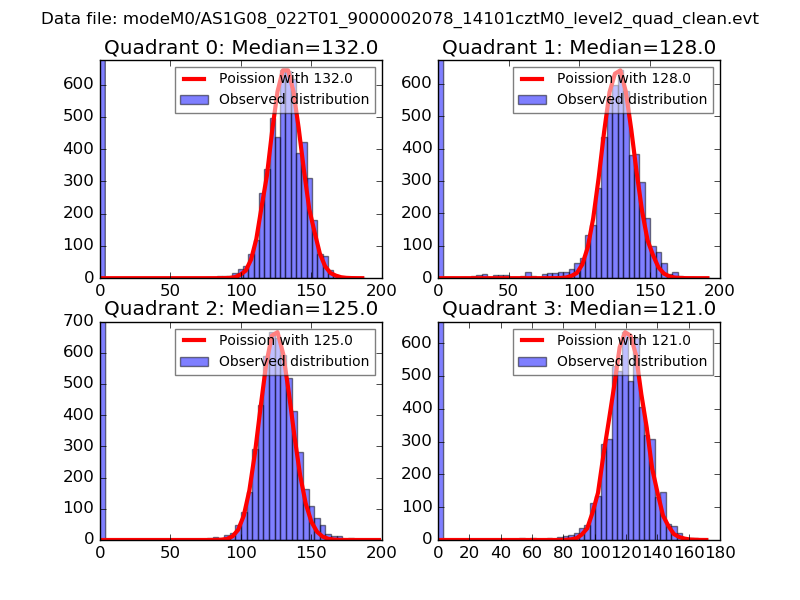 |
 |
| Quadrant-wise count rates Data is divided into 100 sec bins |
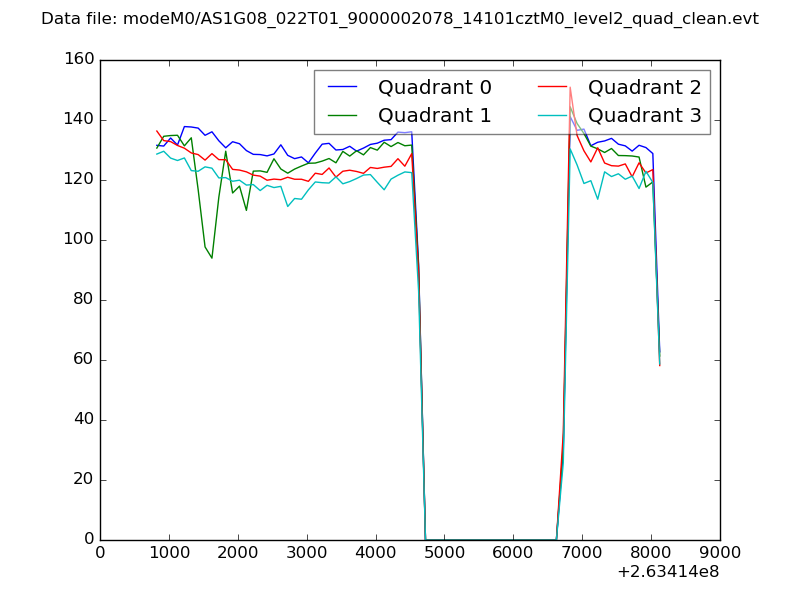 |
|
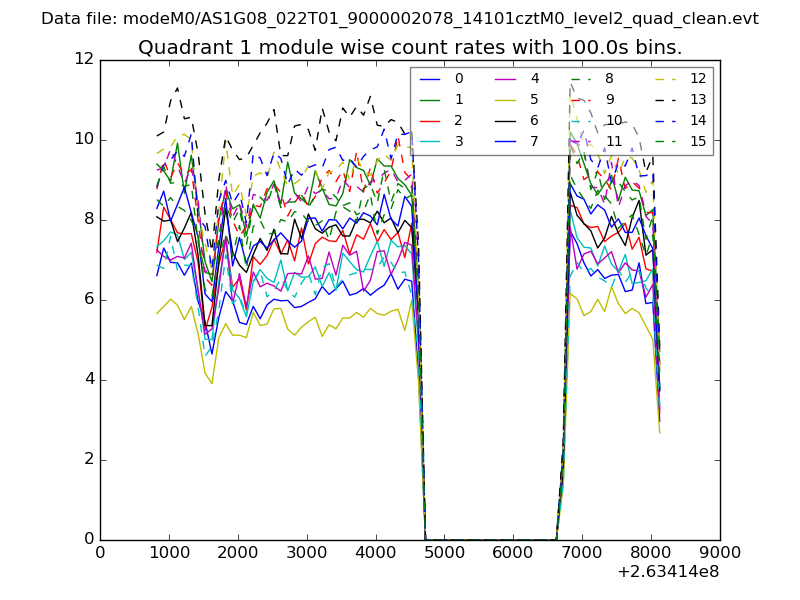
| Module-wise count rates for Quadrant A Data is divided into 100 sec bins |
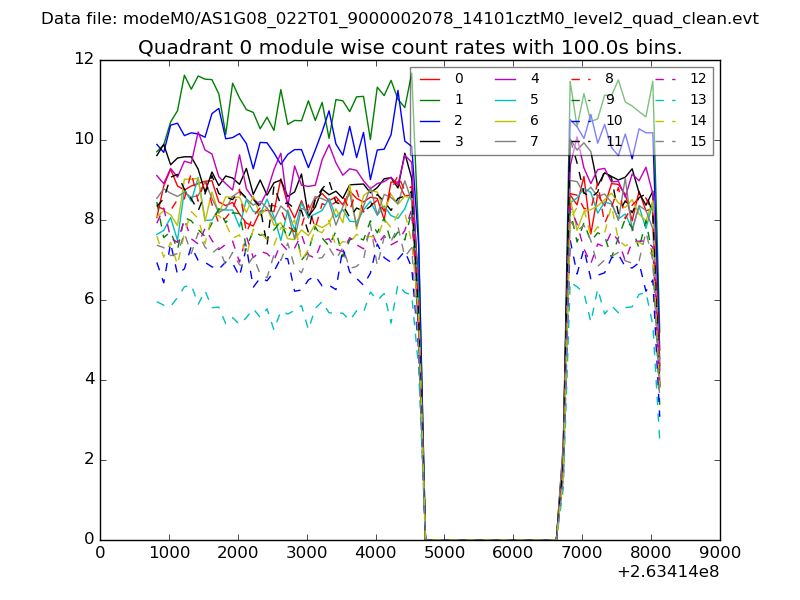 |
 |
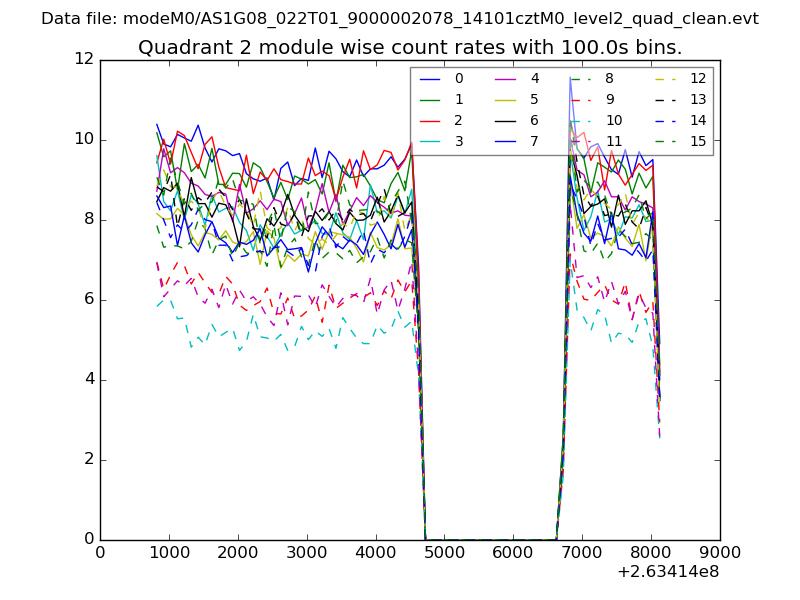
| Module-wise count rates for Quadrant B Data is divided into 100 sec bins |
 |
 |
| Module-wise count rates for Quadrant C Data is divided into 100 sec bins |
 |
 |
| Module-wise count rates for Quadrant D Data is divided into 100 sec bins |
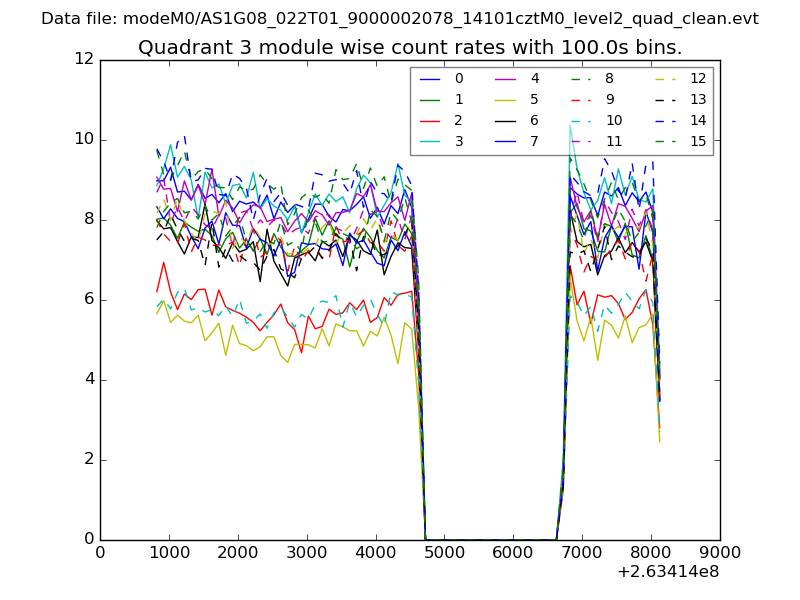 |
 |
| Parameter | Plot |
|---|---|
| CZT HV Monitor | 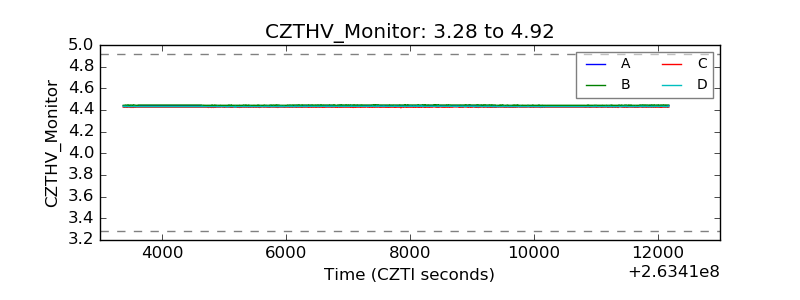 |
| D_VDD | 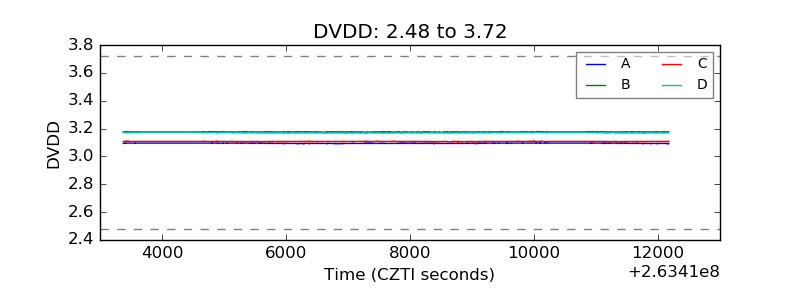 |
| Temperature 1 | 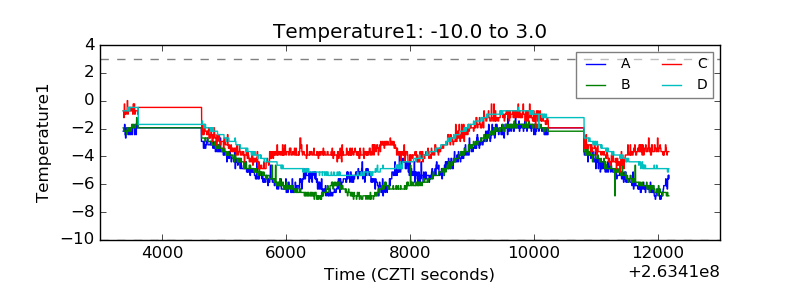 |
| Veto HV Monitor | 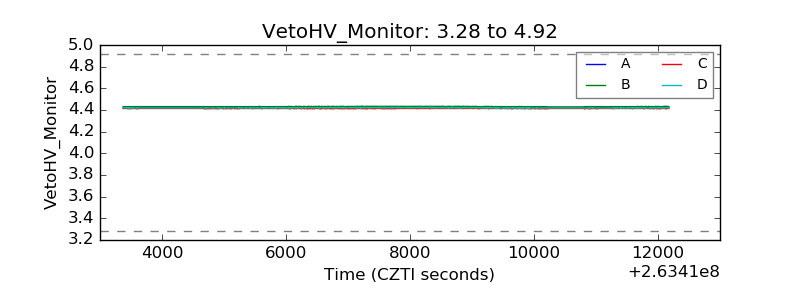 |
| Veto LLD | 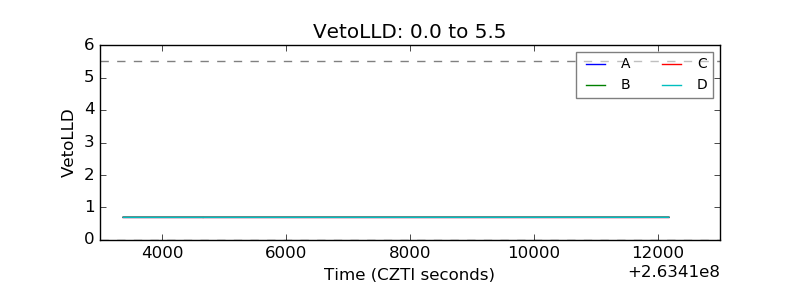 |
| Alpha Counter | 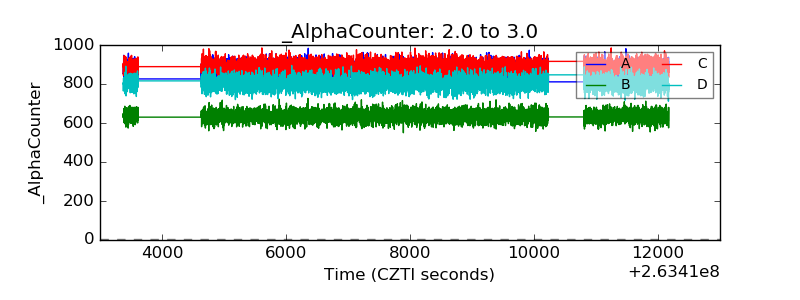 |
| _CPM_Rate | 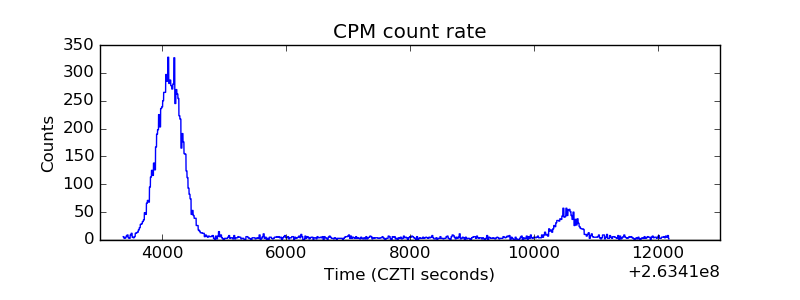 |
| CZT Counter |  |
| +2.5 Volts monitor | 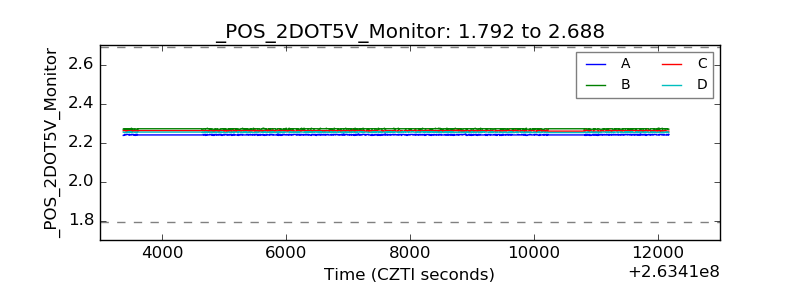 |
| +5 Volts monitor | 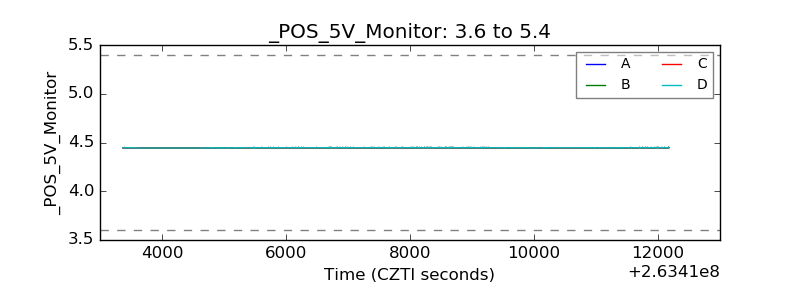 |
| _ROLL_ROT | 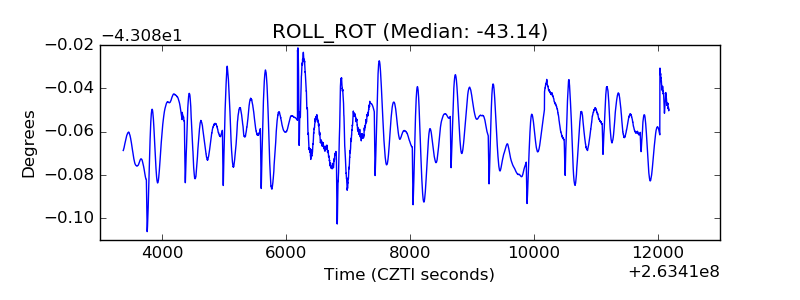 |
| _Roll_DEC | 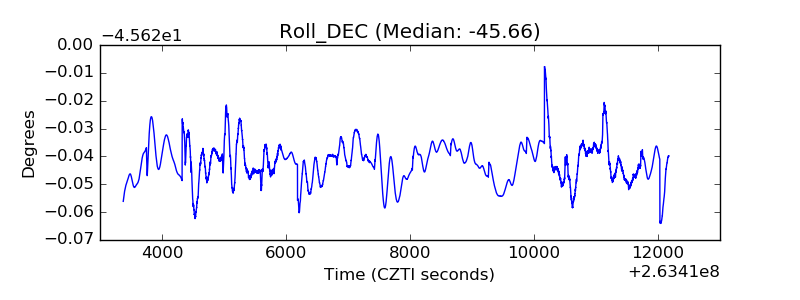 |
| _Roll_RA |  |
| Veto Counter | 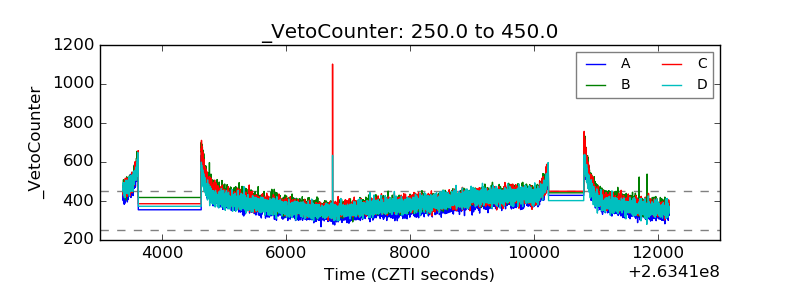 |