| Param | Original file | Final file |
|---|---|---|
| Filename | modeM0/AS1G08_022T01_9000002078_14102cztM0_level2.evt | modeM0/AS1G08_022T01_9000002078_14102cztM0_level2_quad_clean.evt |
| Size (bytes) | 548,645,760 | 111,064,320 |
| Size | 523.2 MB | 105.9 MB |
| Events in quadrant A | 3,899,121 | 734,269 |
| Events in quadrant B | 4,289,412 | 719,781 |
| Events in quadrant C | 3,682,874 | 702,475 |
| Events in quadrant D | 4,227,007 | 676,629 |
| Mode SS | |||
|---|---|---|---|
| Quadrant | BADHDUFLAG | Total packets | Discarded packets |
| A | 0 | 154 | 0 |
| B | 0 | 154 | 0 |
| C | 0 | 154 | 0 |
| D | 0 | 154 | 0 |
| Mode M9 | |||
|---|---|---|---|
| Quadrant | BADHDUFLAG | Total packets | Discarded packets |
| A | 0 | 3 | 0 |
| B | 0 | 3 | 0 |
| C | 0 | 3 | 0 |
| D | 0 | 4 | 0 |
| Mode M0 | |||
|---|---|---|---|
| Quadrant | BADHDUFLAG | Total packets | Discarded packets |
| A | 0 | 16643 | 3 |
| B | 0 | 17888 | 2 |
| C | 0 | 15798 | 2 |
| D | 0 | 18028 | 2 |
| Quadrant | Total seconds | Saturated seconds | Saturation percentage |
|---|---|---|---|
| A | 7625 | 115 | 1.508197% |
| B | 7625 | 224 | 2.937705% |
| C | 7625 | 29 | 0.380328% |
| D | 7625 | 146 | 1.914754% |
Noise dominated data is calculated using 1-second bins in cleaned event files. If a bin has >2000 counts, and if more than 50% of those come from <1% of pixels, then it is considered to be noise-dominated and hence unusable.
| Quadrant | # 1 sec bins | Bins with >0 counts | Bins with >2000 counts | High rate bins dominated by noise | Noise dominated (total time) | Noise dominated (detector-on time) | Marked lightcurve |
|---|---|---|---|---|---|---|---|
| A | 7851 | 7628 | 18 | 18 | 0.23% | 0.24% | 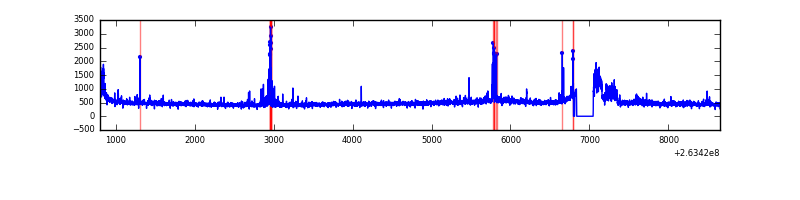 |
| B | 7851 | 7628 | 88 | 88 | 1.12% | 1.15% | 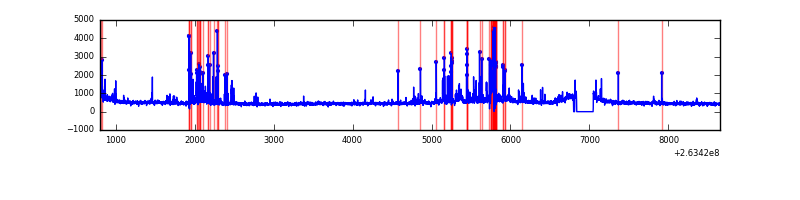 |
| C | 7851 | 7628 | 0 | 0 | 0.00% | 0.00% | 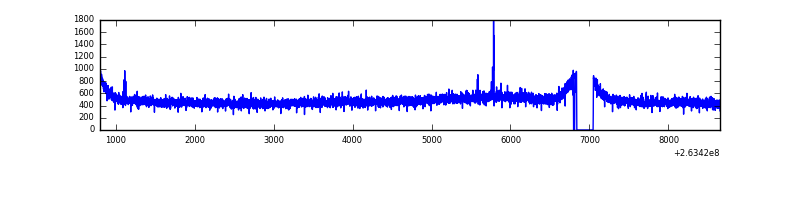 |
| D | 7851 | 7628 | 53 | 53 | 0.68% | 0.69% | 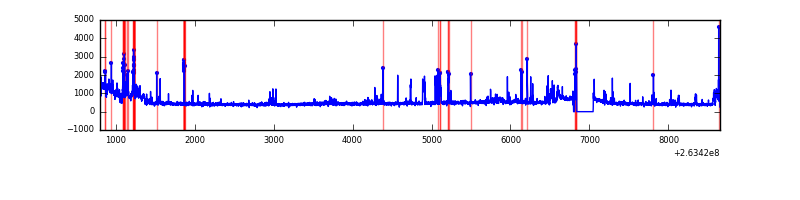 |
Top three noisy pixels from each quadrant. If the there are fewer than three noisy pixels in the level2.evt file, extra rows are filled as -1
| Pixel properties | Quadrant properties | ||||||
|---|---|---|---|---|---|---|---|
| Quadrant | DetID | PixID | Counts | Sigma | Mean | Median | Sigma |
| A | 15 | 222 | 171776 | 919.32 | 917 | 894 | 185.9 |
| A | 9 | 143 | 133891 | 715.5 | 917 | 894 | 185.9 |
| A | 12 | 189 | 49805 | 263.13 | 917 | 894 | 185.9 |
| B | 10 | 16 | 500087 | 2876.98 | 910 | 887 | 173.5 |
| B | 0 | 189 | 144167 | 825.75 | 910 | 887 | 173.5 |
| B | 12 | 111 | 20295 | 111.85 | 910 | 887 | 173.5 |
| C | 3 | 233 | 208872 | 1008.11 | 888 | 891 | 206.3 |
| C | 14 | 234 | 7602 | 32.53 | 888 | 891 | 206.3 |
| C | 13 | 61 | 6375 | 26.58 | 888 | 891 | 206.3 |
| D | 1 | 52 | 314328 | 1515.91 | 874 | 853 | 206.8 |
| D | 15 | 0 | 210302 | 1012.86 | 874 | 853 | 206.8 |
| D | 12 | 110 | 201647 | 971.01 | 874 | 853 | 206.8 |
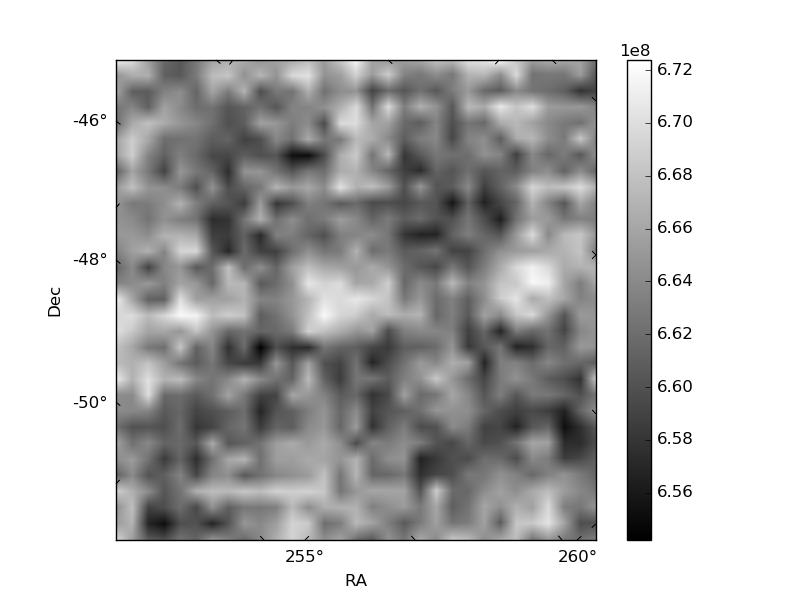
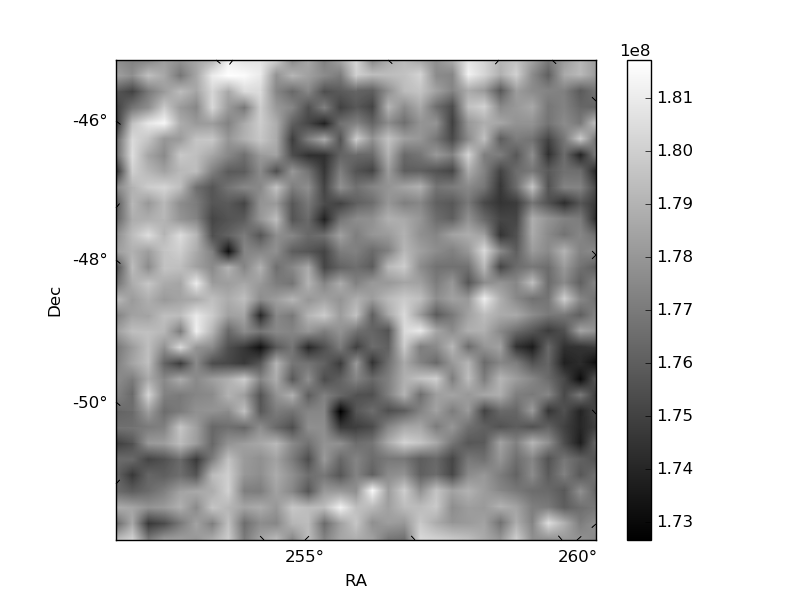
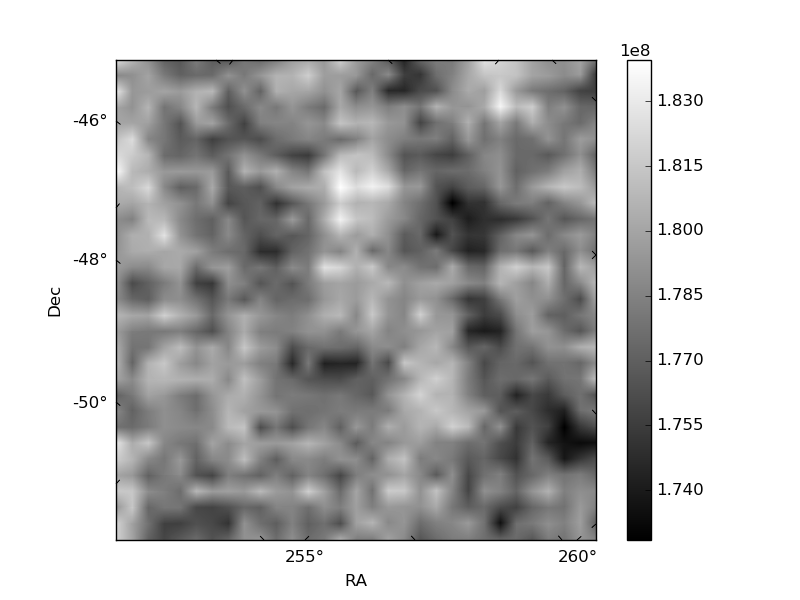
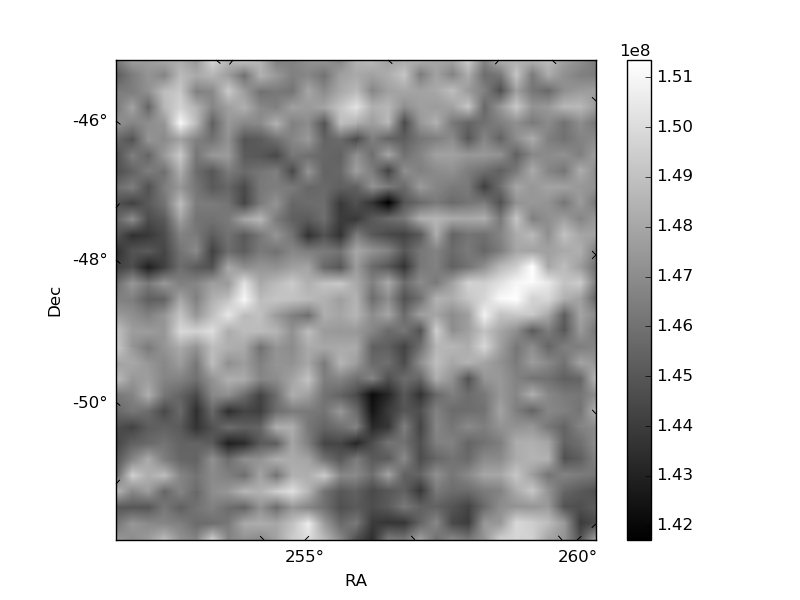
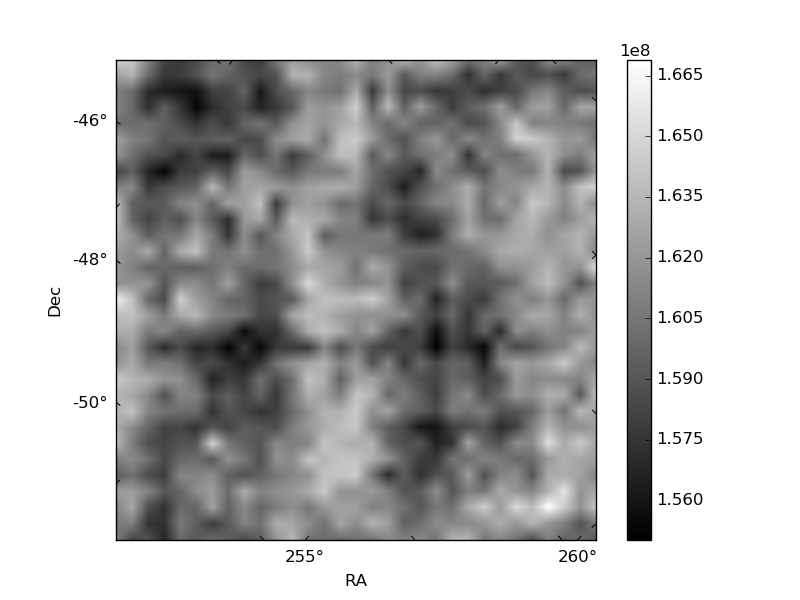
Histogram calculated using DETX and DETY for each event in the final _common_clean file
| Quadrant A | 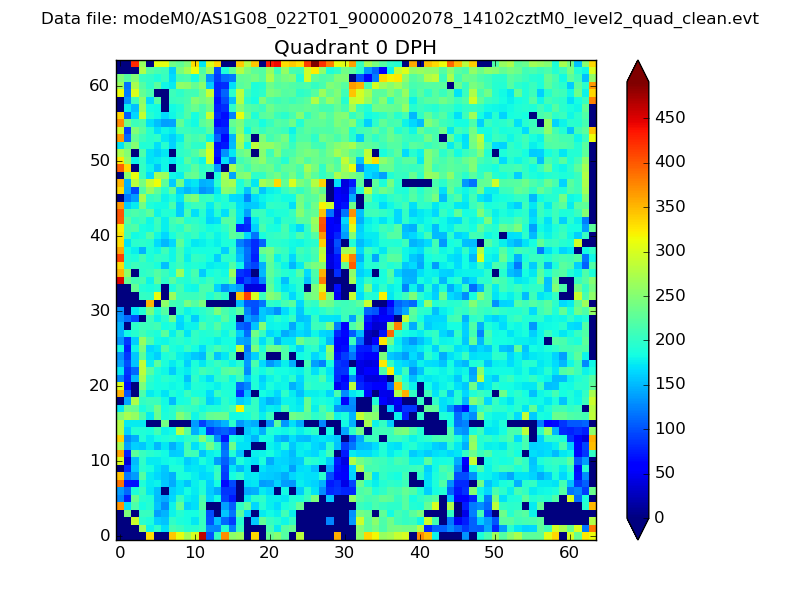 |
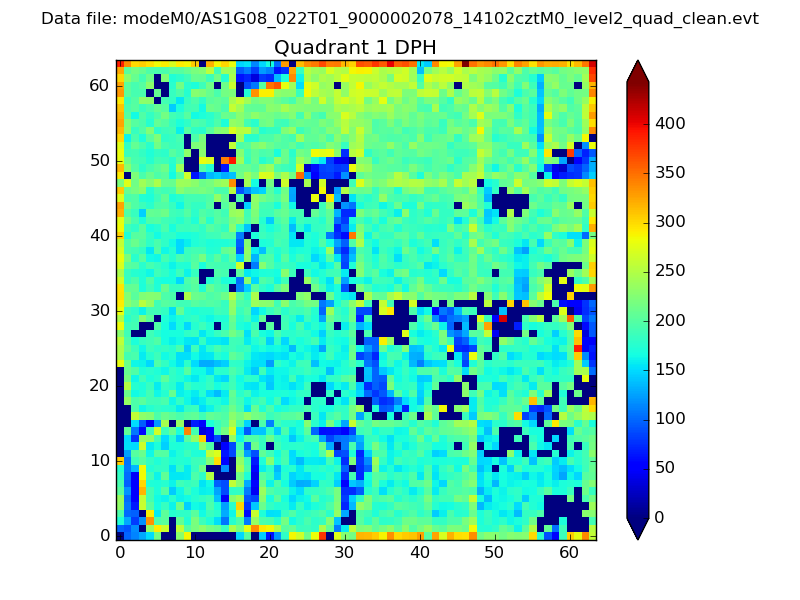 |
Quadrant B |
|---|---|---|---|
| Quadrant D | 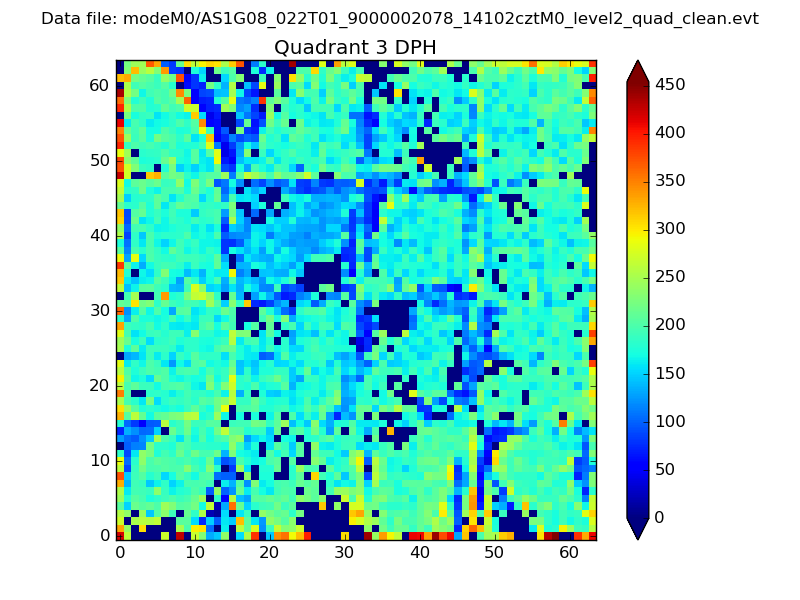 |
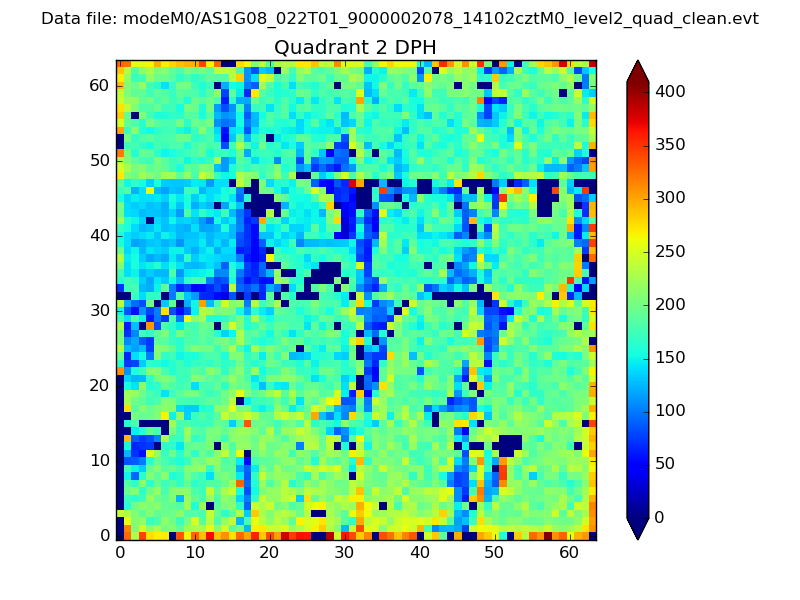 |
Quadrant C |
| Plot type | Count rate plots | Images |
|---|---|---|
| Comparison with Poisson distribution Blue bars denote a histogram of data divided into 1 sec bins. Red curve is a Poisson curve with rate = median count rate of data. |
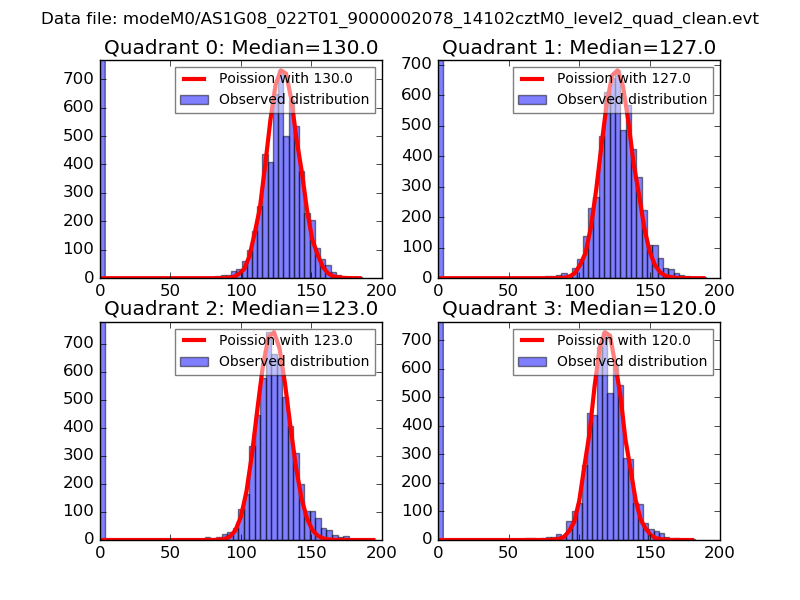 |
 |
| Quadrant-wise count rates Data is divided into 100 sec bins |
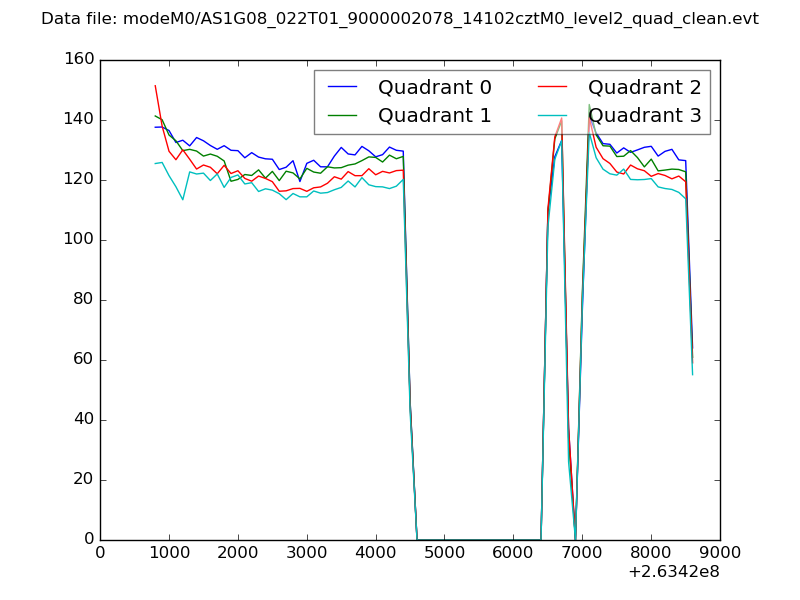 |
|
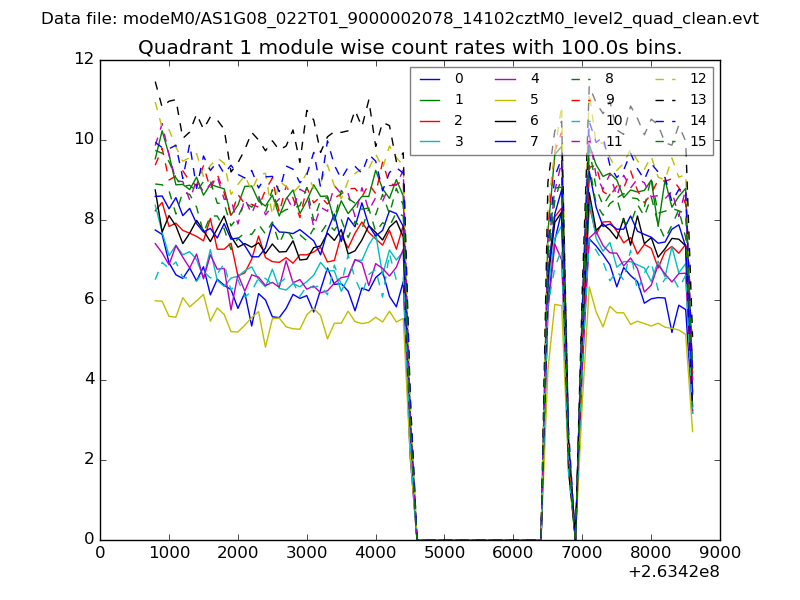
| Module-wise count rates for Quadrant A Data is divided into 100 sec bins |
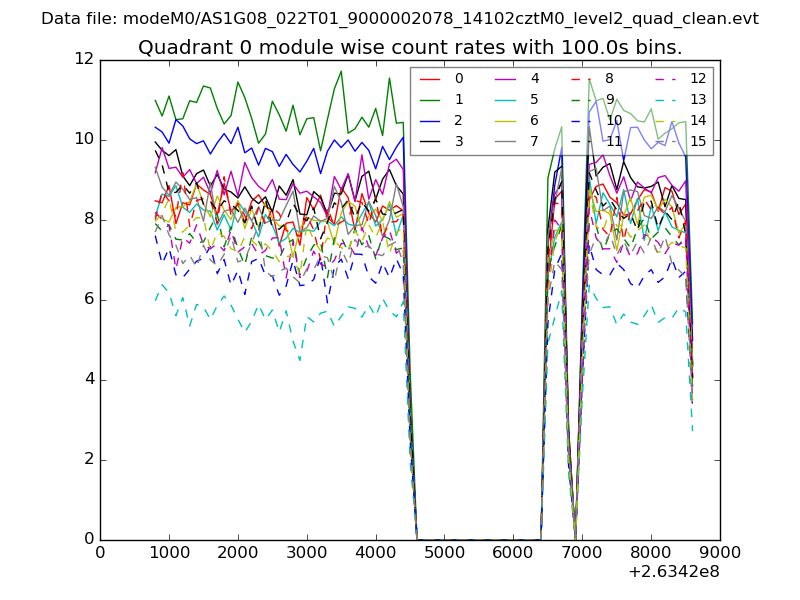 |
 |
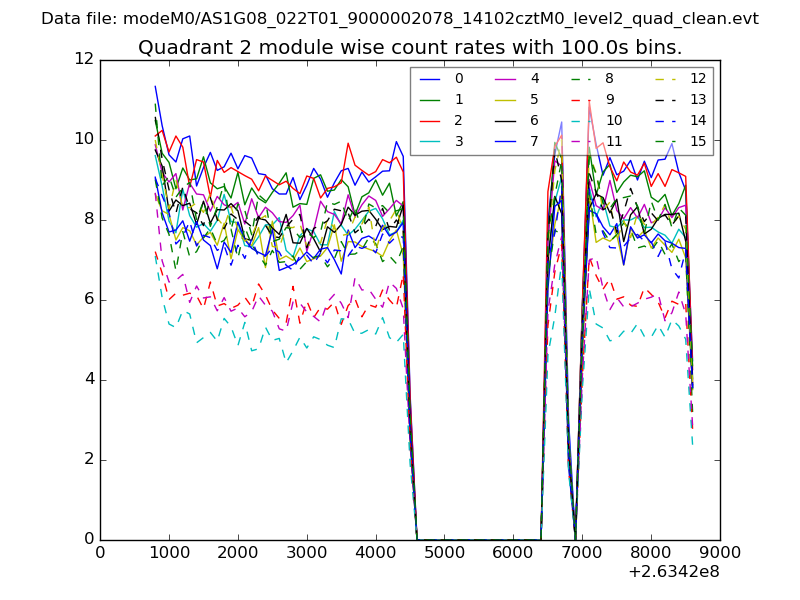
| Module-wise count rates for Quadrant B Data is divided into 100 sec bins |
 |
 |
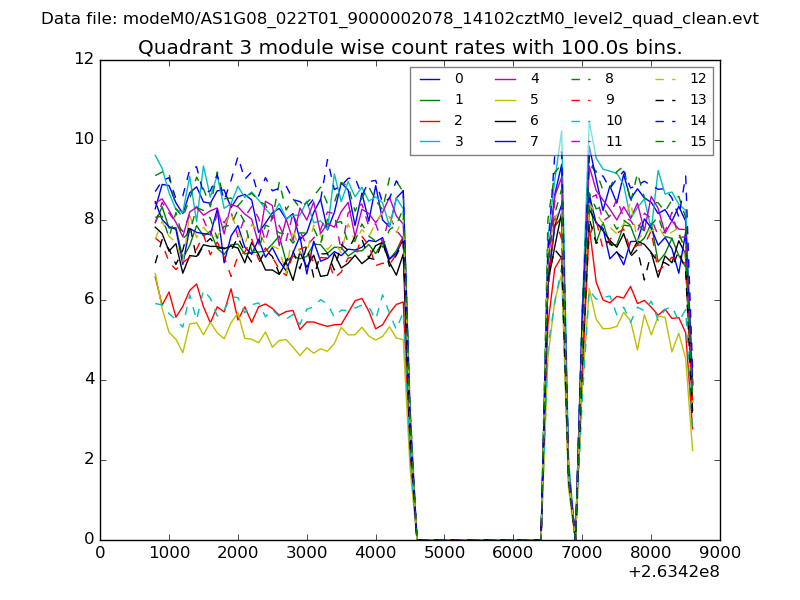
| Module-wise count rates for Quadrant C Data is divided into 100 sec bins |
 |
 |
| Module-wise count rates for Quadrant D Data is divided into 100 sec bins |
 |
 |
| Parameter | Plot |
|---|---|
| CZT HV Monitor | 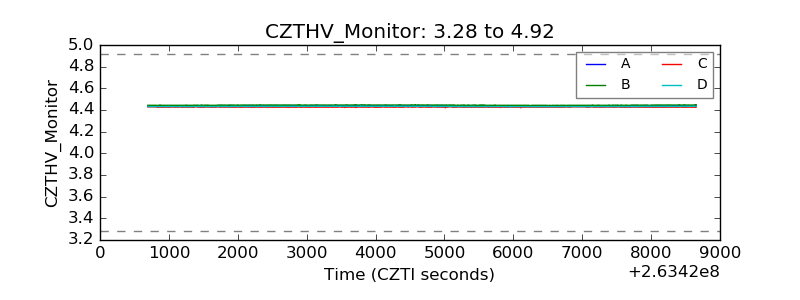 |
| D_VDD | 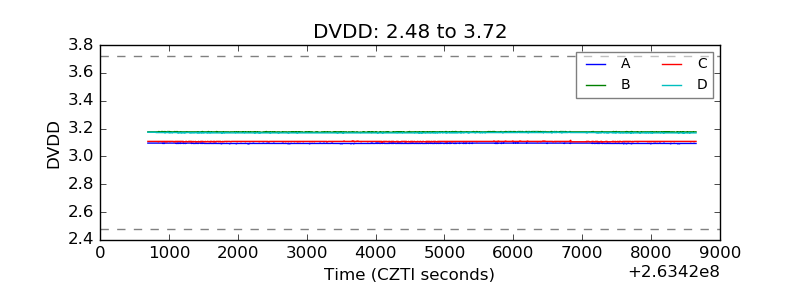 |
| Temperature 1 | 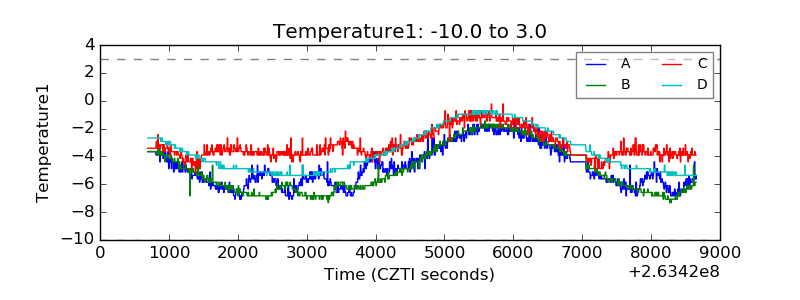 |
| Veto HV Monitor | 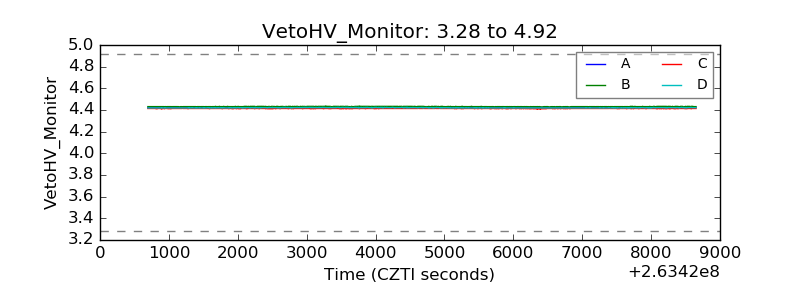 |
| Veto LLD | 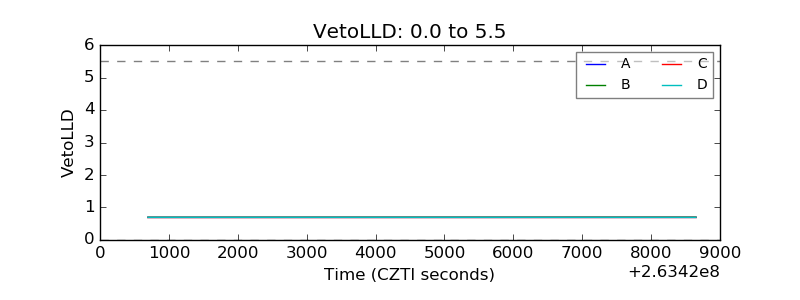 |
| Alpha Counter |  |
| _CPM_Rate | 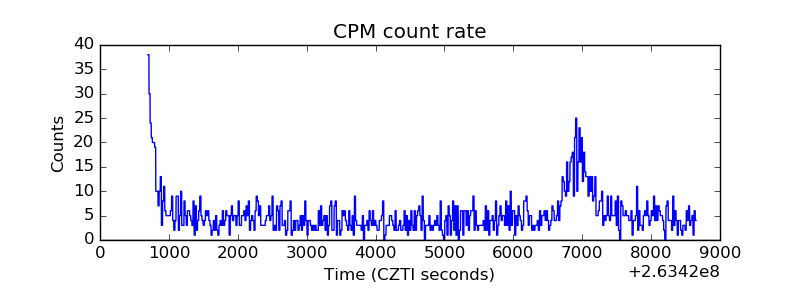 |
| CZT Counter | 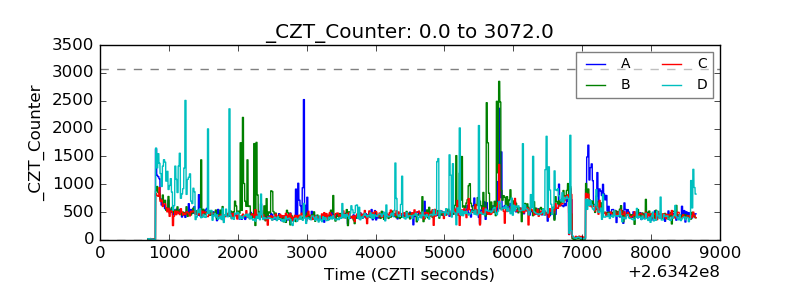 |
| +2.5 Volts monitor |  |
| +5 Volts monitor |  |
| _ROLL_ROT | 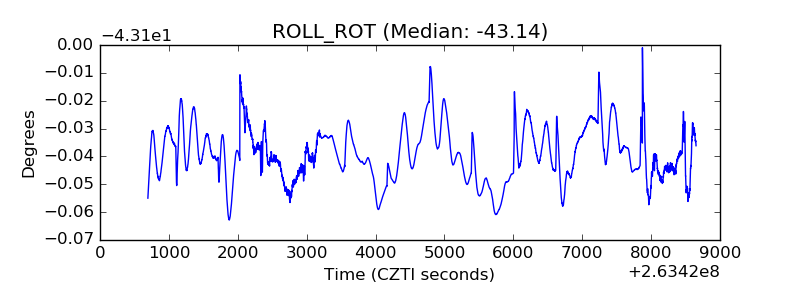 |
| _Roll_DEC |  |
| _Roll_RA | 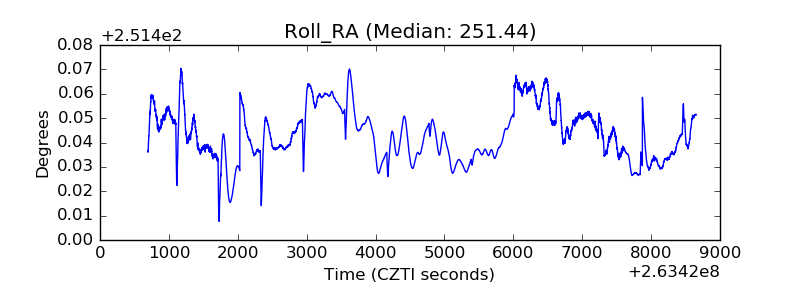 |
| Veto Counter | 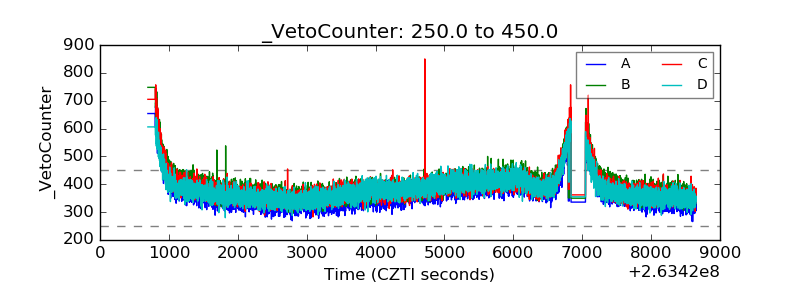 |