| Param | Original file | Final file |
|---|---|---|
| Filename | modeM0/AS1G08_022T01_9000002078_14106cztM0_level2.evt | modeM0/AS1G08_022T01_9000002078_14106cztM0_level2_quad_clean.evt |
| Size (bytes) | 1,631,888,640 | 304,248,960 |
| Size | 1.5 GB | 290.2 MB |
| Events in quadrant A | 11,237,350 | 1,981,374 |
| Events in quadrant B | 13,699,451 | 1,928,927 |
| Events in quadrant C | 11,063,200 | 1,882,820 |
| Events in quadrant D | 11,854,586 | 1,825,331 |
| Mode SS | |||
|---|---|---|---|
| Quadrant | BADHDUFLAG | Total packets | Discarded packets |
| A | 0 | 474 | 0 |
| B | 0 | 474 | 0 |
| C | 0 | 474 | 0 |
| D | 0 | 474 | 0 |
| Mode M9 | |||
|---|---|---|---|
| Quadrant | BADHDUFLAG | Total packets | Discarded packets |
| A | 0 | 14 | 0 |
| B | 0 | 14 | 0 |
| C | 0 | 14 | 0 |
| D | 0 | 14 | 0 |
| Mode M0 | |||
|---|---|---|---|
| Quadrant | BADHDUFLAG | Total packets | Discarded packets |
| A | 0 | 48694 | 4 |
| B | 0 | 56152 | 4 |
| C | 0 | 47573 | 4 |
| D | 0 | 51479 | 4 |
| Quadrant | Total seconds | Saturated seconds | Saturation percentage |
|---|---|---|---|
| A | 23194 | 163 | 0.702768% |
| B | 23194 | 677 | 2.918858% |
| C | 23194 | 87 | 0.375097% |
| D | 23194 | 280 | 1.207209% |
Noise dominated data is calculated using 1-second bins in cleaned event files. If a bin has >2000 counts, and if more than 50% of those come from <1% of pixels, then it is considered to be noise-dominated and hence unusable.
| Quadrant | # 1 sec bins | Bins with >0 counts | Bins with >2000 counts | High rate bins dominated by noise | Noise dominated (total time) | Noise dominated (detector-on time) | Marked lightcurve |
|---|---|---|---|---|---|---|---|
| A | 24680 | 23201 | 26 | 26 | 0.11% | 0.11% | 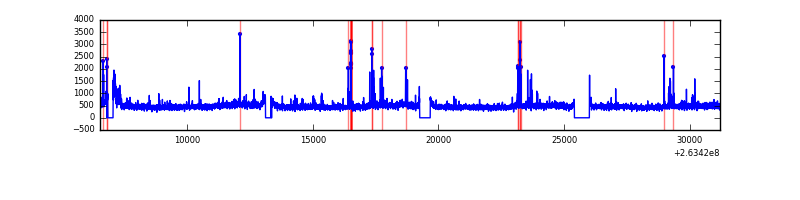 |
| B | 24680 | 23201 | 240 | 240 | 0.97% | 1.03% | 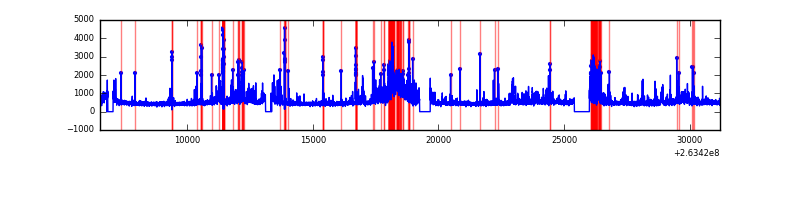 |
| C | 24680 | 23201 | 9 | 9 | 0.04% | 0.04% | 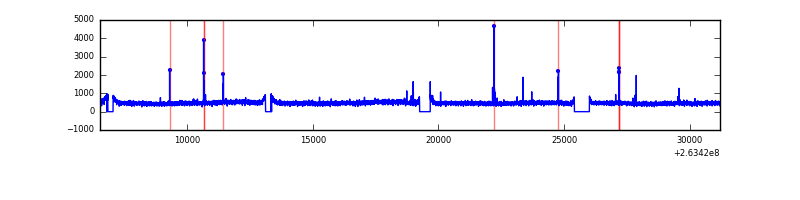 |
| D | 24680 | 23201 | 157 | 157 | 0.64% | 0.68% | 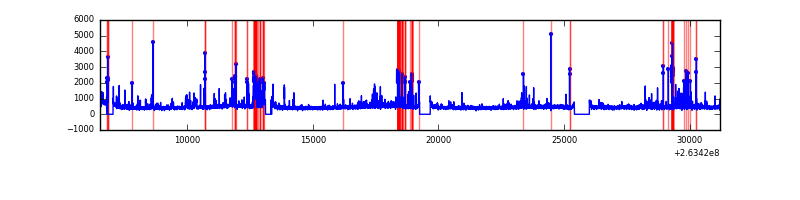 |
Top three noisy pixels from each quadrant. If the there are fewer than three noisy pixels in the level2.evt file, extra rows are filled as -1
| Pixel properties | Quadrant properties | ||||||
|---|---|---|---|---|---|---|---|
| Quadrant | DetID | PixID | Counts | Sigma | Mean | Median | Sigma |
| A | 9 | 143 | 311137 | 556.82 | 2756 | 2688 | 553.9 |
| A | 15 | 222 | 140804 | 249.33 | 2756 | 2688 | 553.9 |
| A | 12 | 189 | 108407 | 190.85 | 2756 | 2688 | 553.9 |
| B | 10 | 16 | 1235964 | 2386.68 | 2728 | 2659 | 516.7 |
| B | 0 | 189 | 727902 | 1403.48 | 2728 | 2659 | 516.7 |
| B | 10 | 245 | 453209 | 871.9 | 2728 | 2659 | 516.7 |
| C | 3 | 233 | 552485 | 891.84 | 2668 | 2679 | 616.5 |
| C | 14 | 234 | 50008 | 76.77 | 2668 | 2679 | 616.5 |
| C | 0 | 207 | 29574 | 43.63 | 2668 | 2679 | 616.5 |
| D | 12 | 110 | 851709 | 1360.2 | 2644 | 2580 | 624.3 |
| D | 1 | 52 | 377660 | 600.83 | 2644 | 2580 | 624.3 |
| D | 2 | 152 | 119099 | 186.65 | 2644 | 2580 | 624.3 |
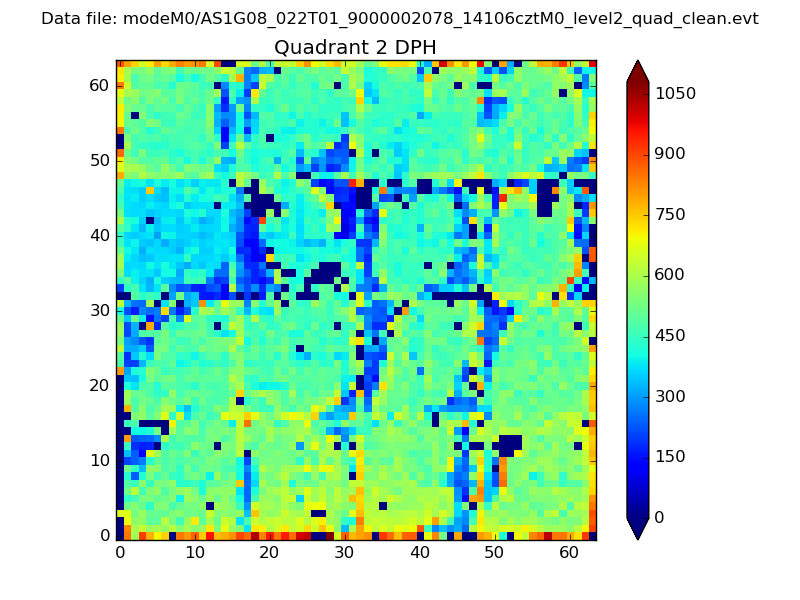
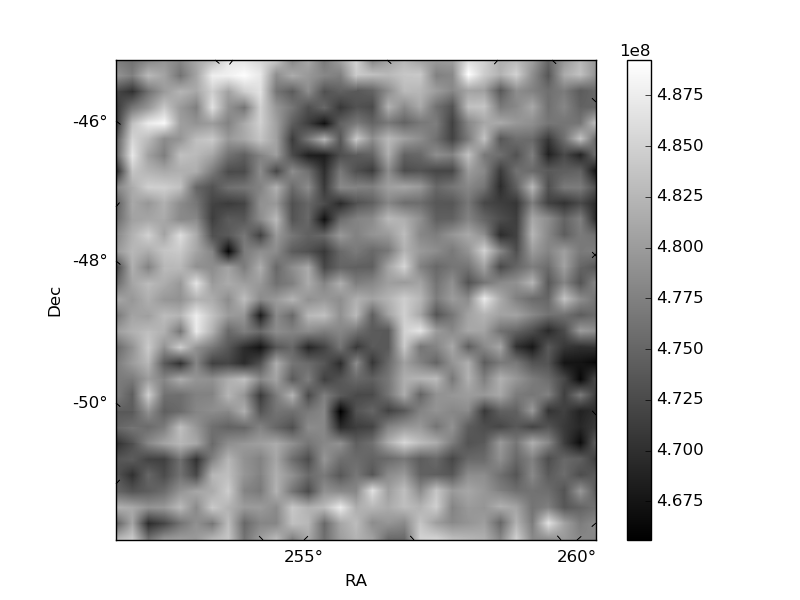
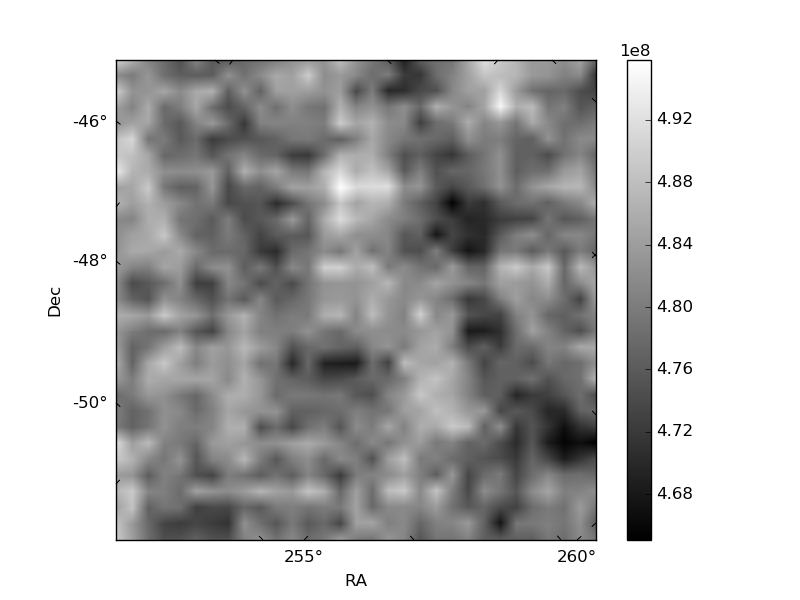
Histogram calculated using DETX and DETY for each event in the final _common_clean file
| Quadrant A |  |
 |
Quadrant B |
|---|---|---|---|
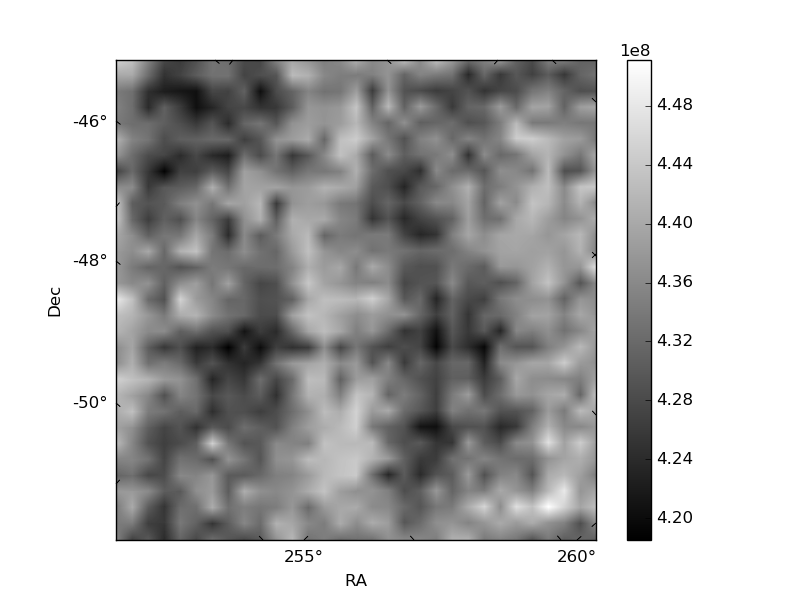
| Quadrant D | 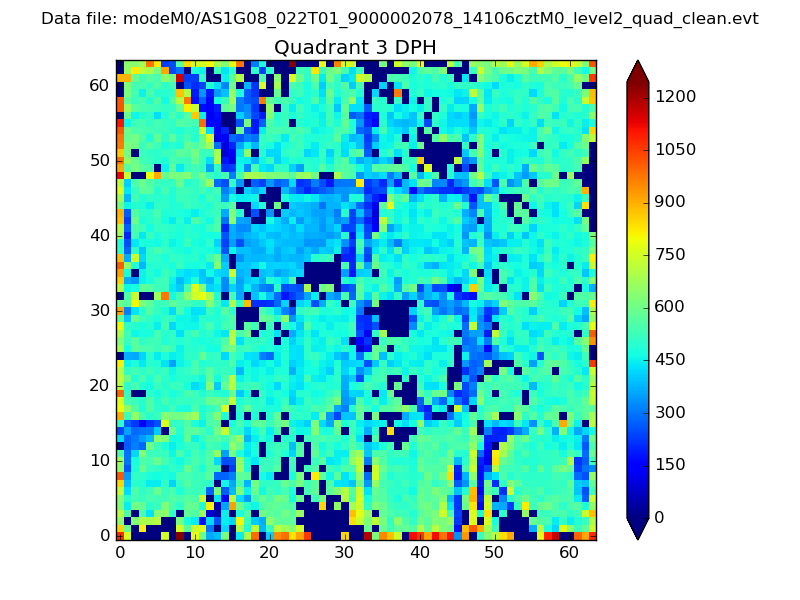 |
 |
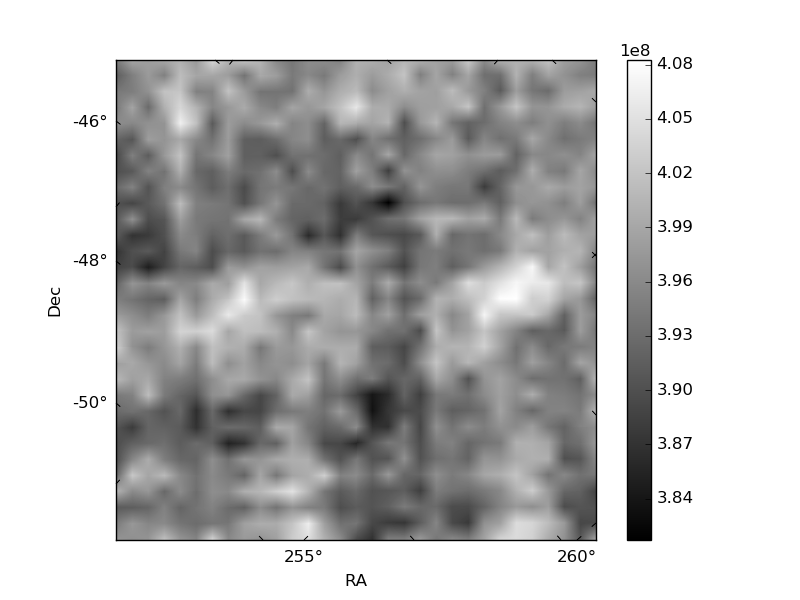
Quadrant C |
| Plot type | Count rate plots | Images |
|---|---|---|
| Comparison with Poisson distribution Blue bars denote a histogram of data divided into 1 sec bins. Red curve is a Poisson curve with rate = median count rate of data. |
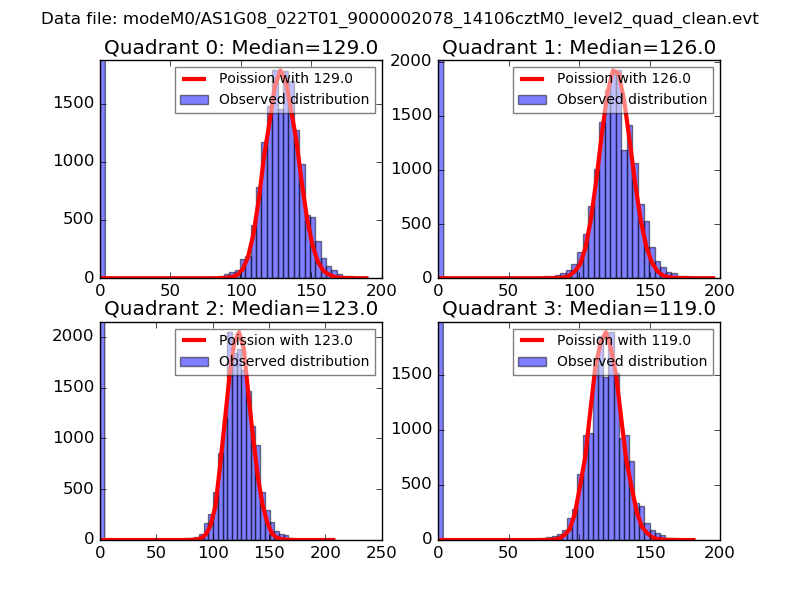 |
 |
| Quadrant-wise count rates Data is divided into 100 sec bins |
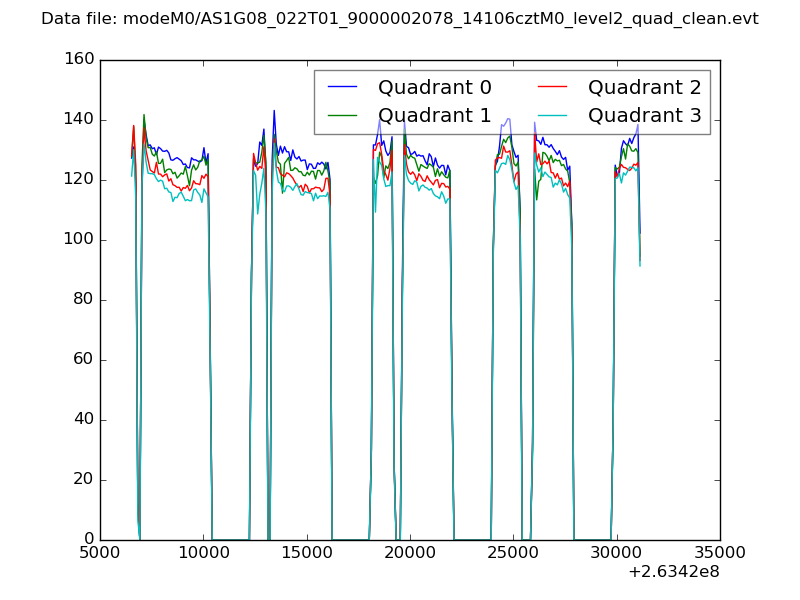 |
|
| Module-wise count rates for Quadrant A Data is divided into 100 sec bins |
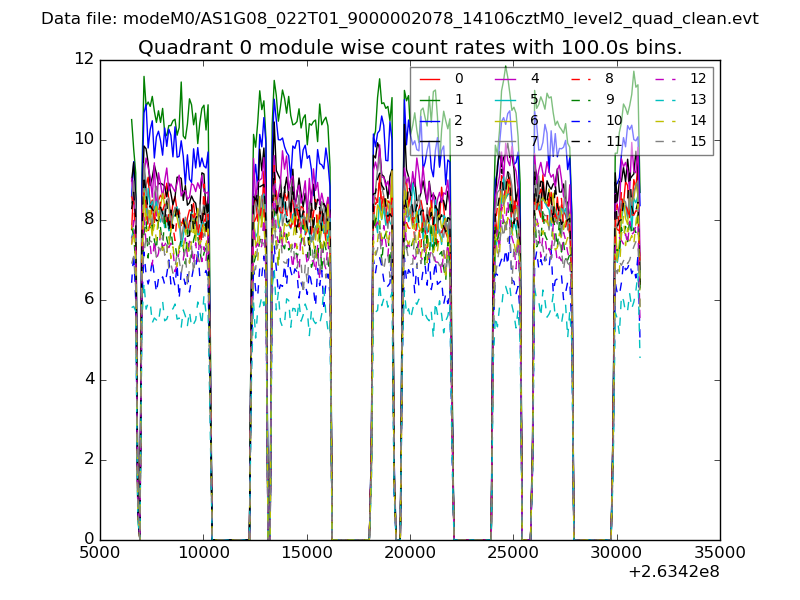 |
 |
| Module-wise count rates for Quadrant B Data is divided into 100 sec bins |
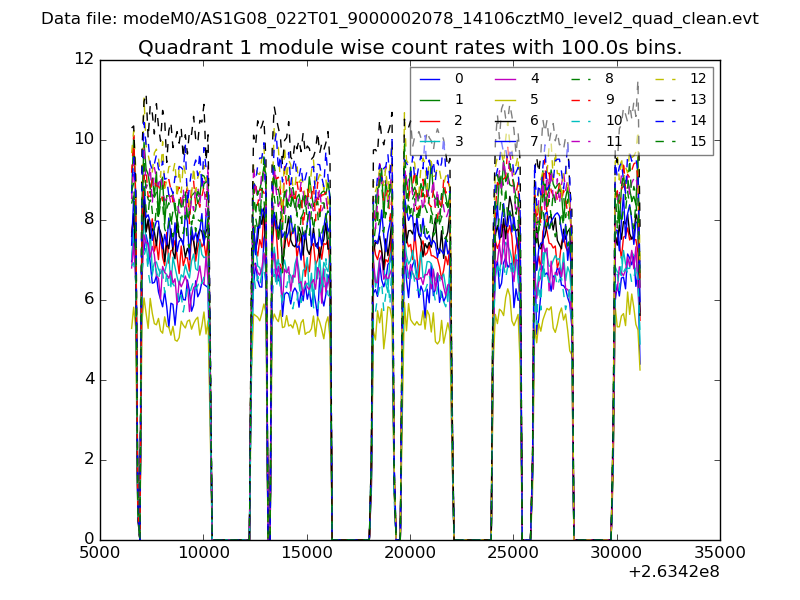 |
 |
| Module-wise count rates for Quadrant C Data is divided into 100 sec bins |
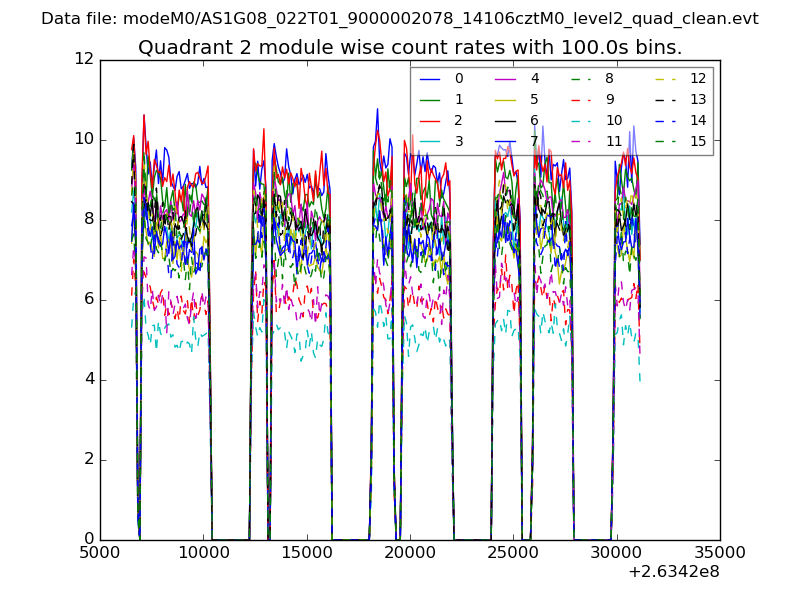 |
 |
| Module-wise count rates for Quadrant D Data is divided into 100 sec bins |
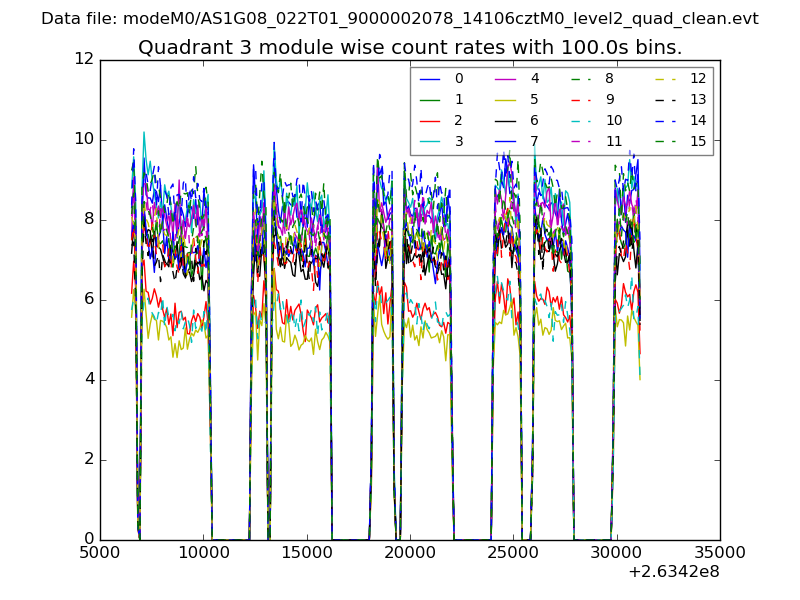 |
 |
| Parameter | Plot |
|---|---|
| CZT HV Monitor | 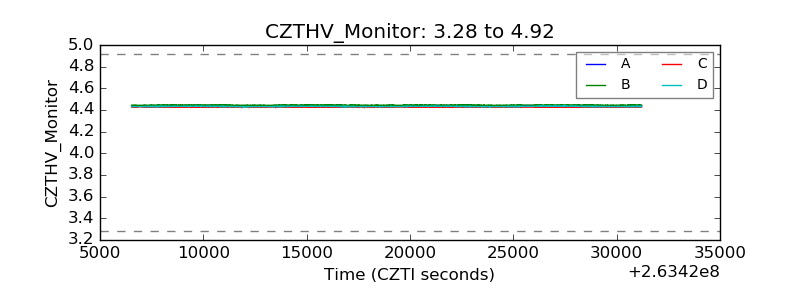 |
| D_VDD | 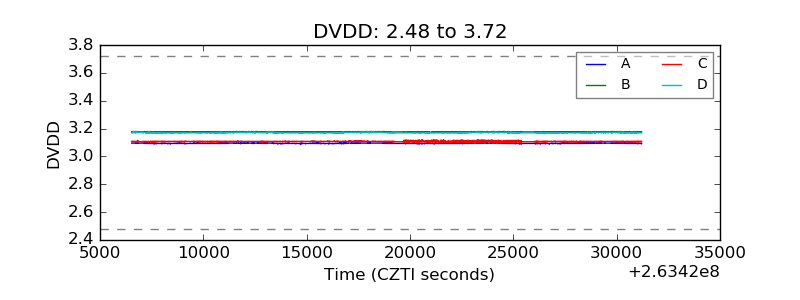 |
| Temperature 1 | 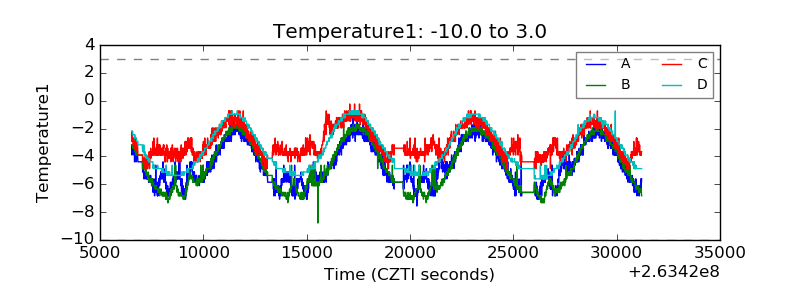 |
| Veto HV Monitor |  |
| Veto LLD | 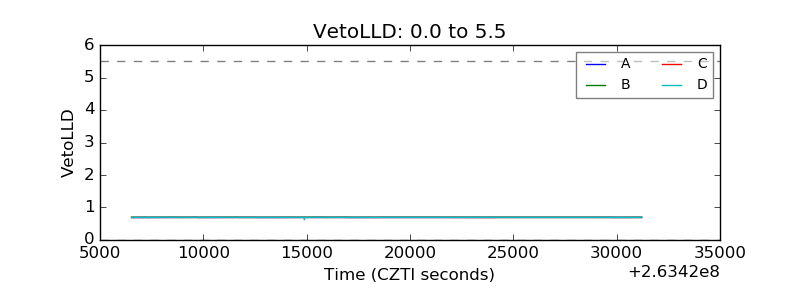 |
| Alpha Counter | 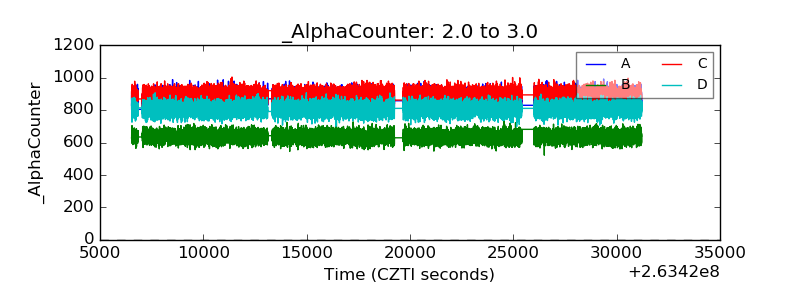 |
| _CPM_Rate | 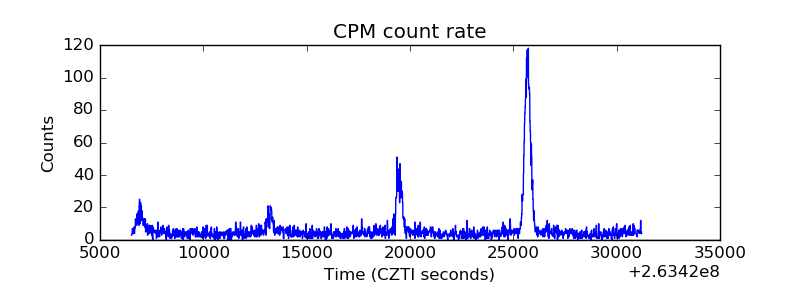 |
| CZT Counter | 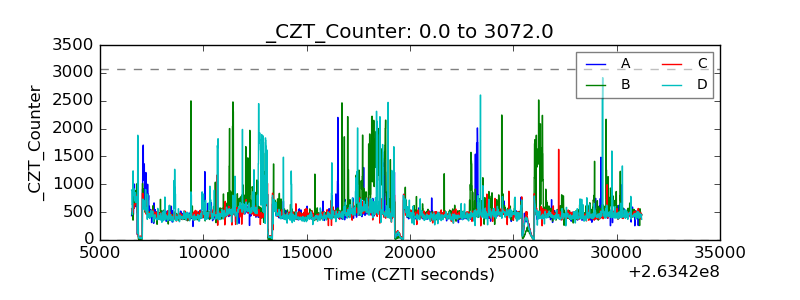 |
| +2.5 Volts monitor | 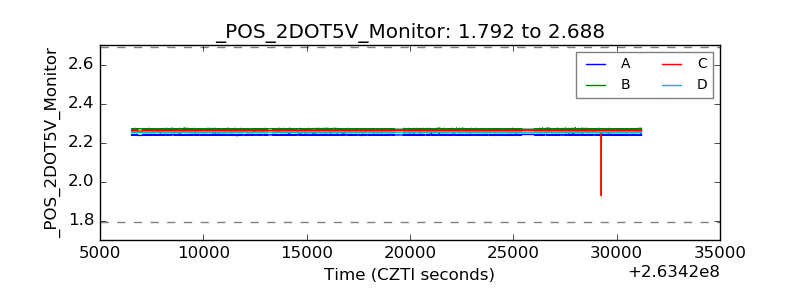 |
| +5 Volts monitor |  |
| _ROLL_ROT | 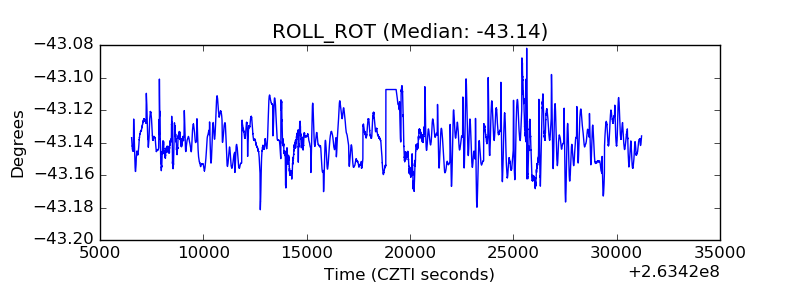 |
| _Roll_DEC | 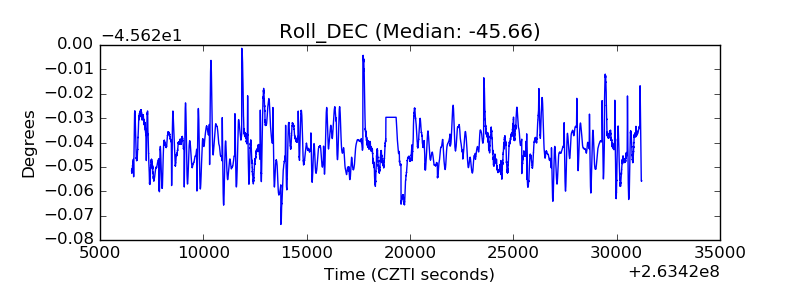 |
| _Roll_RA | 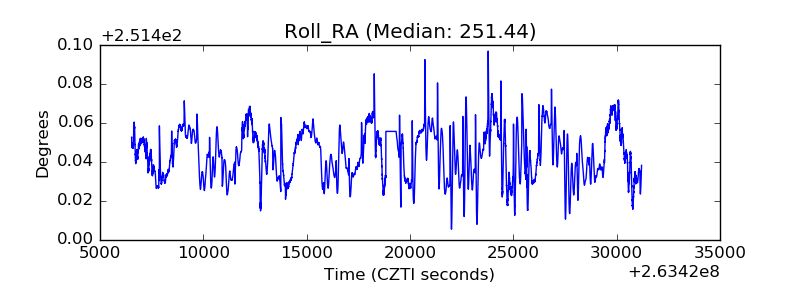 |
| Veto Counter | 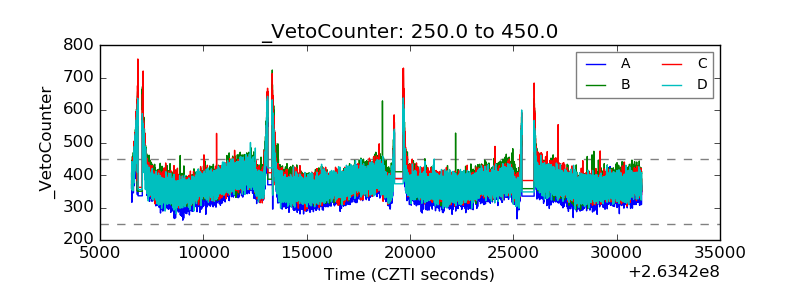 |