| Param | Original file | Final file |
|---|---|---|
| Filename | modeM0/AS1A04_149T01_9000002082cztM0_level2.fits | modeM0/AS1A04_149T01_9000002082cztM0_level2_quad_clean.evt |
| Size (bytes) | 623,105,280 | 751,193,280 |
| Size | 594.2 MB | 716.4 MB |
| Events in quadrant A | 3,857,870 | 4,900,538 |
| Events in quadrant B | 3,558,866 | 4,600,696 |
| Events in quadrant C | 3,740,848 | 4,577,809 |
| Events in quadrant D | 3,245,676 | 4,207,494 |
| Mode SS | |||
|---|---|---|---|
| Quadrant | BADHDUFLAG | Total packets | Discarded packets |
| A | 0 | 1324 | 0 |
| B | 0 | 1324 | 0 |
| C | 0 | 1324 | 0 |
| D | 0 | 1324 | 0 |
| Mode M0 | |||
|---|---|---|---|
| Quadrant | BADHDUFLAG | Total packets | Discarded packets |
| A | 0 | 135866 | 0 |
| B | 0 | 173691 | 0 |
| C | 0 | 136347 | 0 |
| D | 0 | 154484 | 0 |
| Mode M9 | |||
|---|---|---|---|
| Quadrant | BADHDUFLAG | Total packets | Discarded packets |
| A | 0 | 97 | 0 |
| B | 0 | 97 | 0 |
| C | 0 | 97 | 0 |
| D | 0 | 97 | 0 |
| Quadrant | Total seconds | Saturated seconds | Saturation percentage |
|---|---|---|---|
| A | 65120 | 657 | 1.008907% |
| B | 65120 | 5129 | 7.876229% |
| C | 65120 | 549 | 0.843059% |
| D | 65120 | 1304 | 2.002457% |
Noise dominated data is calculated using 1-second bins in cleaned event files. If a bin has >2000 counts, and if more than 50% of those come from <1% of pixels, then it is considered to be noise-dominated and hence unusable.
| Quadrant | # 1 sec bins | Bins with >0 counts | Bins with >2000 counts | High rate bins dominated by noise | Noise dominated (total time) | Noise dominated (detector-on time) | Marked lightcurve |
|---|---|---|---|---|---|---|---|
| A | 74750 | 65118 | 0 | 0 | 0.00% | 0.00% |  |
| B | 74750 | 65006 | 0 | 0 | 0.00% | 0.00% |  |
| C | 74750 | 65119 | 0 | 0 | 0.00% | 0.00% |  |
| D | 74750 | 65108 | 0 | 0 | 0.00% | 0.00% |  |
Top three noisy pixels from each quadrant. If the there are fewer than three noisy pixels in the level2.evt file, extra rows are filled as -1
| Pixel properties | Quadrant properties | ||||||
|---|---|---|---|---|---|---|---|
| Quadrant | DetID | PixID | Counts | Sigma | Mean | Median | Sigma |
| A | 0 | 29 | 3668 | 10.9 | 1004 | 944 | 249.9 |
| A | 7 | 110 | 3100 | 8.63 | 1004 | 944 | 249.9 |
| A | 9 | 19 | 2951 | 8.03 | 1004 | 944 | 249.9 |
| B | 2 | 9 | 2973 | 11.51 | 938 | 900 | 180.1 |
| B | 14 | 254 | 2471 | 8.72 | 938 | 900 | 180.1 |
| B | 5 | 128 | 2417 | 8.42 | 938 | 900 | 180.1 |
| C | 1 | 80 | 2785 | 7.46 | 986 | 923 | 249.7 |
| C | 1 | 81 | 2785 | 7.46 | 986 | 923 | 249.7 |
| C | 12 | 241 | 2739 | 7.27 | 986 | 923 | 249.7 |
| D | 6 | 231 | 2383 | 6.33 | 925 | 847 | 242.5 |
| D | 3 | 14 | 2376 | 6.31 | 925 | 847 | 242.5 |
| D | 10 | 189 | 2278 | 5.9 | 925 | 847 | 242.5 |
Histogram calculated using DETX and DETY for each event in the final _common_clean file
| Quadrant A | 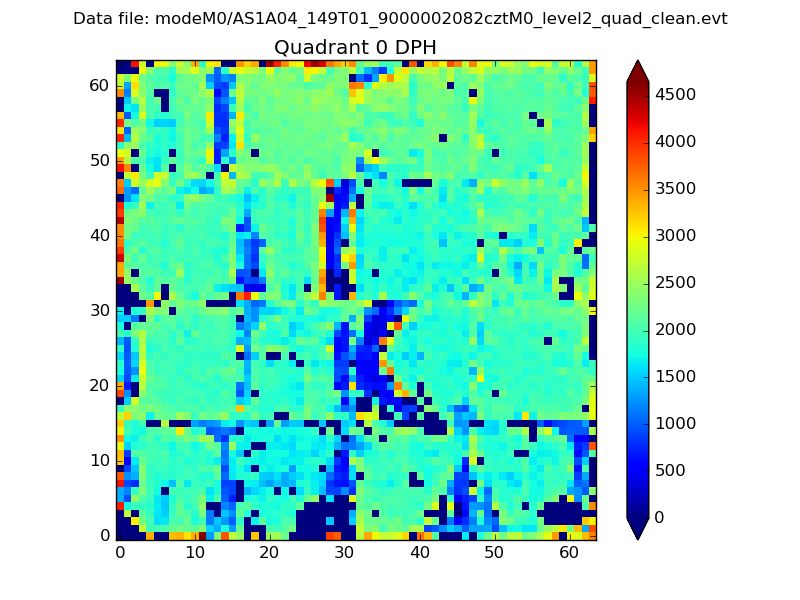 |
 |
Quadrant B |
|---|---|---|---|
| Quadrant D | 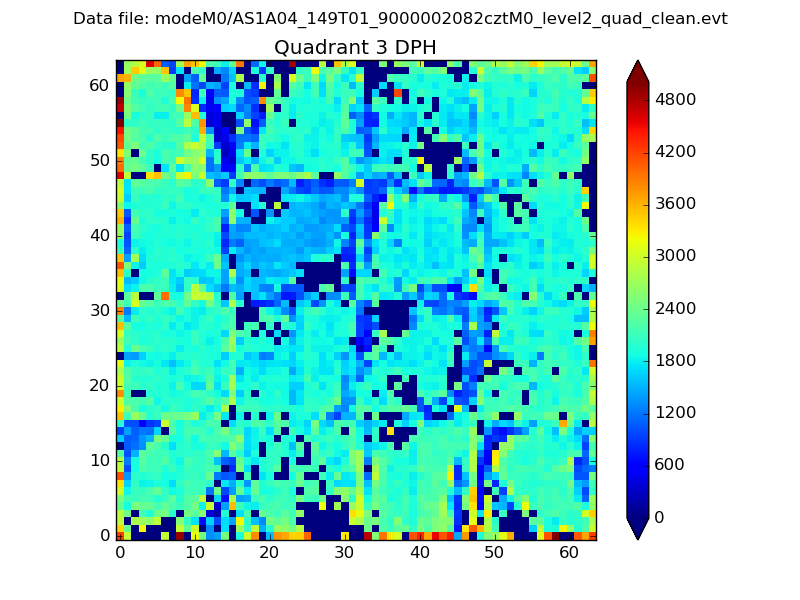 |
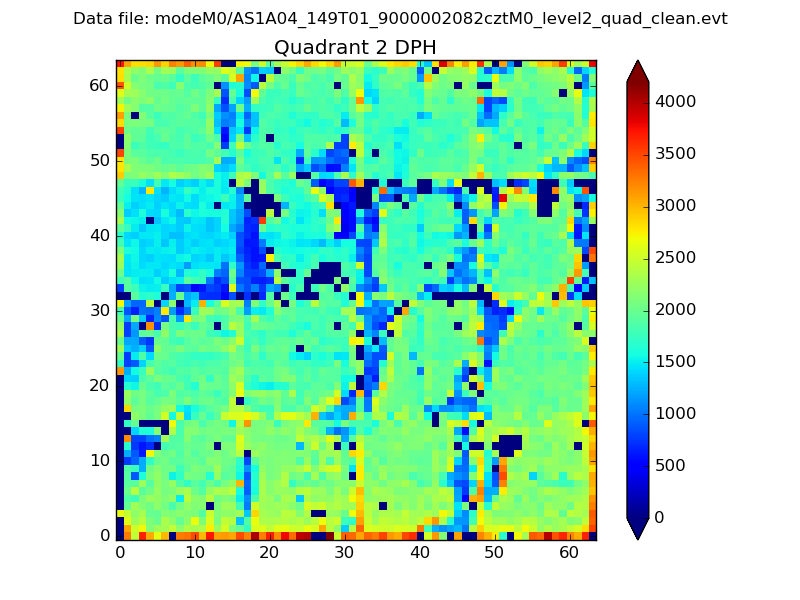 |
Quadrant C |
| Plot type | Count rate plots | Images |
|---|---|---|
| Comparison with Poisson distribution Blue bars denote a histogram of data divided into 1 sec bins. Red curve is a Poisson curve with rate = median count rate of data. |
 |
 |
| Quadrant-wise count rates Data is divided into 100 sec bins |
 |
|
| Module-wise count rates for Quadrant A Data is divided into 100 sec bins |
 |
 |
| Module-wise count rates for Quadrant B Data is divided into 100 sec bins |
 |
 |
| Module-wise count rates for Quadrant C Data is divided into 100 sec bins |
 |
 |
| Module-wise count rates for Quadrant D Data is divided into 100 sec bins |
 |
 |
| Parameter | Plot |
|---|---|
| CZT HV Monitor |  |
| D_VDD | 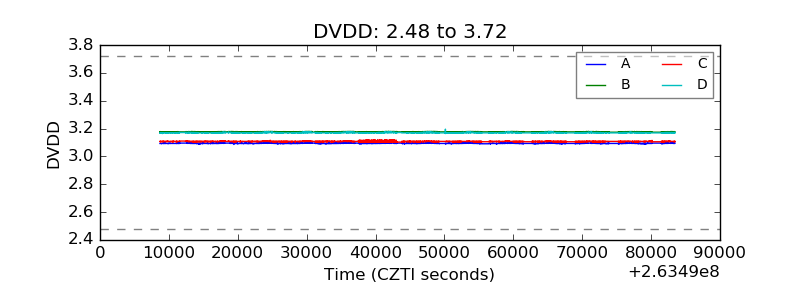 |
| Temperature 1 |  |
| Veto HV Monitor |  |
| Veto LLD |  |
| Alpha Counter |  |
| _CPM_Rate |  |
| CZT Counter |  |
| +2.5 Volts monitor |  |
| +5 Volts monitor |  |
| _ROLL_ROT |  |
| _Roll_DEC |  |
| _Roll_RA |  |
| Veto Counter |  |