| Param | Original file | Final file |
|---|---|---|
| Filename | modeM0/AS1A04_149T01_9000002082_14118cztM0_level2.evt | modeM0/AS1A04_149T01_9000002082_14118cztM0_level2_quad_clean.evt |
| Size (bytes) | 557,147,520 | 138,735,360 |
| Size | 531.3 MB | 132.3 MB |
| Events in quadrant A | 3,759,872 | 929,889 |
| Events in quadrant B | 4,163,689 | 935,798 |
| Events in quadrant C | 3,831,741 | 904,393 |
| Events in quadrant D | 4,570,119 | 870,896 |
| Mode SS | |||
|---|---|---|---|
| Quadrant | BADHDUFLAG | Total packets | Discarded packets |
| A | 0 | 166 | 0 |
| B | 0 | 166 | 0 |
| C | 0 | 166 | 0 |
| D | 0 | 166 | 0 |
| Mode M0 | |||
|---|---|---|---|
| Quadrant | BADHDUFLAG | Total packets | Discarded packets |
| A | 0 | 16704 | 4 |
| B | 0 | 17779 | 3 |
| C | 0 | 16619 | 3 |
| D | 0 | 19019 | 3 |
| Mode M9 | |||
|---|---|---|---|
| Quadrant | BADHDUFLAG | Total packets | Discarded packets |
| A | 0 | 5 | 0 |
| B | 0 | 5 | 0 |
| C | 0 | 5 | 0 |
| D | 0 | 5 | 0 |
| Quadrant | Total seconds | Saturated seconds | Saturation percentage |
|---|---|---|---|
| A | 8070 | 70 | 0.867410% |
| B | 8070 | 179 | 2.218092% |
| C | 8070 | 72 | 0.892193% |
| D | 8070 | 232 | 2.874845% |
Noise dominated data is calculated using 1-second bins in cleaned event files. If a bin has >2000 counts, and if more than 50% of those come from <1% of pixels, then it is considered to be noise-dominated and hence unusable.
| Quadrant | # 1 sec bins | Bins with >0 counts | Bins with >2000 counts | High rate bins dominated by noise | Noise dominated (total time) | Noise dominated (detector-on time) | Marked lightcurve |
|---|---|---|---|---|---|---|---|
| A | 8576 | 8074 | 2 | 2 | 0.02% | 0.02% | 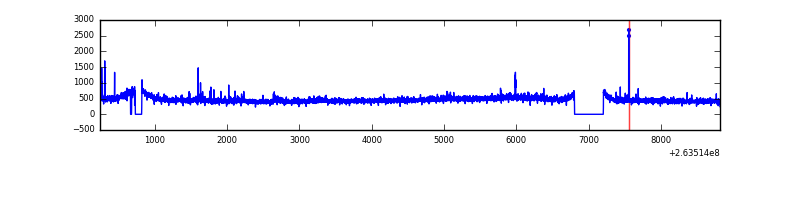 |
| B | 8576 | 8074 | 8 | 8 | 0.09% | 0.10% | 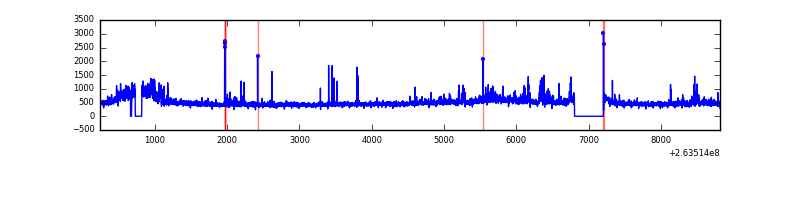 |
| C | 8576 | 8074 | 0 | 0 | 0.00% | 0.00% | 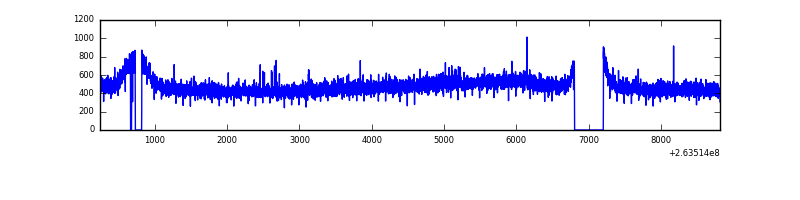 |
| D | 8576 | 8074 | 118 | 118 | 1.38% | 1.46% | 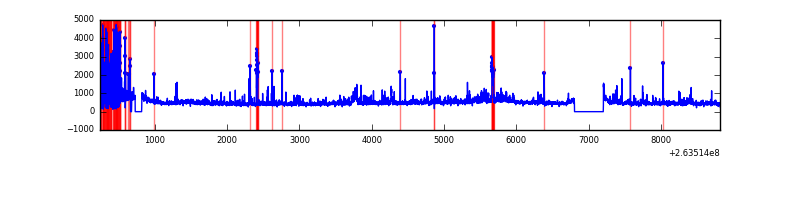 |
Top three noisy pixels from each quadrant. If the there are fewer than three noisy pixels in the level2.evt file, extra rows are filled as -1
| Pixel properties | Quadrant properties | ||||||
|---|---|---|---|---|---|---|---|
| Quadrant | DetID | PixID | Counts | Sigma | Mean | Median | Sigma |
| A | 12 | 189 | 51514 | 260.87 | 950 | 929 | 193.9 |
| A | 12 | 96 | 21596 | 106.58 | 950 | 929 | 193.9 |
| A | 11 | 47 | 16041 | 77.93 | 950 | 929 | 193.9 |
| B | 0 | 189 | 230252 | 1267.53 | 950 | 922 | 180.9 |
| B | 0 | 85 | 70234 | 383.1 | 950 | 922 | 180.9 |
| B | 3 | 209 | 38318 | 206.69 | 950 | 922 | 180.9 |
| C | 3 | 233 | 261589 | 1235.28 | 911 | 913 | 211.0 |
| C | 10 | 22 | 10758 | 46.65 | 911 | 913 | 211.0 |
| C | 13 | 61 | 6639 | 27.13 | 911 | 913 | 211.0 |
| D | 1 | 52 | 367133 | 1615.43 | 897 | 871 | 226.7 |
| D | 10 | 157 | 361841 | 1592.09 | 897 | 871 | 226.7 |
| D | 2 | 152 | 158581 | 695.6 | 897 | 871 | 226.7 |
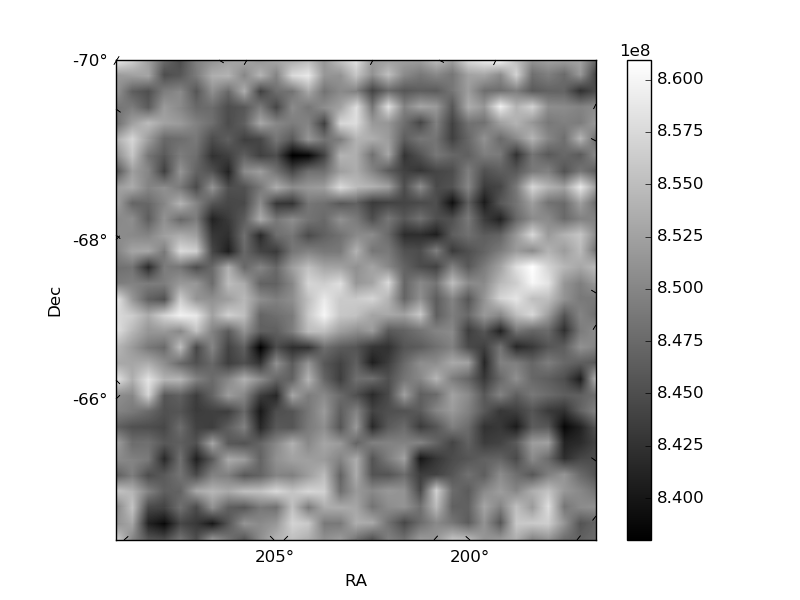
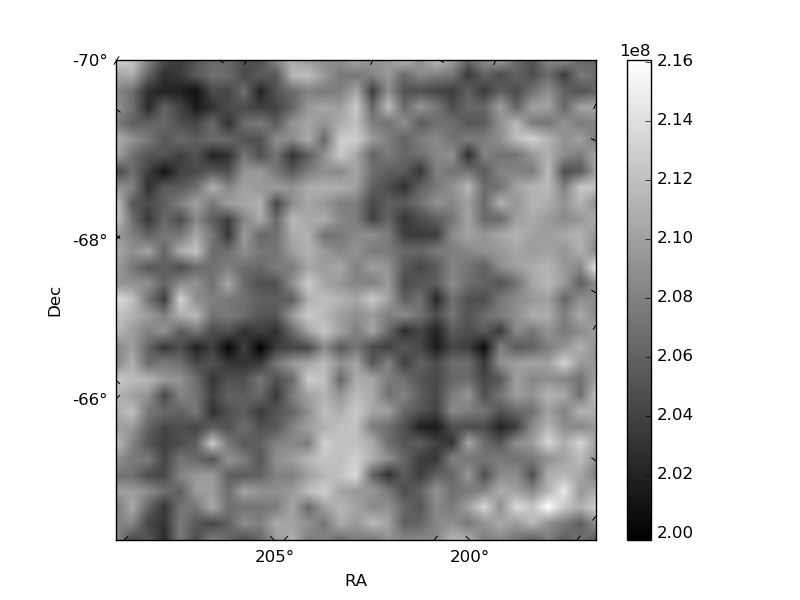
Histogram calculated using DETX and DETY for each event in the final _common_clean file
| Quadrant A | 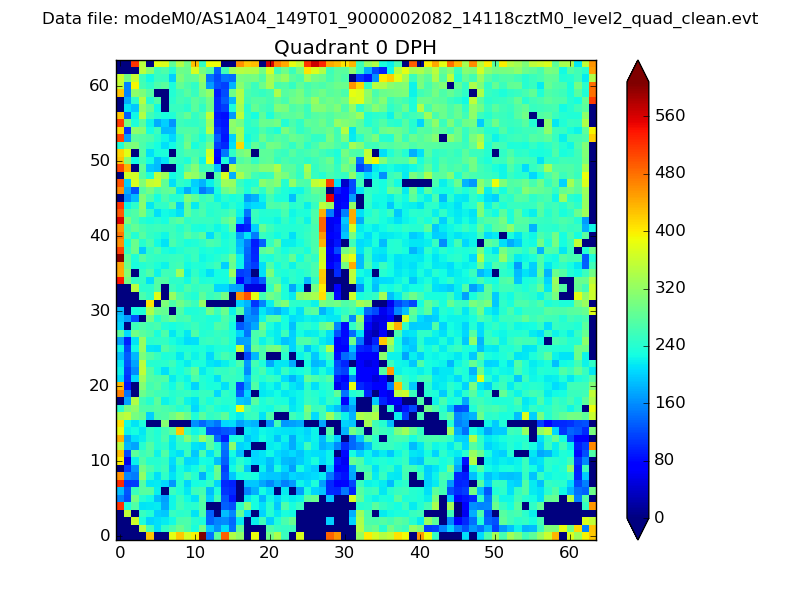 |
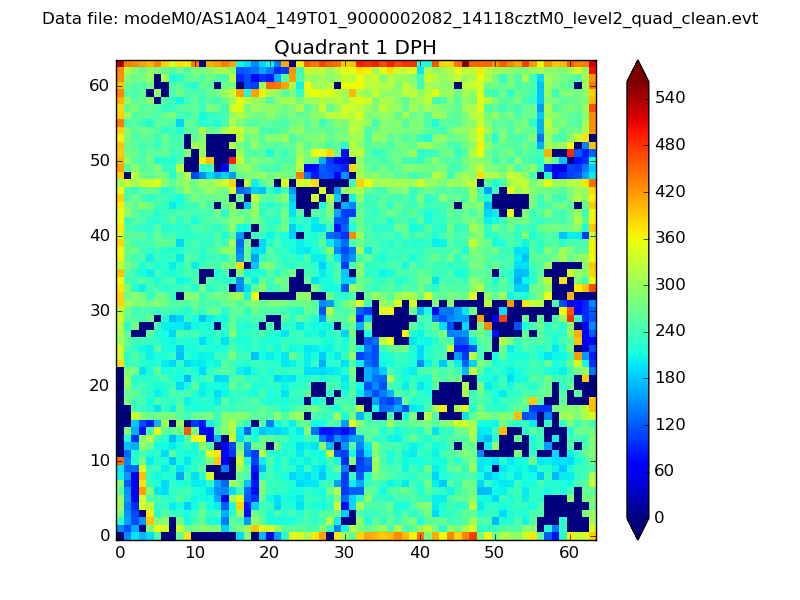 |
Quadrant B |
|---|---|---|---|
| Quadrant D | 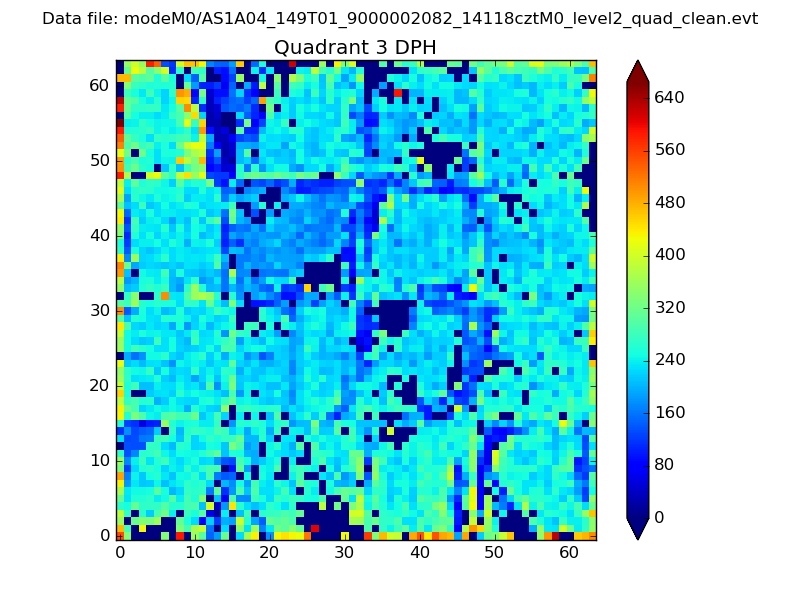 |
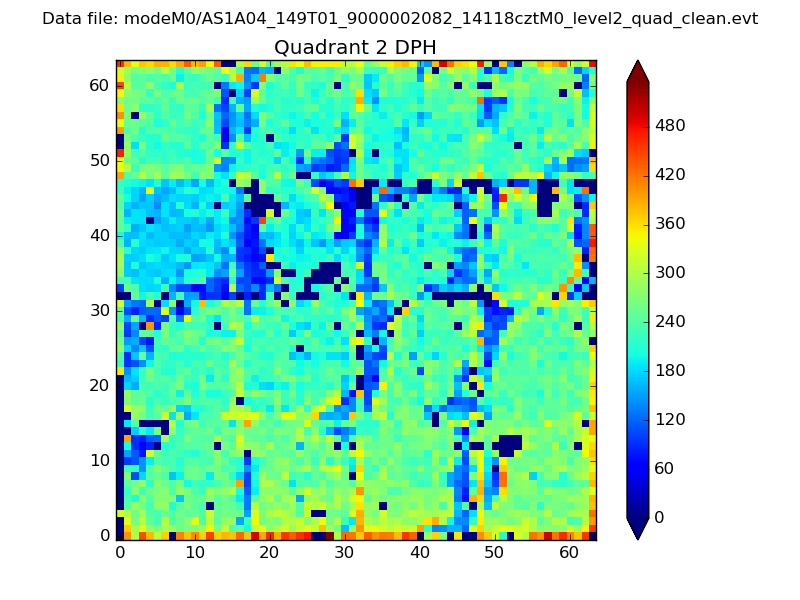 |
Quadrant C |
| Plot type | Count rate plots | Images |
|---|---|---|
| Comparison with Poisson distribution Blue bars denote a histogram of data divided into 1 sec bins. Red curve is a Poisson curve with rate = median count rate of data. |
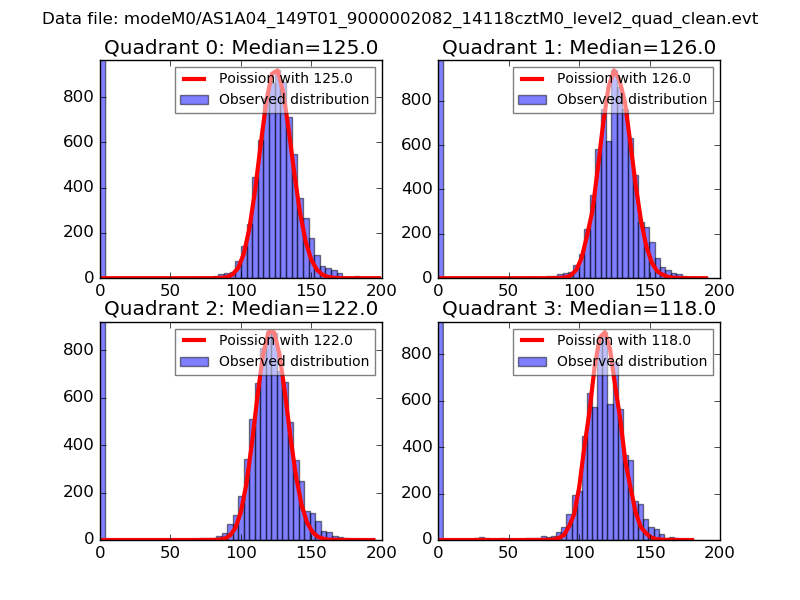 |
 |
| Quadrant-wise count rates Data is divided into 100 sec bins |
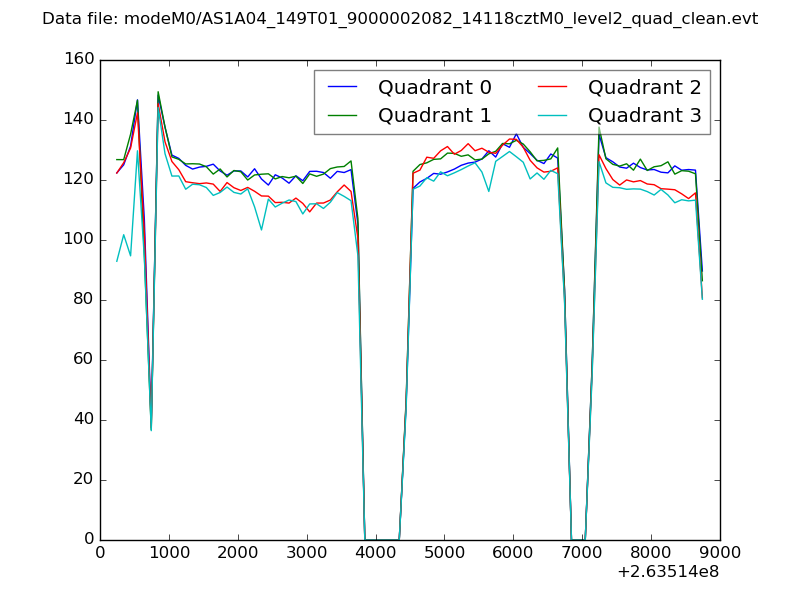 |
|
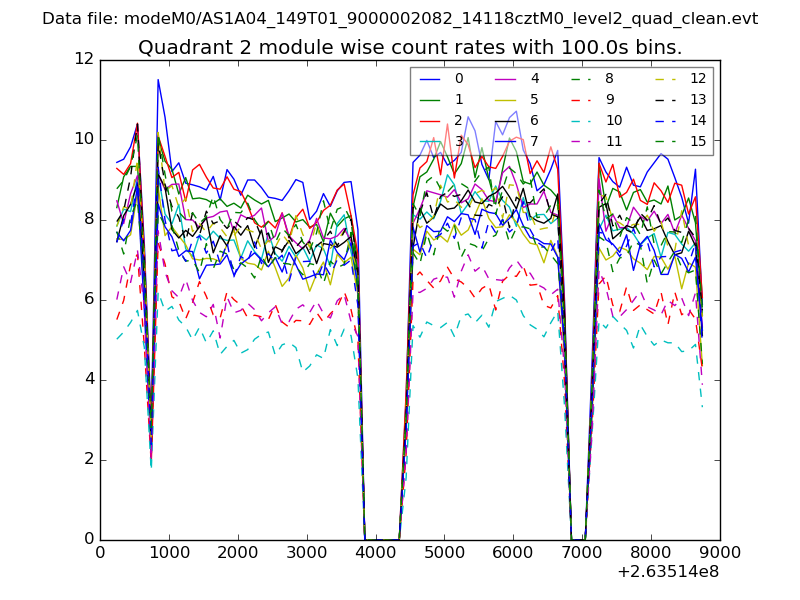
| Module-wise count rates for Quadrant A Data is divided into 100 sec bins |
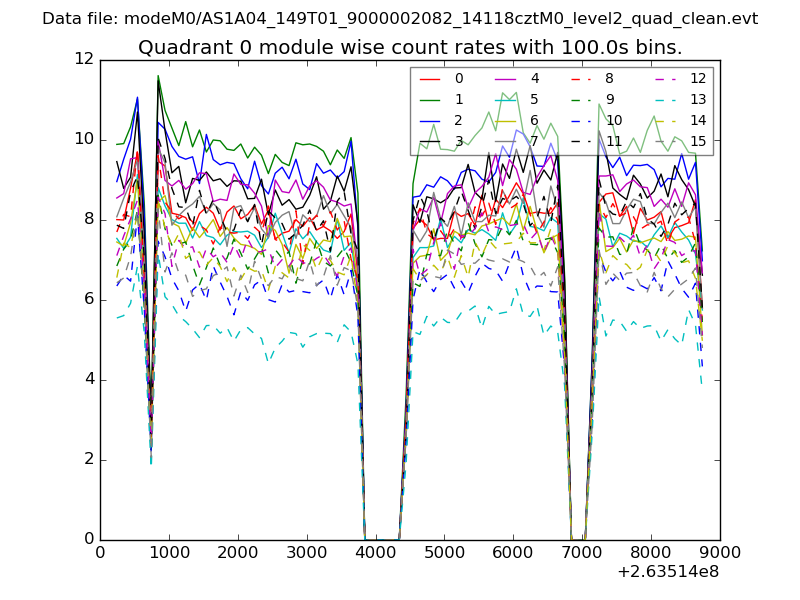 |
 |
| Module-wise count rates for Quadrant B Data is divided into 100 sec bins |
 |
 |
| Module-wise count rates for Quadrant C Data is divided into 100 sec bins |
 |
 |
| Module-wise count rates for Quadrant D Data is divided into 100 sec bins |
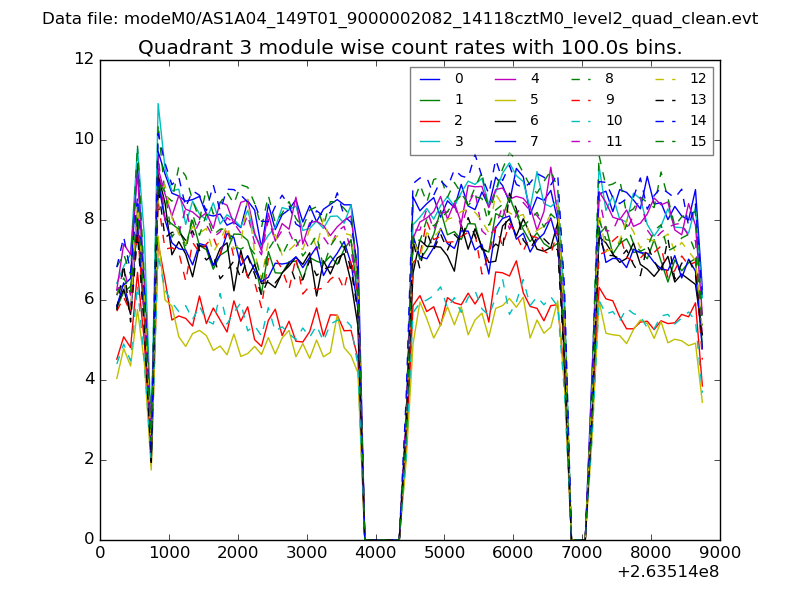 |
 |
| Parameter | Plot |
|---|---|
| CZT HV Monitor | 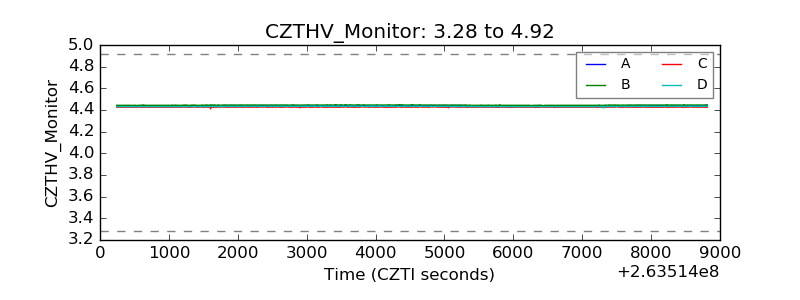 |
| D_VDD | 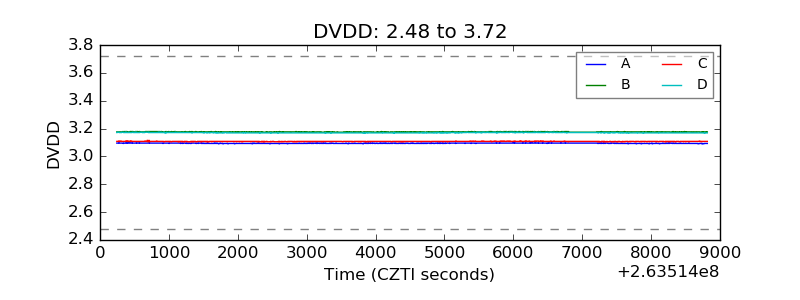 |
| Temperature 1 | 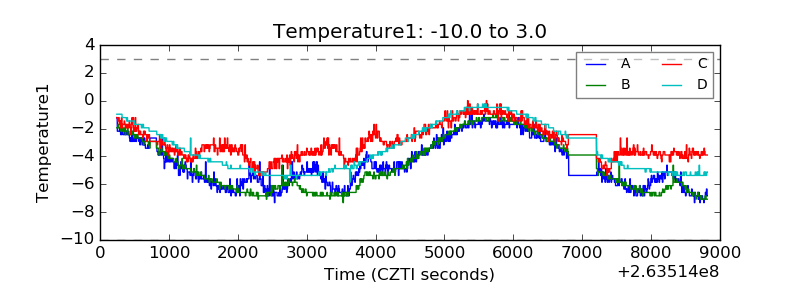 |
| Veto HV Monitor | 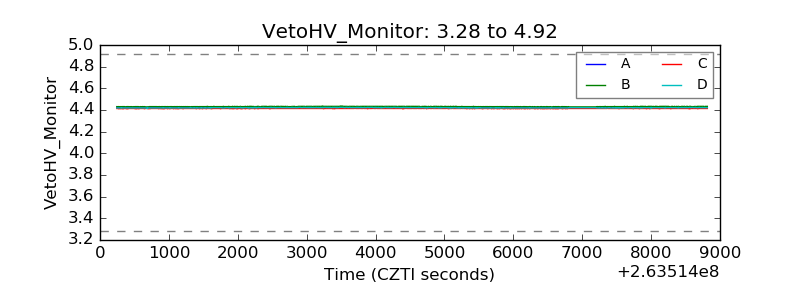 |
| Veto LLD | 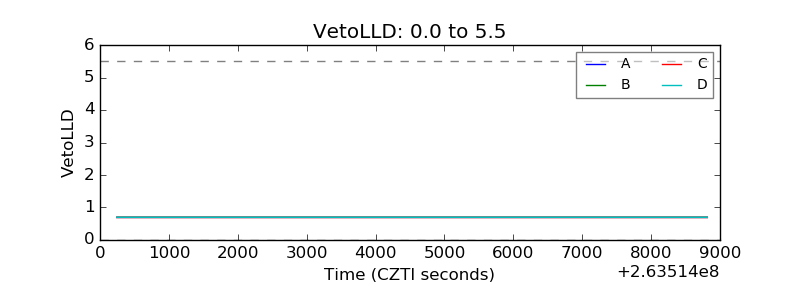 |
| Alpha Counter | 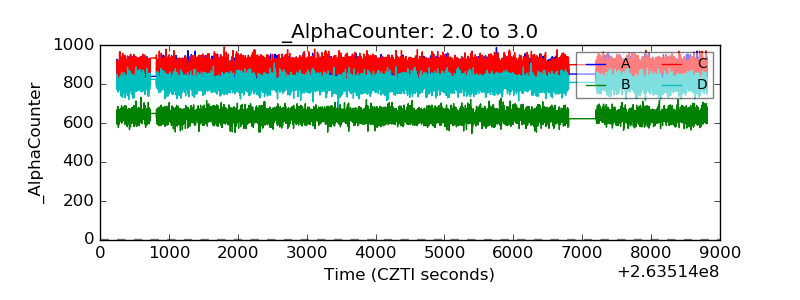 |
| _CPM_Rate | 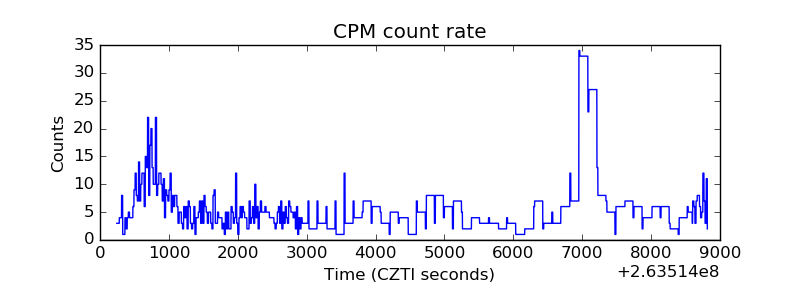 |
| CZT Counter | 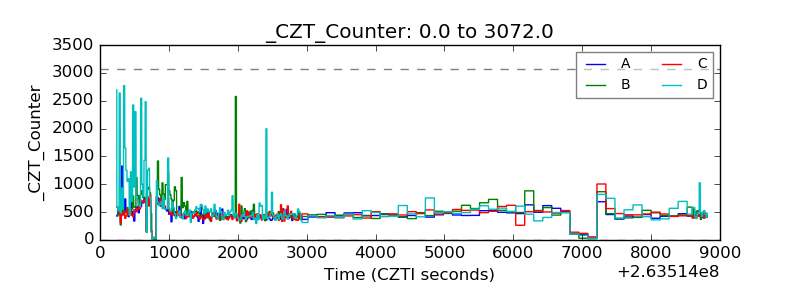 |
| +2.5 Volts monitor |  |
| +5 Volts monitor |  |
| _ROLL_ROT | 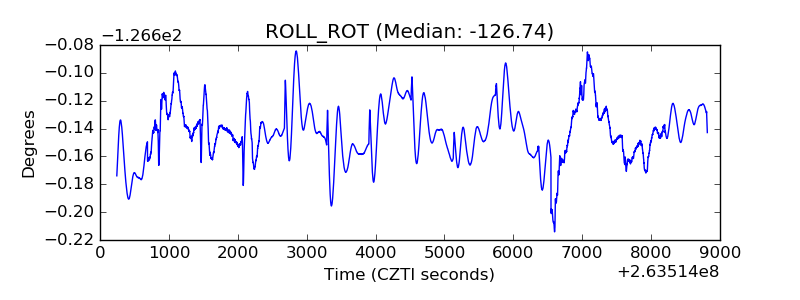 |
| _Roll_DEC | 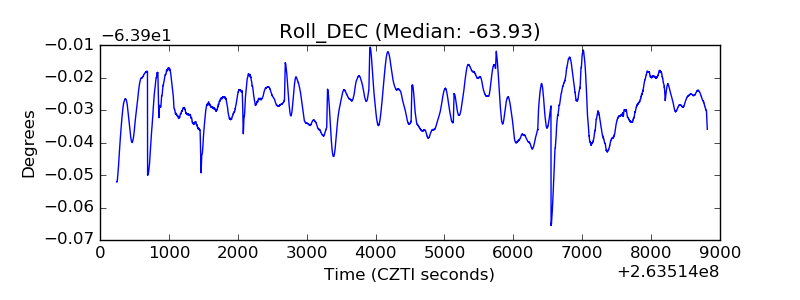 |
| _Roll_RA | 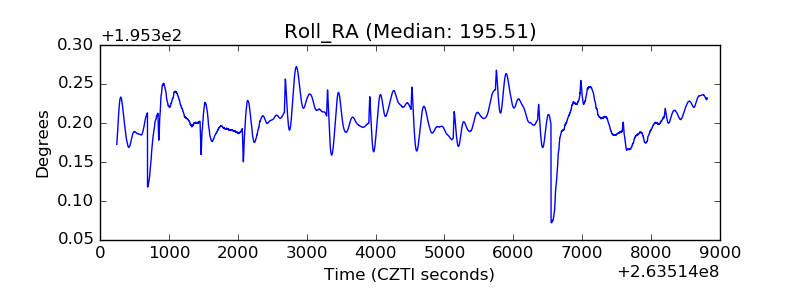 |
| Veto Counter | 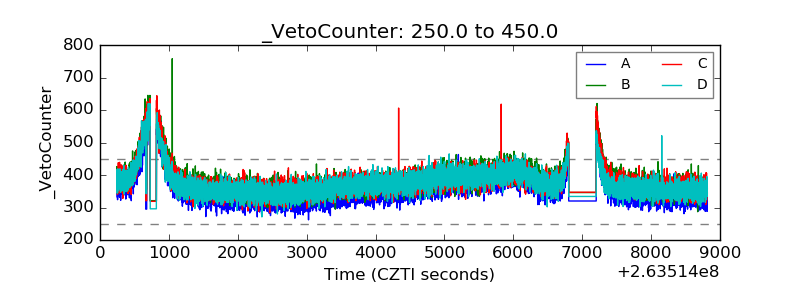 |