| Param | Original file | Final file |
|---|---|---|
| Filename | modeM0/AS1A04_149T01_9000002082_14120cztM0_level2.evt | modeM0/AS1A04_149T01_9000002082_14120cztM0_level2_quad_clean.evt |
| Size (bytes) | 864,671,040 | 219,191,040 |
| Size | 824.6 MB | 209.0 MB |
| Events in quadrant A | 6,067,113 | 1,456,957 |
| Events in quadrant B | 6,530,168 | 1,475,272 |
| Events in quadrant C | 6,206,037 | 1,422,010 |
| Events in quadrant D | 6,498,731 | 1,382,513 |
| Mode SS | |||
|---|---|---|---|
| Quadrant | BADHDUFLAG | Total packets | Discarded packets |
| A | 0 | 266 | 0 |
| B | 0 | 266 | 0 |
| C | 0 | 266 | 0 |
| D | 0 | 266 | 0 |
| Mode M0 | |||
|---|---|---|---|
| Quadrant | BADHDUFLAG | Total packets | Discarded packets |
| A | 0 | 26870 | 3 |
| B | 0 | 27787 | 2 |
| C | 0 | 26643 | 2 |
| D | 0 | 28308 | 2 |
| Mode M9 | |||
|---|---|---|---|
| Quadrant | BADHDUFLAG | Total packets | Discarded packets |
| A | 0 | 16 | 0 |
| B | 0 | 16 | 0 |
| C | 0 | 16 | 0 |
| D | 0 | 16 | 0 |
| Quadrant | Total seconds | Saturated seconds | Saturation percentage |
|---|---|---|---|
| A | 13057 | 91 | 0.696944% |
| B | 13057 | 128 | 0.980317% |
| C | 13057 | 70 | 0.536111% |
| D | 13057 | 134 | 1.026269% |
Noise dominated data is calculated using 1-second bins in cleaned event files. If a bin has >2000 counts, and if more than 50% of those come from <1% of pixels, then it is considered to be noise-dominated and hence unusable.
| Quadrant | # 1 sec bins | Bins with >0 counts | Bins with >2000 counts | High rate bins dominated by noise | Noise dominated (total time) | Noise dominated (detector-on time) | Marked lightcurve |
|---|---|---|---|---|---|---|---|
| A | 14658 | 13061 | 5 | 5 | 0.03% | 0.04% | 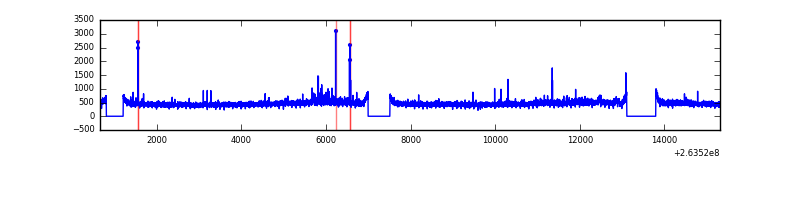 |
| B | 14658 | 13061 | 7 | 7 | 0.05% | 0.05% | 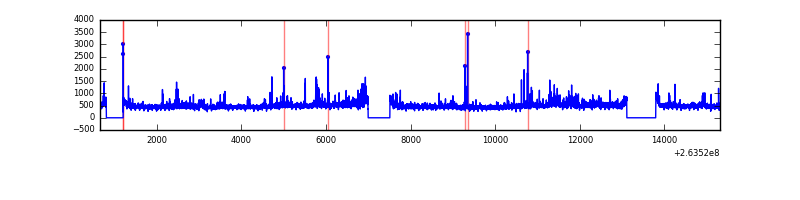 |
| C | 14658 | 13061 | 4 | 4 | 0.03% | 0.03% | 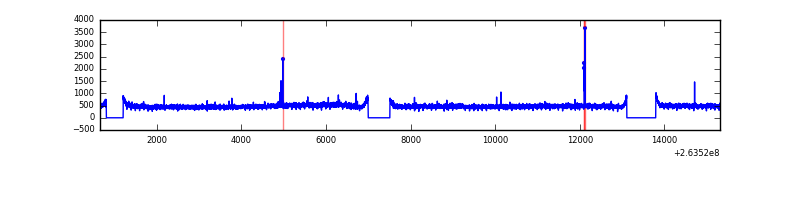 |
| D | 14658 | 13061 | 58 | 58 | 0.40% | 0.44% | 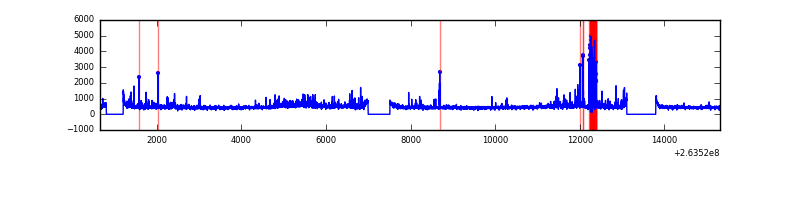 |
Top three noisy pixels from each quadrant. If the there are fewer than three noisy pixels in the level2.evt file, extra rows are filled as -1
| Pixel properties | Quadrant properties | ||||||
|---|---|---|---|---|---|---|---|
| Quadrant | DetID | PixID | Counts | Sigma | Mean | Median | Sigma |
| A | 12 | 189 | 98910 | 313.17 | 1527 | 1495 | 311.1 |
| A | 8 | 15 | 47042 | 146.42 | 1527 | 1495 | 311.1 |
| A | 12 | 96 | 29822 | 91.07 | 1527 | 1495 | 311.1 |
| B | 0 | 189 | 191836 | 657.39 | 1532 | 1492 | 289.5 |
| B | 0 | 85 | 119307 | 406.9 | 1532 | 1492 | 289.5 |
| B | 0 | 214 | 50252 | 168.4 | 1532 | 1492 | 289.5 |
| C | 3 | 233 | 393517 | 1149.23 | 1477 | 1481 | 341.1 |
| C | 0 | 207 | 24590 | 67.74 | 1477 | 1481 | 341.1 |
| C | 8 | 128 | 11876 | 30.47 | 1477 | 1481 | 341.1 |
| D | 2 | 152 | 472934 | 1322.27 | 1464 | 1422 | 356.6 |
| D | 1 | 52 | 244560 | 681.84 | 1464 | 1422 | 356.6 |
| D | 8 | 195 | 95954 | 265.1 | 1464 | 1422 | 356.6 |
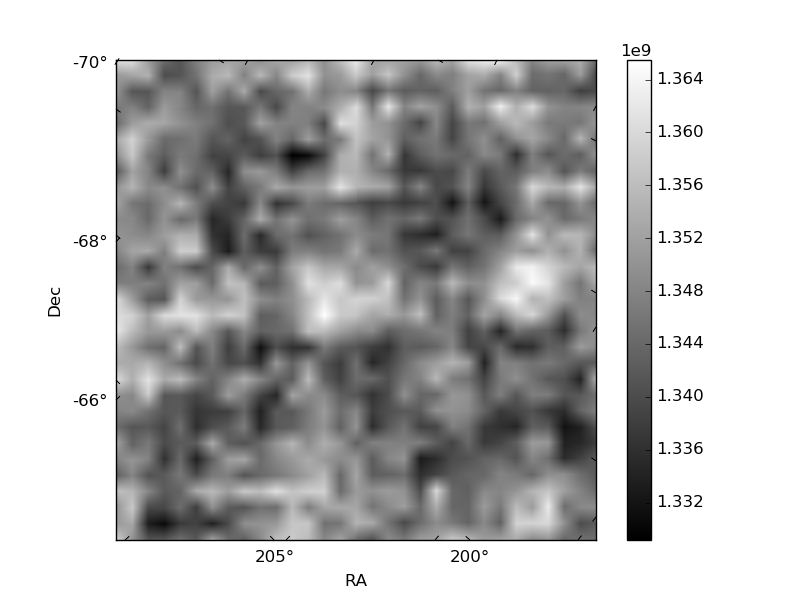
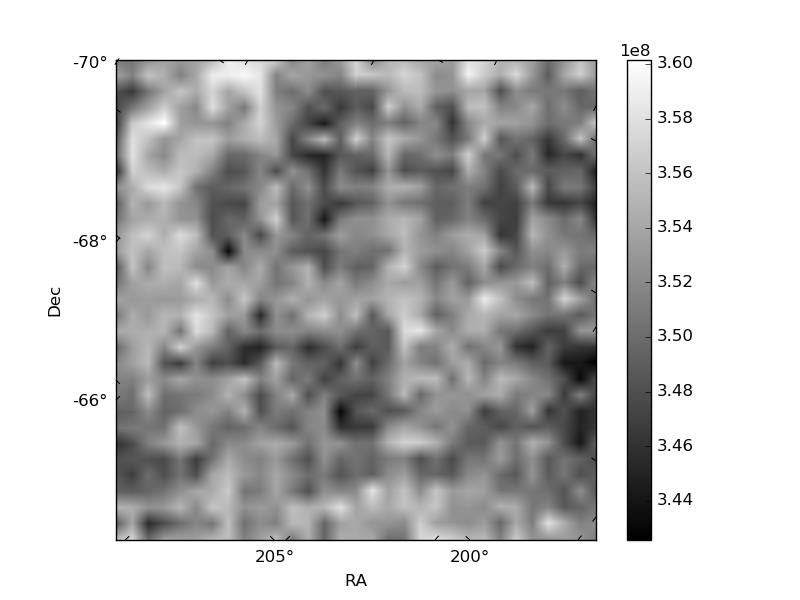
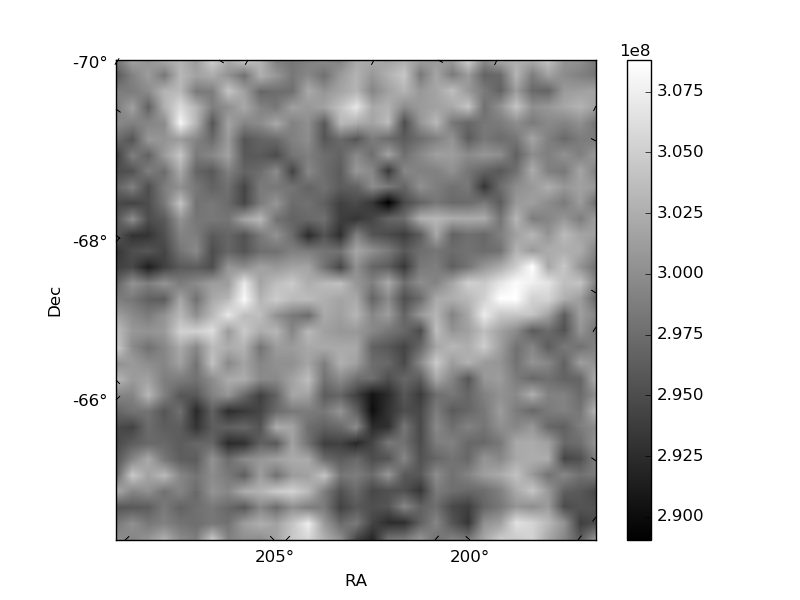
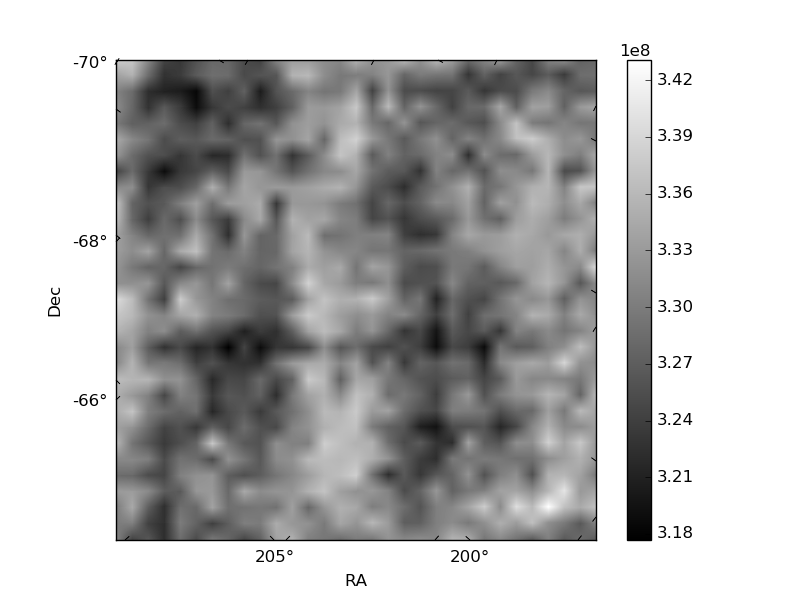
Histogram calculated using DETX and DETY for each event in the final _common_clean file
| Quadrant A | 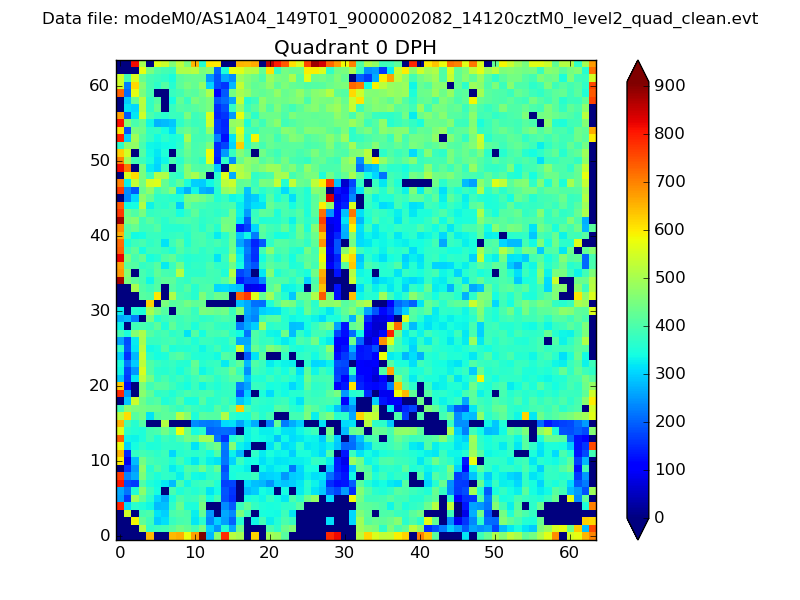 |
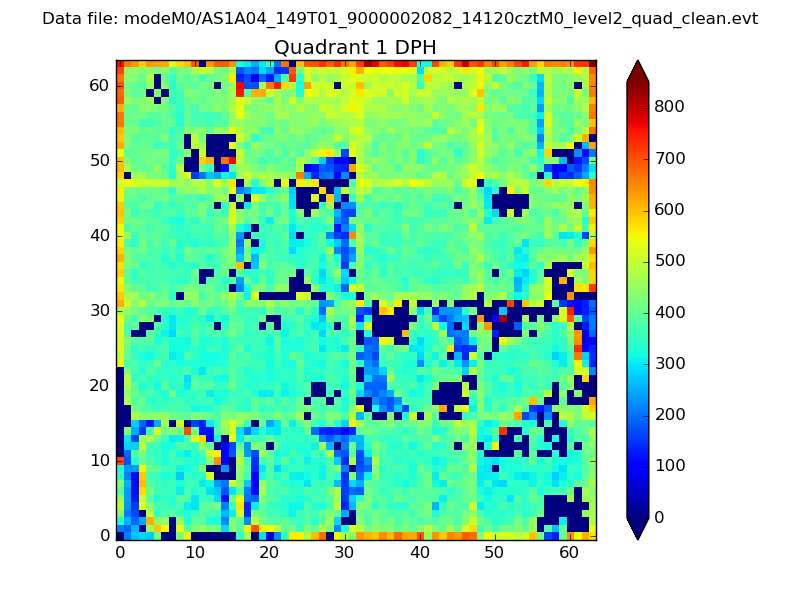 |
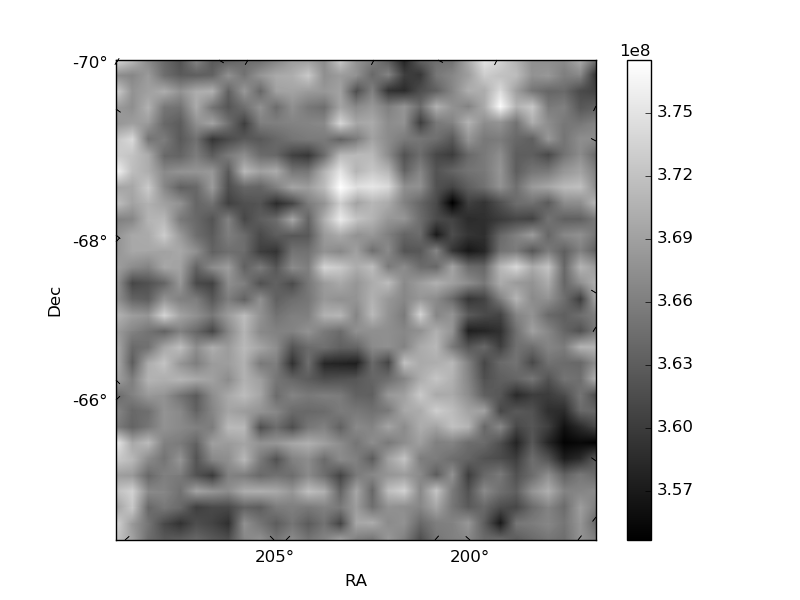
Quadrant B |
|---|---|---|---|
| Quadrant D | 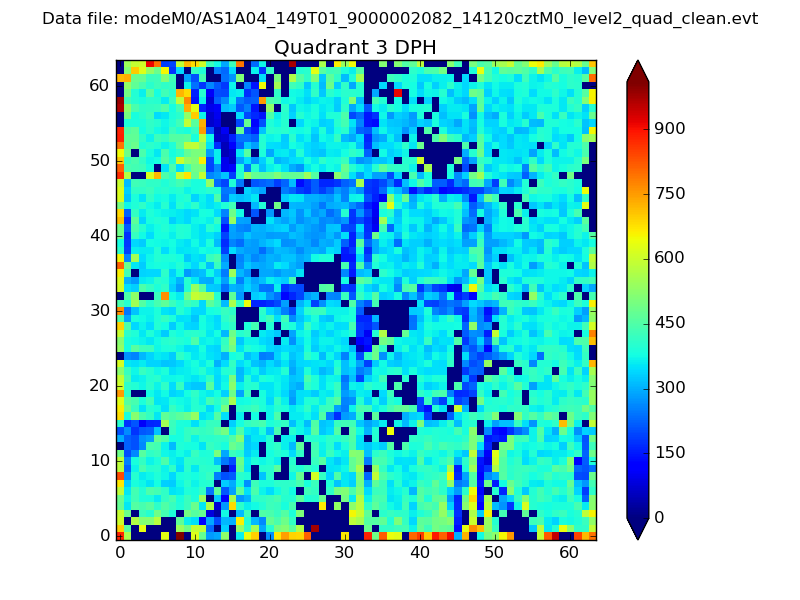 |
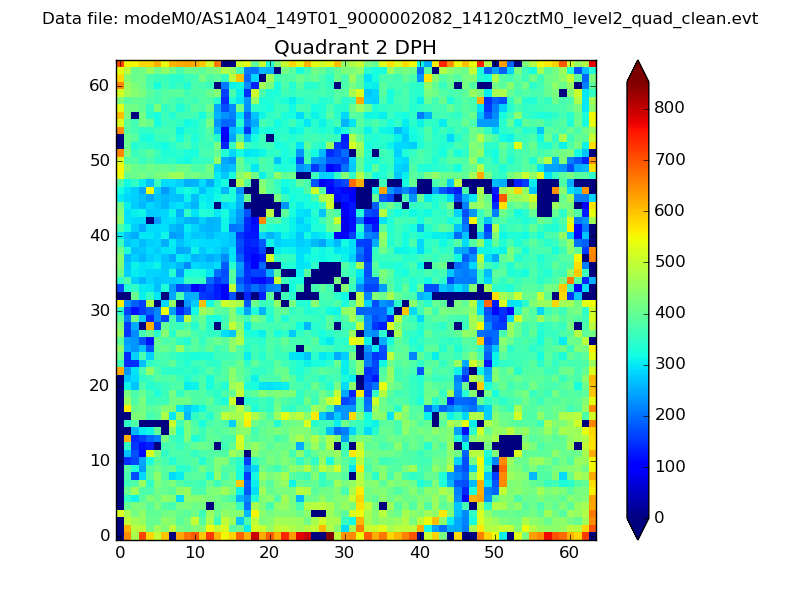 |
Quadrant C |
| Plot type | Count rate plots | Images |
|---|---|---|
| Comparison with Poisson distribution Blue bars denote a histogram of data divided into 1 sec bins. Red curve is a Poisson curve with rate = median count rate of data. |
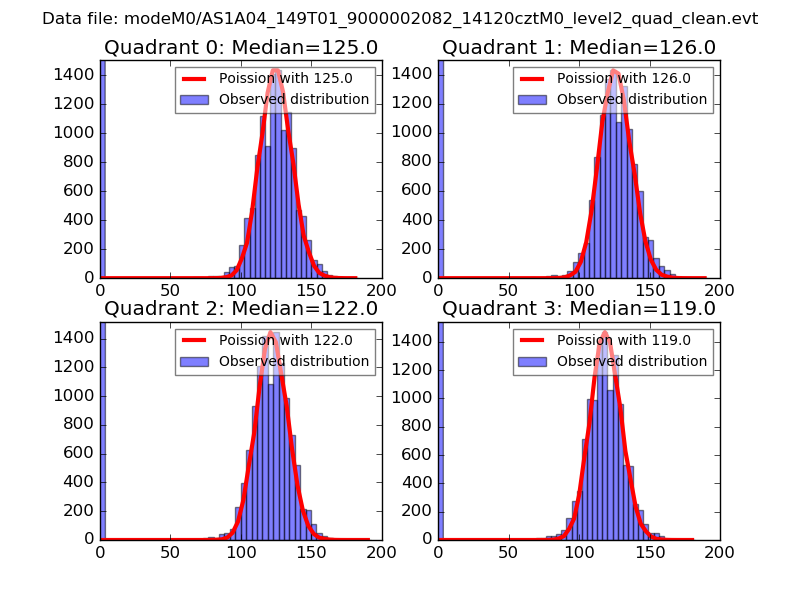 |
 |
| Quadrant-wise count rates Data is divided into 100 sec bins |
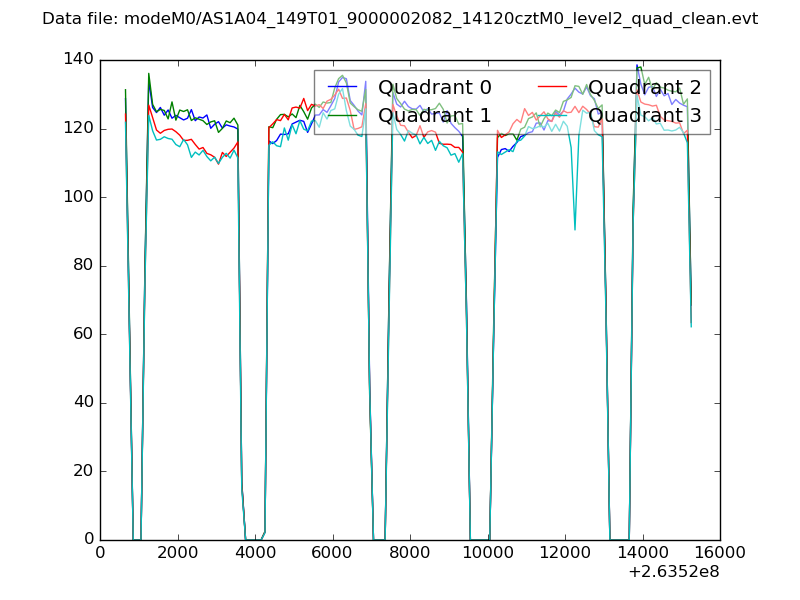 |
|
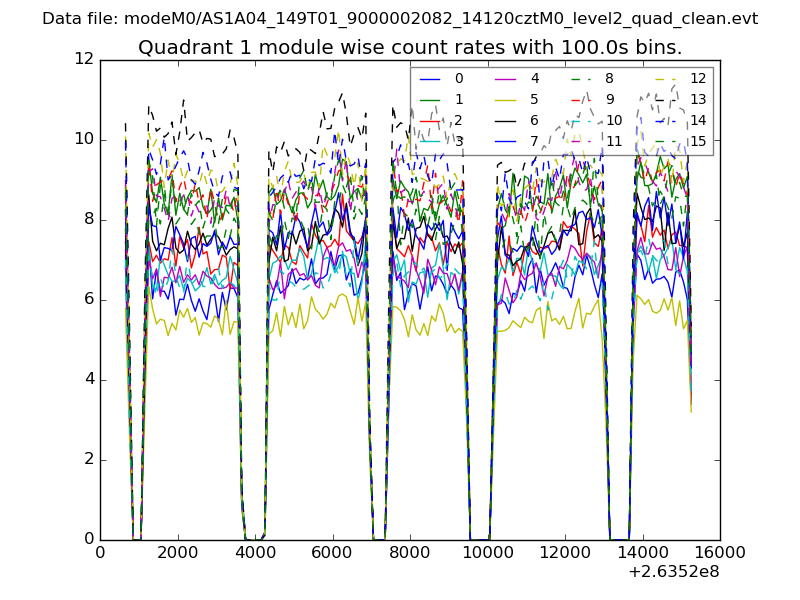
| Module-wise count rates for Quadrant A Data is divided into 100 sec bins |
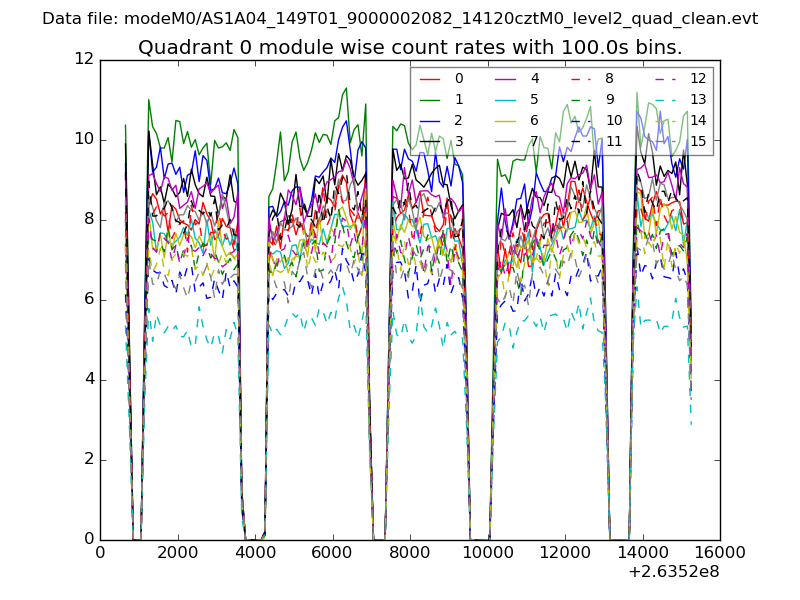 |
 |
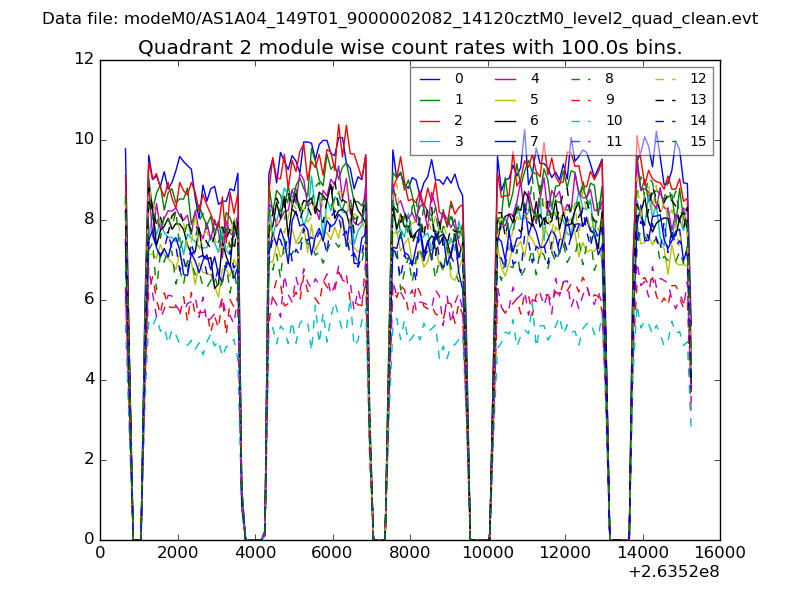
| Module-wise count rates for Quadrant B Data is divided into 100 sec bins |
 |
 |
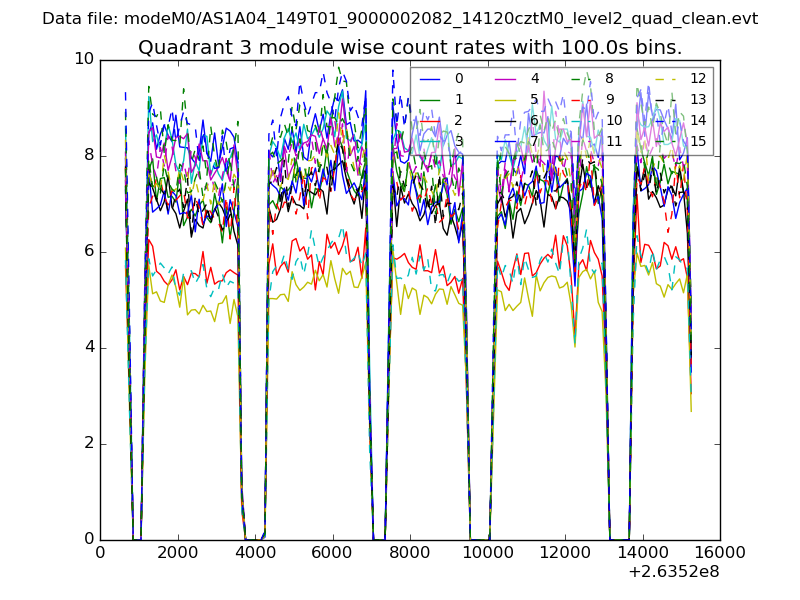
| Module-wise count rates for Quadrant C Data is divided into 100 sec bins |
 |
 |
| Module-wise count rates for Quadrant D Data is divided into 100 sec bins |
 |
 |
| Parameter | Plot |
|---|---|
| CZT HV Monitor | 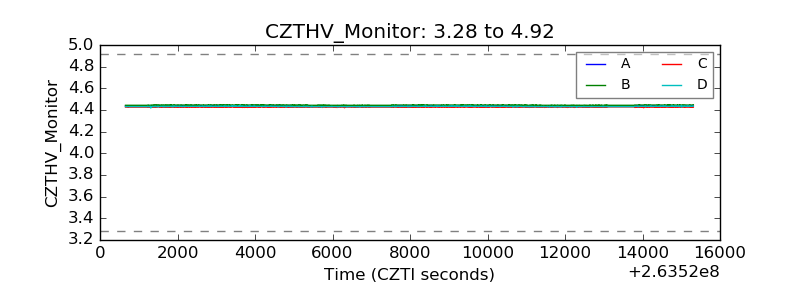 |
| D_VDD | 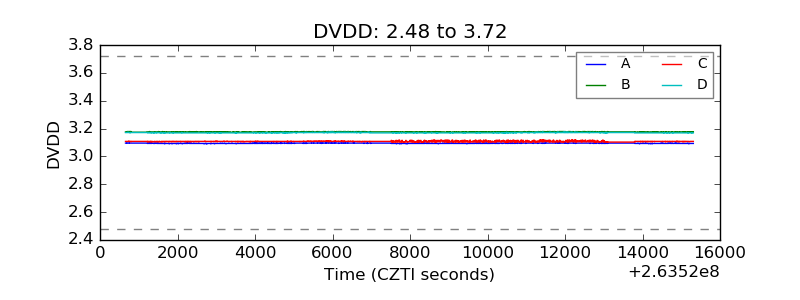 |
| Temperature 1 | 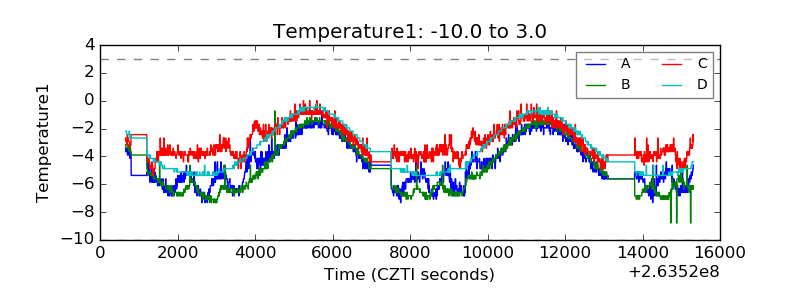 |
| Veto HV Monitor | 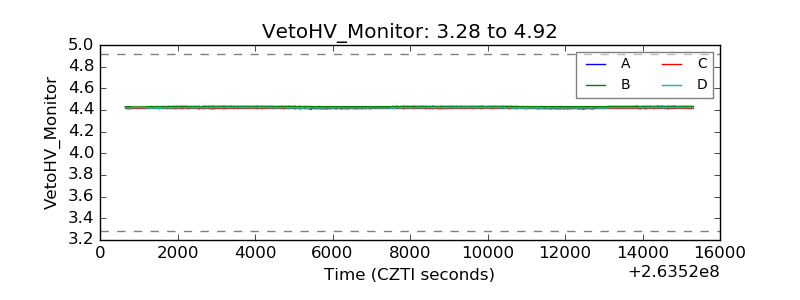 |
| Veto LLD | 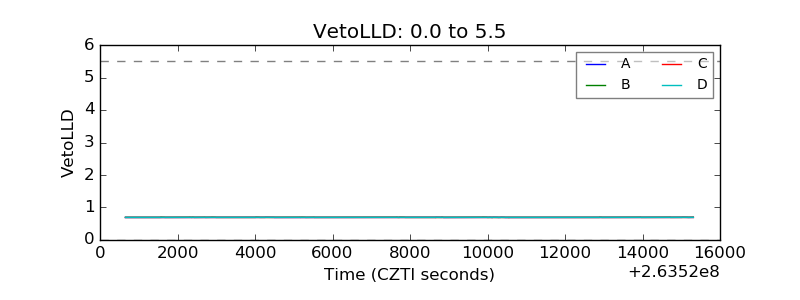 |
| Alpha Counter | 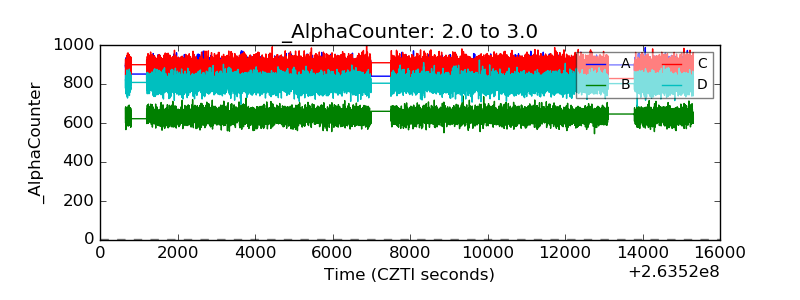 |
| _CPM_Rate | 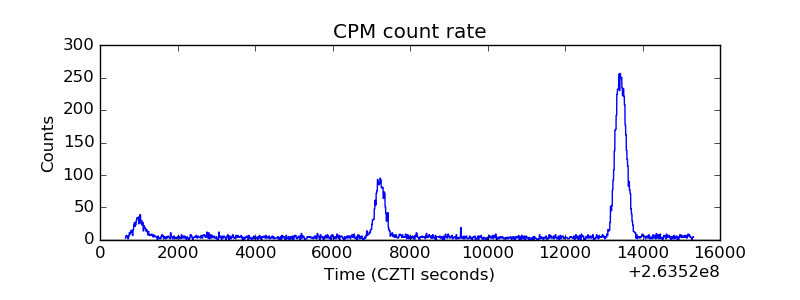 |
| CZT Counter | 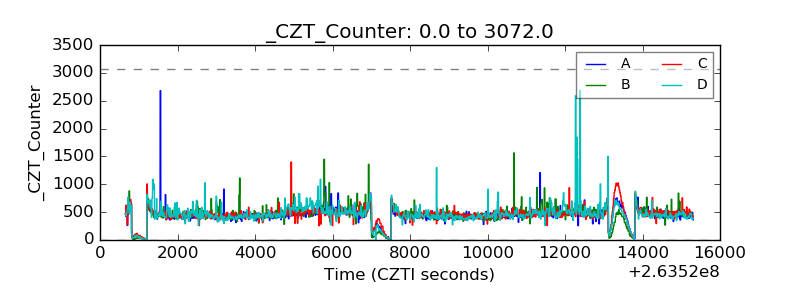 |
| +2.5 Volts monitor |  |
| +5 Volts monitor | 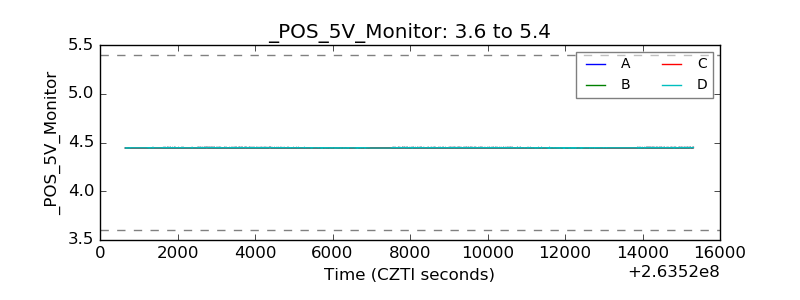 |
| _ROLL_ROT | 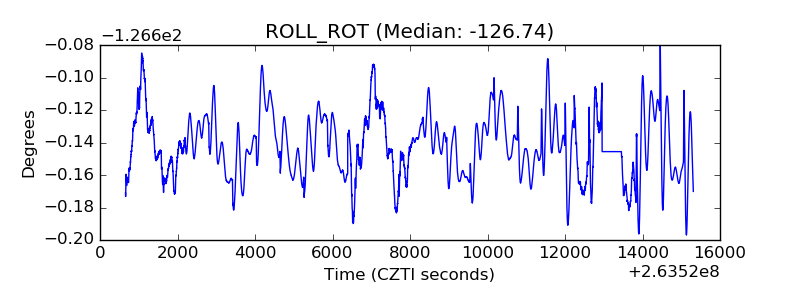 |
| _Roll_DEC | 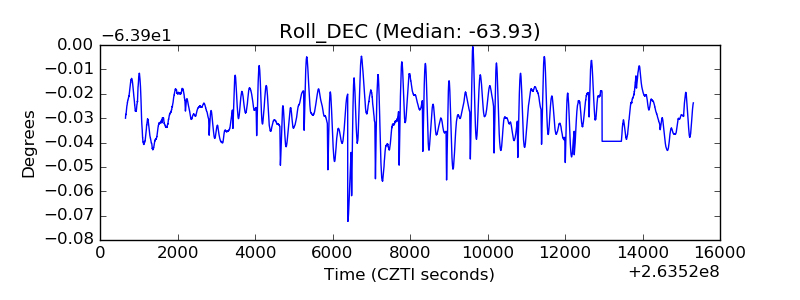 |
| _Roll_RA | 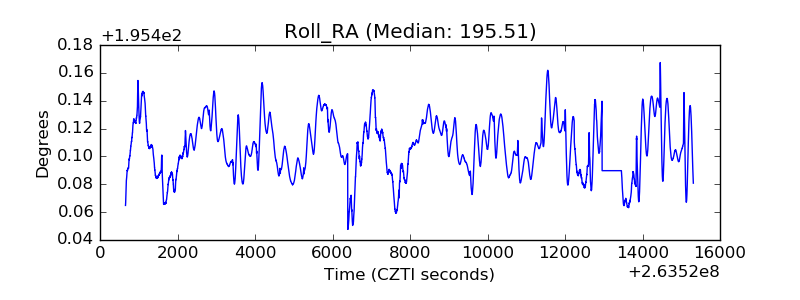 |
| Veto Counter | 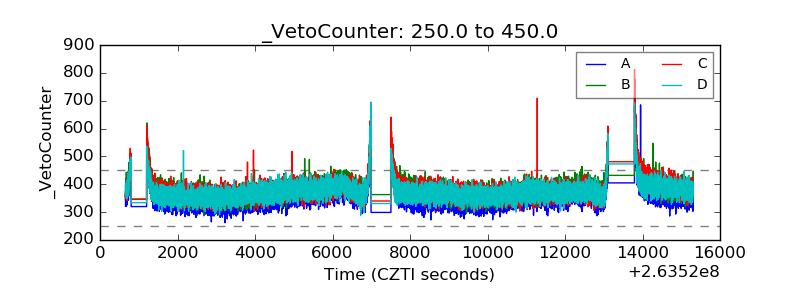 |