| Param | Original file | Final file |
|---|---|---|
| Filename | modeM0/AS1A04_149T01_9000002082_14121cztM0_level2.evt | modeM0/AS1A04_149T01_9000002082_14121cztM0_level2_quad_clean.evt |
| Size (bytes) | 427,942,080 | 99,449,280 |
| Size | 408.1 MB | 94.8 MB |
| Events in quadrant A | 2,855,683 | 654,898 |
| Events in quadrant B | 3,309,130 | 659,703 |
| Events in quadrant C | 3,072,594 | 642,982 |
| Events in quadrant D | 3,303,874 | 623,945 |
| Mode SS | |||
|---|---|---|---|
| Quadrant | BADHDUFLAG | Total packets | Discarded packets |
| A | 0 | 124 | 0 |
| B | 0 | 124 | 0 |
| C | 0 | 124 | 0 |
| D | 0 | 124 | 0 |
| Mode M0 | |||
|---|---|---|---|
| Quadrant | BADHDUFLAG | Total packets | Discarded packets |
| A | 0 | 12570 | 2 |
| B | 0 | 13771 | 1 |
| C | 0 | 12837 | 1 |
| D | 0 | 13925 | 1 |
| Mode M9 | |||
|---|---|---|---|
| Quadrant | BADHDUFLAG | Total packets | Discarded packets |
| A | 0 | 9 | 0 |
| B | 0 | 9 | 0 |
| C | 0 | 9 | 0 |
| D | 0 | 9 | 0 |
| Quadrant | Total seconds | Saturated seconds | Saturation percentage |
|---|---|---|---|
| A | 6167 | 55 | 0.891844% |
| B | 6167 | 103 | 1.670180% |
| C | 6167 | 49 | 0.794552% |
| D | 6167 | 52 | 0.843198% |
Noise dominated data is calculated using 1-second bins in cleaned event files. If a bin has >2000 counts, and if more than 50% of those come from <1% of pixels, then it is considered to be noise-dominated and hence unusable.
| Quadrant | # 1 sec bins | Bins with >0 counts | Bins with >2000 counts | High rate bins dominated by noise | Noise dominated (total time) | Noise dominated (detector-on time) | Marked lightcurve |
|---|---|---|---|---|---|---|---|
| A | 7013 | 6170 | 0 | 0 | 0.00% | 0.00% | 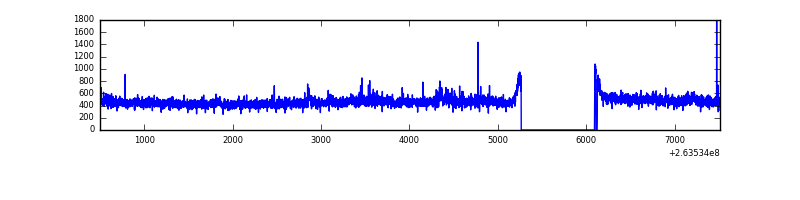 |
| B | 7013 | 6170 | 31 | 31 | 0.44% | 0.50% | 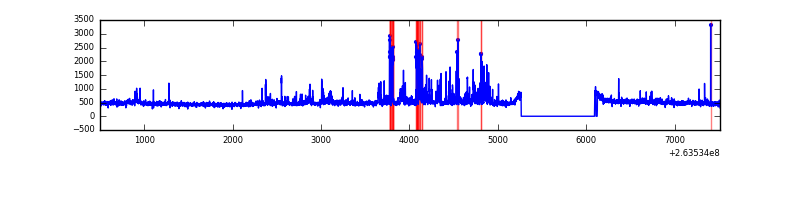 |
| C | 7013 | 6170 | 0 | 0 | 0.00% | 0.00% | 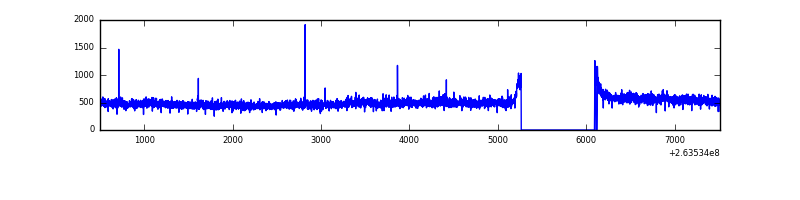 |
| D | 7013 | 6170 | 8 | 8 | 0.11% | 0.13% | 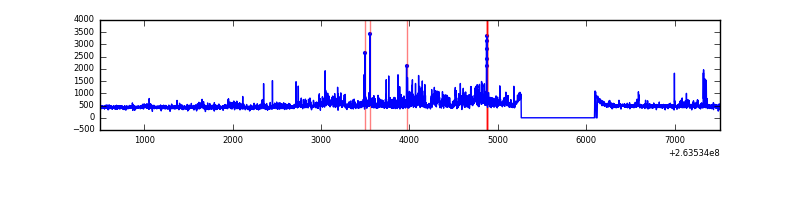 |
Top three noisy pixels from each quadrant. If the there are fewer than three noisy pixels in the level2.evt file, extra rows are filled as -1
| Pixel properties | Quadrant properties | ||||||
|---|---|---|---|---|---|---|---|
| Quadrant | DetID | PixID | Counts | Sigma | Mean | Median | Sigma |
| A | 12 | 189 | 52173 | 348.67 | 726 | 708 | 147.6 |
| A | 12 | 96 | 8335 | 51.67 | 726 | 708 | 147.6 |
| A | 0 | 226 | 6530 | 39.44 | 726 | 708 | 147.6 |
| B | 0 | 85 | 295903 | 2126.2 | 728 | 710 | 138.8 |
| B | 0 | 189 | 69509 | 495.54 | 728 | 710 | 138.8 |
| B | 3 | 209 | 23735 | 165.84 | 728 | 710 | 138.8 |
| C | 3 | 233 | 297114 | 1808.2 | 709 | 711 | 163.9 |
| C | 10 | 22 | 5714 | 30.52 | 709 | 711 | 163.9 |
| C | 13 | 61 | 4975 | 26.01 | 709 | 711 | 163.9 |
| D | 1 | 52 | 396162 | 2332.46 | 704 | 686 | 169.6 |
| D | 2 | 152 | 109672 | 642.78 | 704 | 686 | 169.6 |
| D | 15 | 0 | 59903 | 349.25 | 704 | 686 | 169.6 |
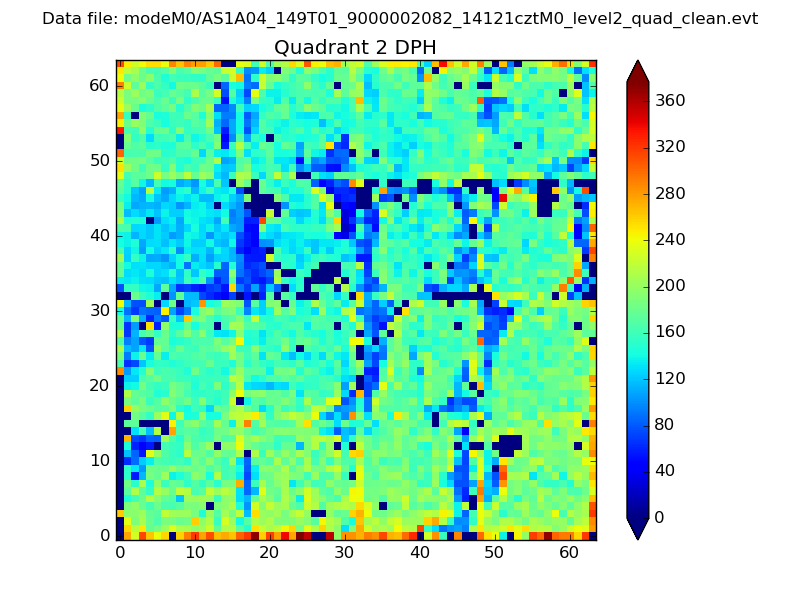
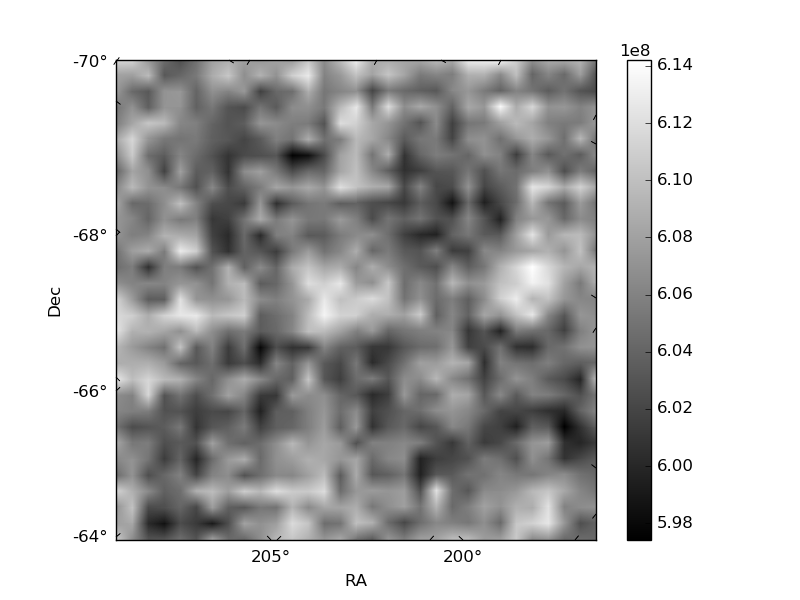
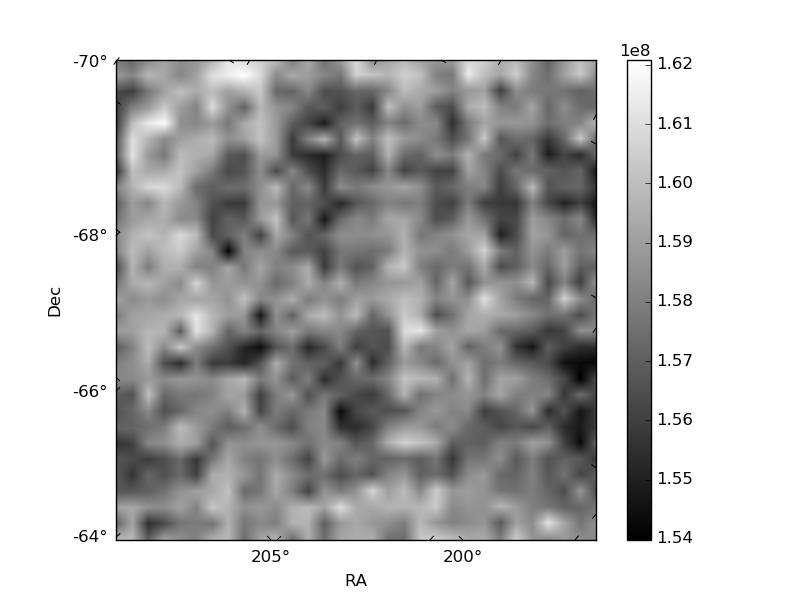
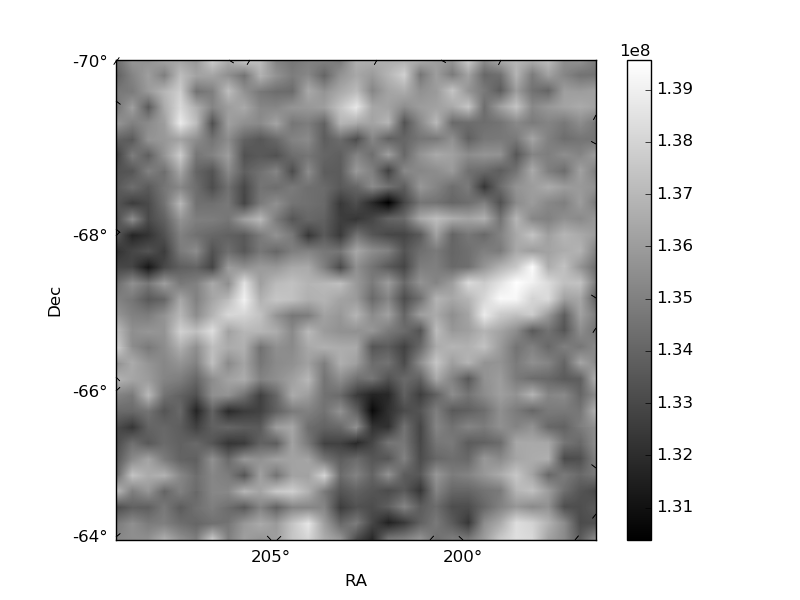
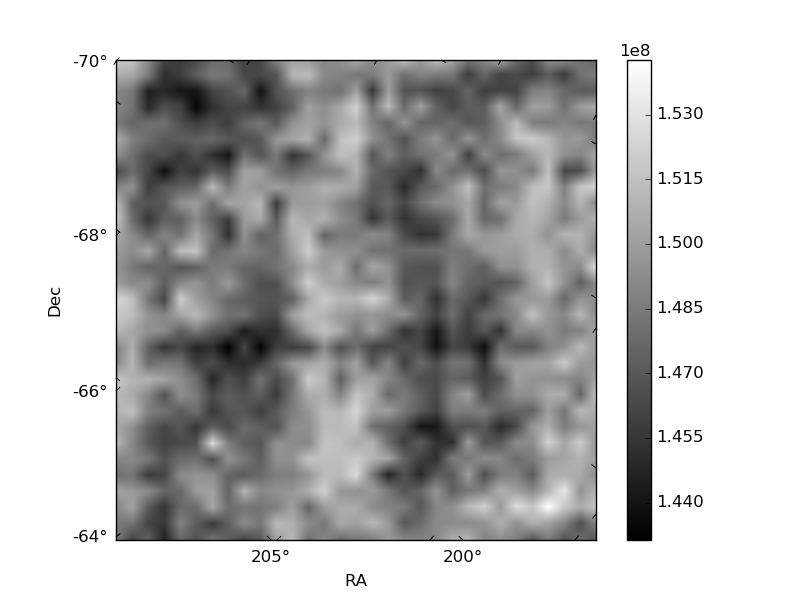
Histogram calculated using DETX and DETY for each event in the final _common_clean file
| Quadrant A | 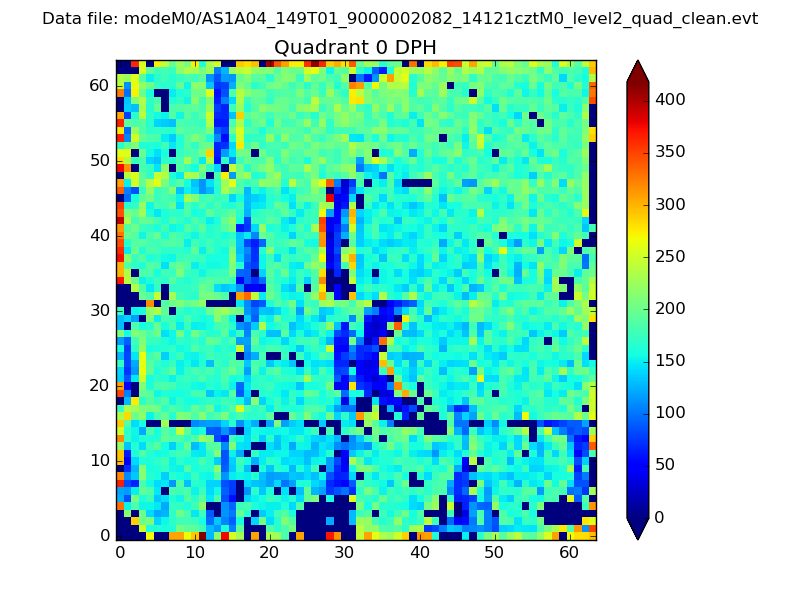 |
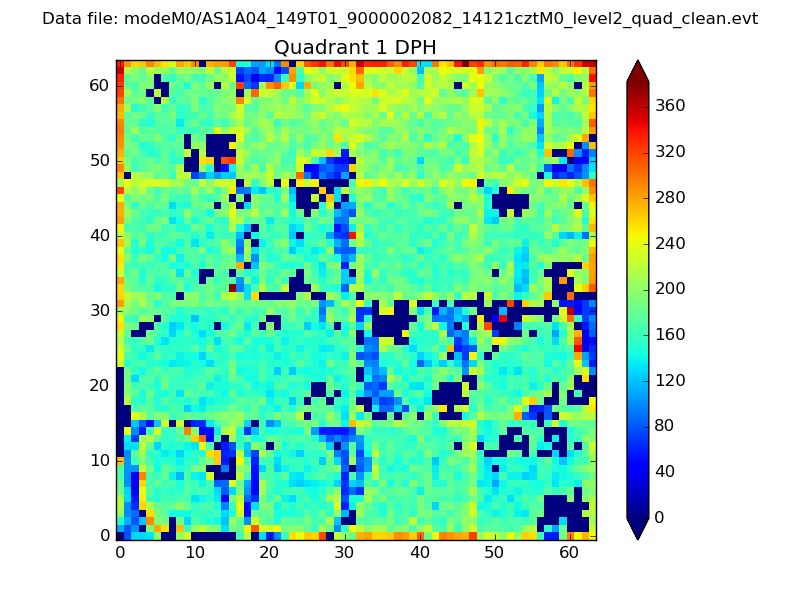 |
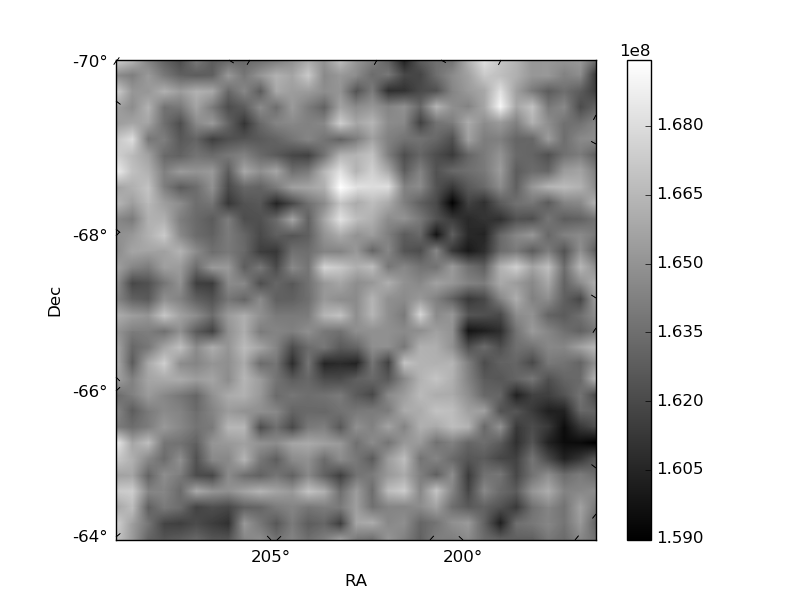
Quadrant B |
|---|---|---|---|
| Quadrant D | 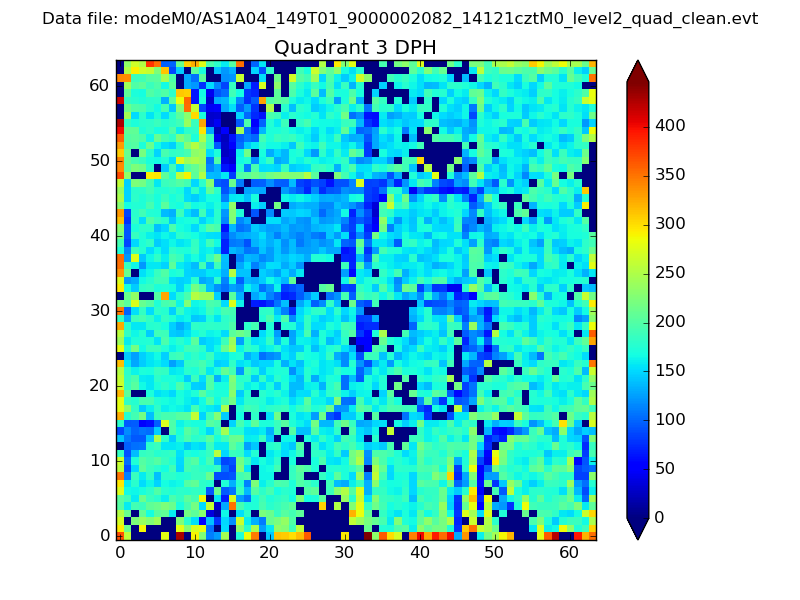 |
 |
Quadrant C |
| Plot type | Count rate plots | Images |
|---|---|---|
| Comparison with Poisson distribution Blue bars denote a histogram of data divided into 1 sec bins. Red curve is a Poisson curve with rate = median count rate of data. |
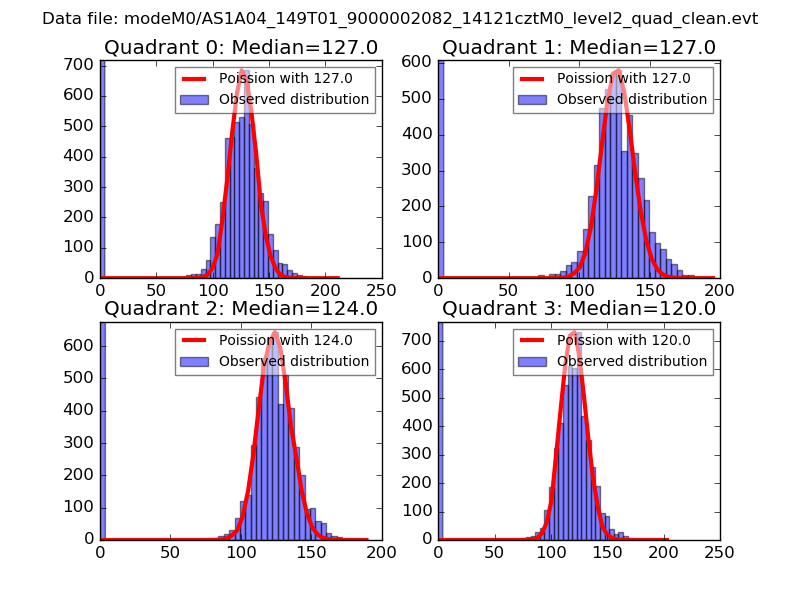 |
 |
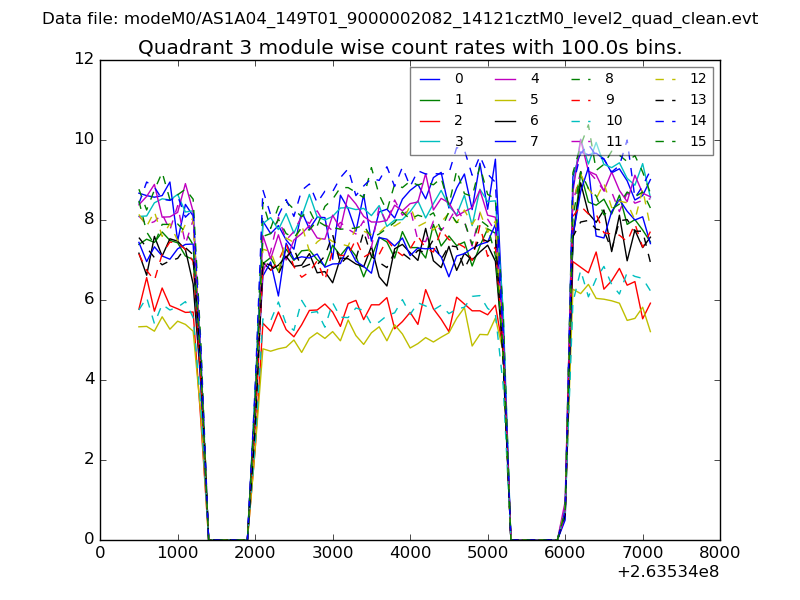
| Quadrant-wise count rates Data is divided into 100 sec bins |
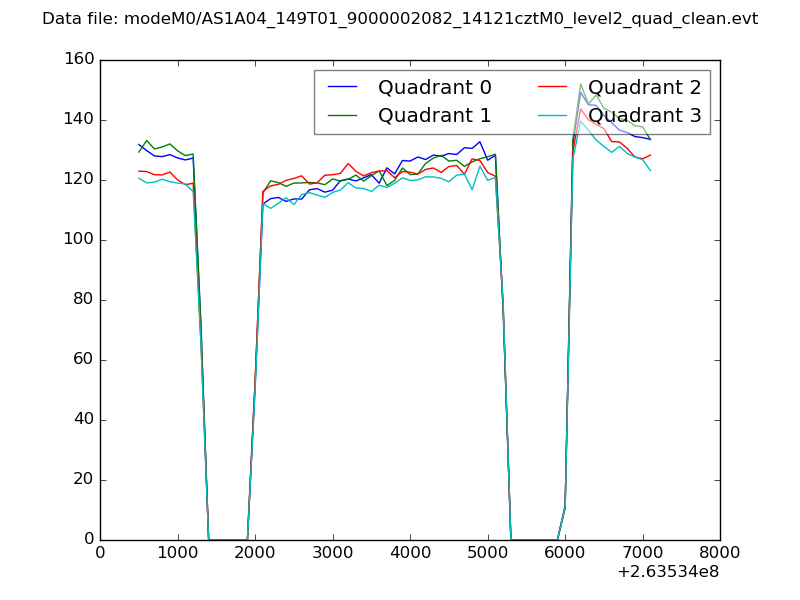 |
|
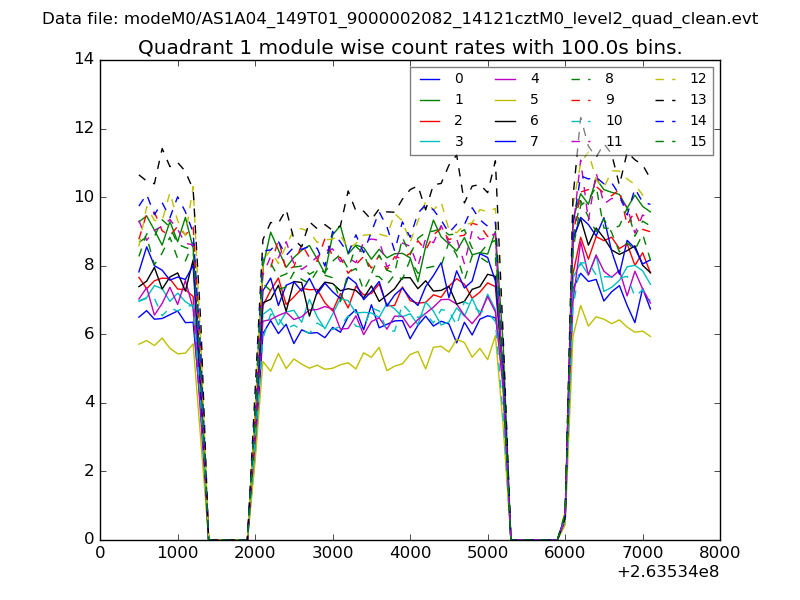
| Module-wise count rates for Quadrant A Data is divided into 100 sec bins |
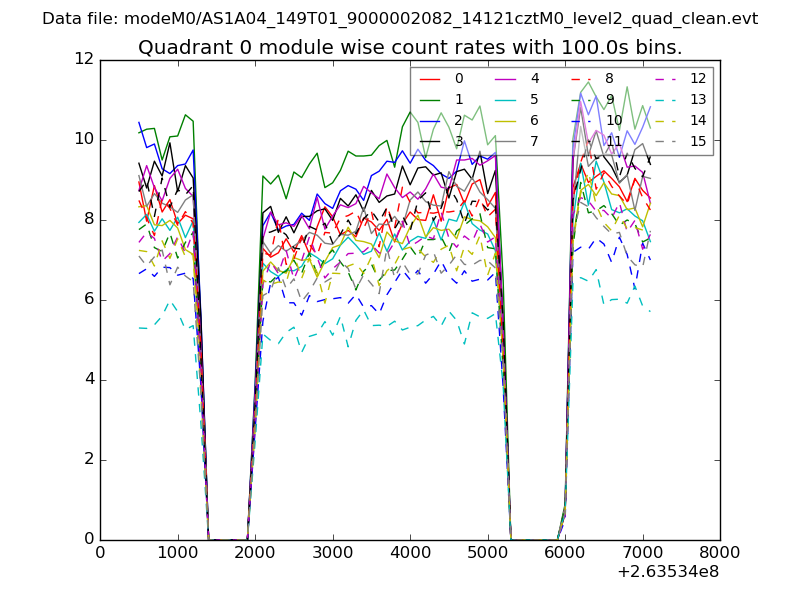 |
 |
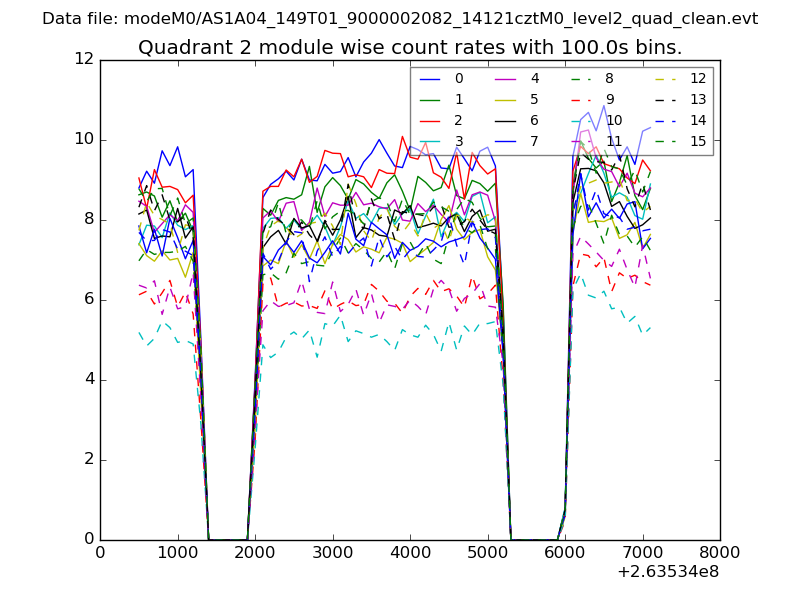
| Module-wise count rates for Quadrant B Data is divided into 100 sec bins |
 |
 |
| Module-wise count rates for Quadrant C Data is divided into 100 sec bins |
 |
 |
| Module-wise count rates for Quadrant D Data is divided into 100 sec bins |
 |
 |
| Parameter | Plot |
|---|---|
| CZT HV Monitor | 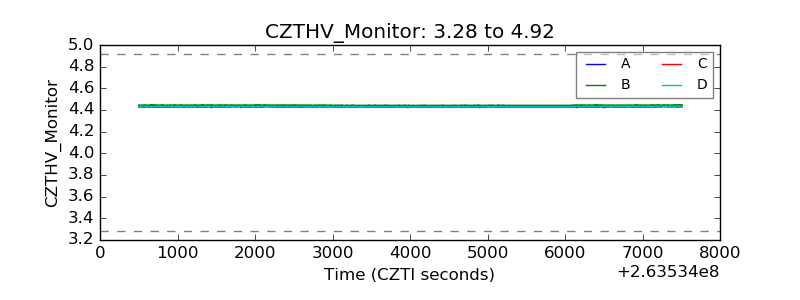 |
| D_VDD | 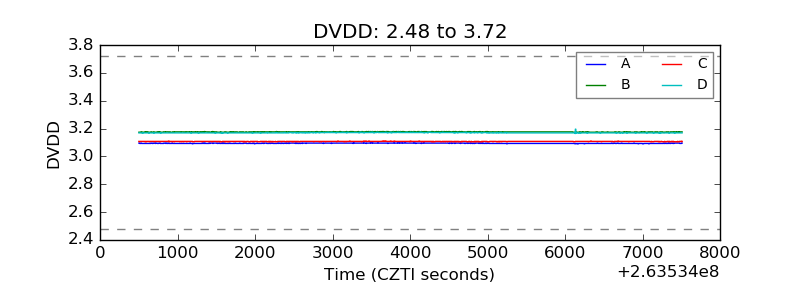 |
| Temperature 1 | 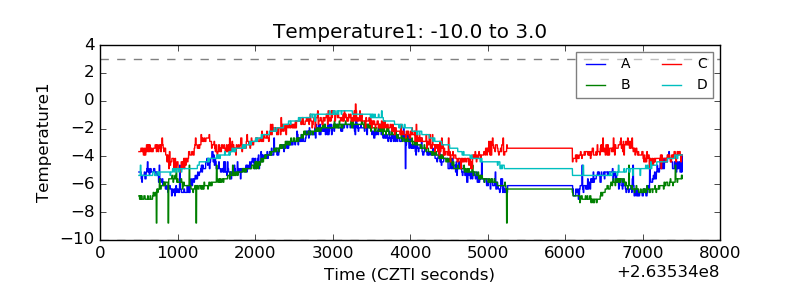 |
| Veto HV Monitor | 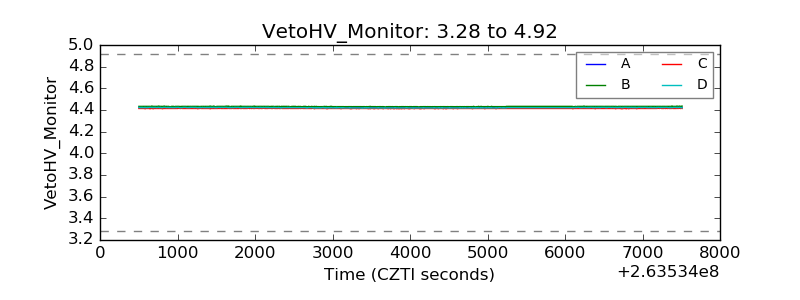 |
| Veto LLD | 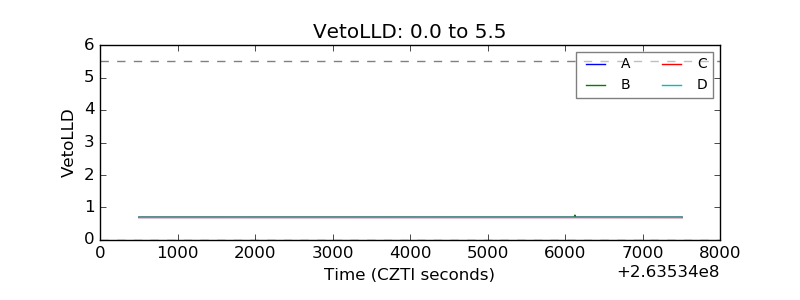 |
| Alpha Counter | 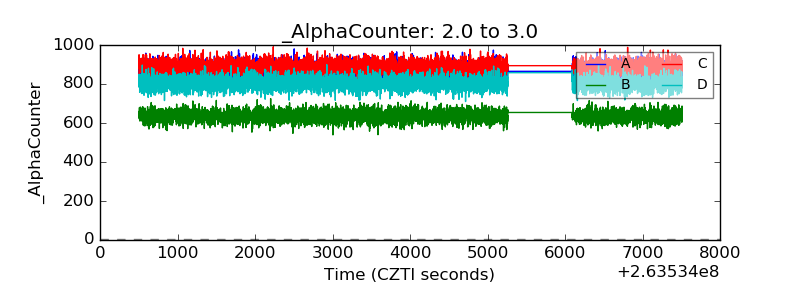 |
| _CPM_Rate | 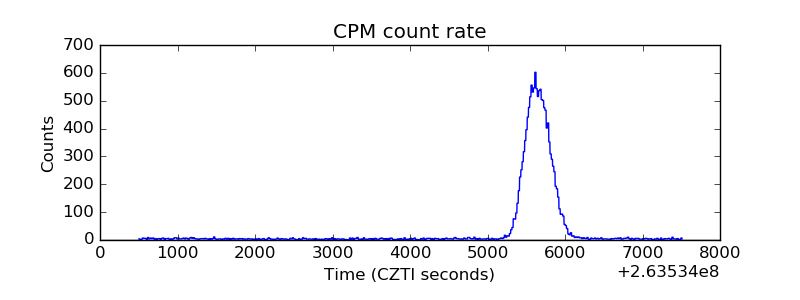 |
| CZT Counter | 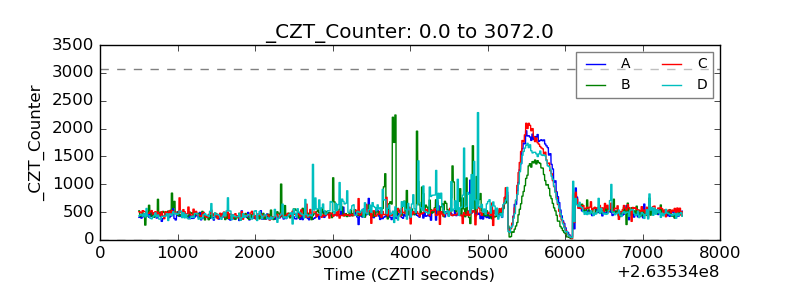 |
| +2.5 Volts monitor |  |
| +5 Volts monitor |  |
| _ROLL_ROT | 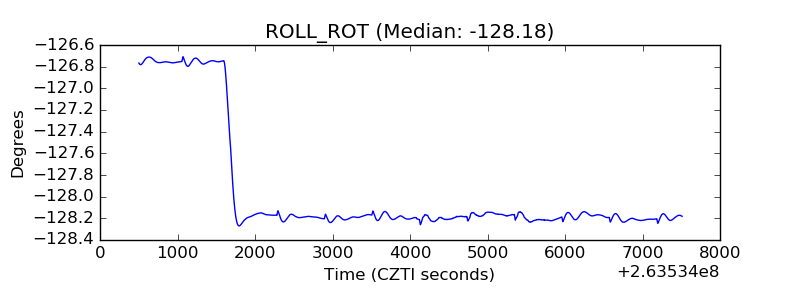 |
| _Roll_DEC | 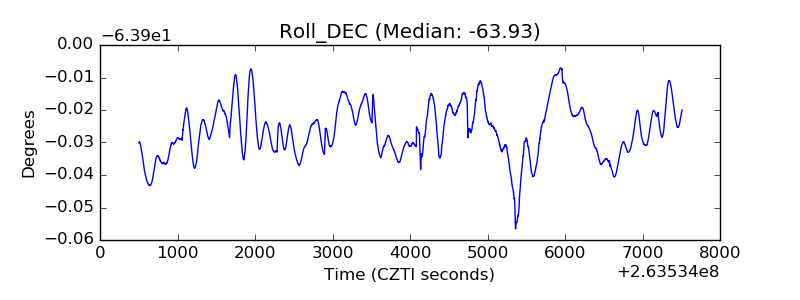 |
| _Roll_RA | 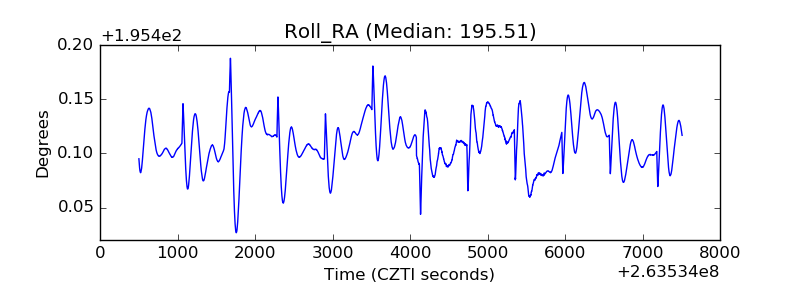 |
| Veto Counter | 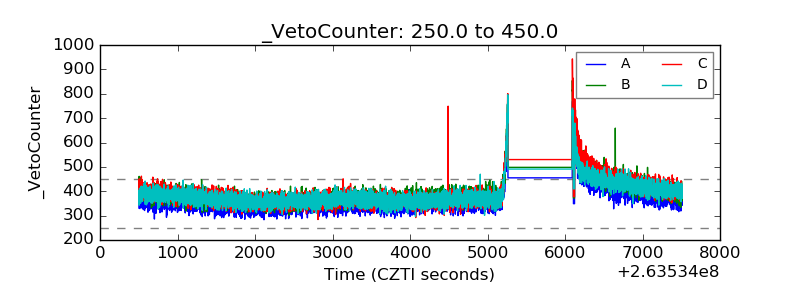 |